. 2022 Jan;117(1):121-142.
doi: 10.1111/mmi.14808. Epub 2021 Sep 25.

Inactivation of RNase P in Escherichia coli significantly changes post-transcriptional RNA metabolism

Affiliations

Inactivation of RNase P in Escherichia coli significantly changes post-transcriptional RNA metabolism

Bijoy K Mohanty et al. Mol Microbiol. 2022 Jan.

Abstract

Ribonuclease P (RNase P), which is required for the 5'-end maturation of tRNAs in every organism, has been shown to play a limited role in other aspects of RNA metabolism in Escherichia coli. Using RNA-sequencing (RNA-seq), we demonstrate that RNase P inactivation affects the abundances of ~46% of the expressed transcripts in E. coli and provide evidence that its essential function is its ability to generate pre-tRNAs from polycistronic tRNA transcripts. The RNA-seq results agreed with the published data and northern blot analyses of 75/83 transcripts (mRNAs, sRNAs, and tRNAs). Changes in transcript abundances in the RNase P mutant also correlated with changes in their half-lives. Inactivating the stringent response did not alter the rnpA49 phenotype. Most notably, increases in the transcript abundances were observed for all genes in the cysteine regulons, multiple toxin-antitoxin modules, and sigma S-controlled genes. Surprisingly, poly(A) polymerase (PAP I) modulated the abundances of ~10% of the transcripts affected by RNase P. A comparison of the transcriptomes of RNase P, RNase E, and RNase III mutants suggests that they affect distinct substrates. Together, our work strongly indicates that RNase P is a major player in all aspects of post-transcriptional RNA metabolism in E. coli.

Keywords: genome-wide RNA-seq; polyadenylation; sRNA; transcriptome.


Figures

Figure 1.
Figure 1.
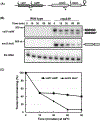
A time-course measurement of the catalytic activity of the temperature sensitive RNase P (containing RnpA49 protein) at 44°C. The bacterial strains were initially grown at 30°C until they entered exponential growth when they were shifted to 44°C along with the addition of rifampicin and nalidixic acid as described in the Experimental Procedures. Total RNA (10 μg/lane) isolated at various time points after rifampicin addition (indicated at the top of the blot) was separated on a 6% (w/v) acrylamide/ 8 M urea gel, transferred to nylon membrane and probed with transcript specific 32P-labelled oligonucleotide probes. (A) Graphical presentation of valV valW and secG leuU operons. Relative positions of the oilgonucleotide probes (inverted arrows, a: VALV-W and b: SECG-227, Supplementary Table S7) used in the northern blot analysis are shown below the cartoon. RNase P cleavage sites (Mohanty and Kushner, 2007) are shown as downward arrow above the cartoon. (B) The representative northern blots showing the processing of valV valW (probed with VALV-W) and secG leuU (probed with SCEG-227) transcripts in the wild-type and rnpA49 mutants. The processing intermediates (*: 5’ truncated species) that serve as substrates for RNase P are shown to the right of the blots and have been described previously (Mohanty and Kushner, 2007, 2008). The molecular size standard (nt, Riboruler low range RNA ladder,Thermo Fisher Scientific) are shown to the left of the northern blot. The northern blot of 5S rRNA used as a loading control is shown below. The same blot was probed sequentially for the three RNAs. (C) A graphical presentation of the remaining of the processing intermediates at various times. The intensity of the bands in (B) was quantified using ImageQuant TL (V7) software and the values as the percentage of transcript remaining compared to the 0-minute time point were plotted (average data from two independent northern blot analyses) as a function of time.
Figure 2.
Figure 2.
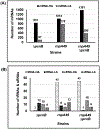
Comparison of total number of (A) mRNAs, and (B) tRNAs and sRNAs with higher abundance (HA) and lower abundance (LA) detected in different genetic backgrounds by RNA-seq analyses. Some of the coding sequences included in the mRNA category could in fact be sRNAs, since all true coding sequences have not yet been identified.
Figure 3.
Figure 3.
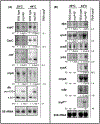
Northern blot analyses to determine the steady-state levels of selected transcripts in the rnpA49 mutant. Total RNA (10-15 μg/lane) isolated from exponentially growing cultures either at 30°C or after shifting to 44°C for one hour were separated either on 6% (w/v) polyacrylamide/ 8 M urea (panel A) or 1% (w/v) agarose/glyoxal gels (panels B and C) and transferred to nylon membranes as described in Experimental Procedures. Blots were probed with 32P-end labelled oligonucleotide probes (Supplementary Table S7) specific for each of the transcript. Genotypes of the strains are shown at the top. The normalized intensity of each band (either to 5S rRNA or 23S rRNA) was used to calculate the fold-change (FC) (compared to the wild type) for each transcript and reported as an average of two independent determinations in the Supplementary Table S2. The representative northern blots are shown in panels A, B and C. The fold changes observed in the RNA-seq analyses are indicated to the right of the blots. Both pre-4.5S and 4.5S transcripts (shown to the left of the blot) were added to calculate the ffs FC (*). nd: Not determined. up: visible only in the rnpA49 mutant. (C) Graphical presentation of the yeeE yeeD operon (not drawn to scale). The inverted arrows (a: YEEE-550 and b: YEED-1370) indicate the positions of the oligonucleotide probes (Supplementary Table S7). The representative northern blot of yeeE yeeD steady-state transcript levels detected using either probe a or b is shown below the cartoon. Processing intermediates for yeeED transcripts are shown to the right of the blot. Riboruler High range RNA ladder (Kb,Thermo Fisher Scientific) are shown to the left of the northern blot.
Figure 3.
Figure 3.
Northern blot analyses to determine the steady-state levels of selected transcripts in the rnpA49 mutant. Total RNA (10-15 μg/lane) isolated from exponentially growing cultures either at 30°C or after shifting to 44°C for one hour were separated either on 6% (w/v) polyacrylamide/ 8 M urea (panel A) or 1% (w/v) agarose/glyoxal gels (panels B and C) and transferred to nylon membranes as described in Experimental Procedures. Blots were probed with 32P-end labelled oligonucleotide probes (Supplementary Table S7) specific for each of the transcript. Genotypes of the strains are shown at the top. The normalized intensity of each band (either to 5S rRNA or 23S rRNA) was used to calculate the fold-change (FC) (compared to the wild type) for each transcript and reported as an average of two independent determinations in the Supplementary Table S2. The representative northern blots are shown in panels A, B and C. The fold changes observed in the RNA-seq analyses are indicated to the right of the blots. Both pre-4.5S and 4.5S transcripts (shown to the left of the blot) were added to calculate the ffs FC (*). nd: Not determined. up: visible only in the rnpA49 mutant. (C) Graphical presentation of the yeeE yeeD operon (not drawn to scale). The inverted arrows (a: YEEE-550 and b: YEED-1370) indicate the positions of the oligonucleotide probes (Supplementary Table S7). The representative northern blot of yeeE yeeD steady-state transcript levels detected using either probe a or b is shown below the cartoon. Processing intermediates for yeeED transcripts are shown to the right of the blot. Riboruler High range RNA ladder (Kb,Thermo Fisher Scientific) are shown to the left of the northern blot.
Figure 4.
Figure 4.
Northern blot analyses to determine the effect of relA on the steady-state transcript levels in the rnpA49 mutant. Total RNA (20 μg/lane) isolated from exponentially growing cultures after shifting from 30°C to 44°C for one hour were separated on 1% (w/v) agarose/glyoxal gels and transferred to a nylon membrane. Blots were probed with 32P-end labelled oligonucleotide probes (Supplementary Table S7) specific for each of the transcripts. Genotypes of the strains are shown at the top. The normalized intensity of each band to 23S rRNA was used to calculate the fold-change (FC) compared to the wild type for each transcript and reported as an average of two independent determinations.
Figure 5.
Figure 5.
Comparison of transcript half-lives between the wild-type control and rnpA49 mutant at the nonpermissive temperature. All half-lives were determined after one hour of growth at 44°C as described in the Experimental Procedures and represent the average of two independent determinations. Letters in parenthesis denotes the category as explained in the text. >: No transcript was detected beyond the 2 min time point in the wild type strain. <: No transcript detected at zero minutes, which was 70 seconds after rifampicin addition.
Figure 6.
Figure 6.
Northern blot analyses to determine the half-lives of high abundance transcripts. Total RNA (20 μg/lane) isolated at times (minutes after rifampicin addition) from exponentially growing cultures after shifting from 30°C to 44°C for one hour were separated on 1% (w/v) agarose/glyoxal gels and transferred to a nylon membrane. Blots were probed with gene specific 32P-end labelled oligonucleotide probes (rpoS: RPOS-1017 and rseA: RSEA-905, Supplementary Table S7). The representative northern blot of (A) rpoS and (B) rseA. Graphical presentation of rseA gene in the rpoE operon (not drawn to scale) is shown above the blot. Relative position of the oligonucleotide probe c (RSEA-905) for rseA (inverted arrow) is shown below the cartoon. Genotypes are shown on top of each blot. The intensity of each band normalized to 23S rRNA (C) was used to calculate the half-lives. The values (log of the percentage of transcript remaining compared to the 0 minute time point) were plotted as a function of time to determine the half-life of each transcript (shown below each strain) as an average of two independent determinations. Riboruler High range RNA ladder (Kb, Thermo Fisher Scientific) is shown to the right of the northern blot.
Figure 7.
Figure 7.
Northern blot analyses to determine the half-lives of low abundance transcripts. Total RNA (10-20 μg/lane) isolated at times (minutes after rifampicin addition) from exponentially growing cultures after shifting from 30°C to 44°C for one hour were separated either on 6% PAGE with 8M urea (cspC, CsrC and 5S rRNA) or on a 1% (w/v) agarose/glyoxal gel (udp and 23S rRNA) and transferred to nylon membranes. Blots were probed with gene specific 32P-end labelled oligonucleotide probes (Supplementary Table S7). Genotypes are shown at the top. The normalized intensity of each band (either to 5S rRNA or 23S rRNA) were used to calculate the half-lives as described in the legends to Figure 6 (shown below each strain as an average of two independent determinations).
Figure 8.
Figure 8.
Northern blot analysis of the steady-state transcript levels of relB operon in various genetic backgrounds by northern blot analyses. Total RNA (15 μg/lane) isolated from exponentially growing cultures after shifting from 30°C to 44°C for one hour was separated on a 1% (w/v) agarose/glyoxal gel and transferred to a nylon membrane and probed with gene specific 32P-end labelled oligonucleotide probe. (A) Graphical presentation of relB operon (not drown to scale) and relative position of the relE specific probe d (RELE-424, Supplementary Table S7) (inverted arrow). (B) Northern blot probed with RELE-424. Genotypes are shown on top of the blot. The normalized intensity (to 23S rRNA) of each band was used to calculate the fold-change (FC) to the wild type strain as an average of two independent determinations. The FC obtained from RNA-seq data is also shown. The blot was also probed with relB (RELB-207) and hokD (HOKD-794) specific probes (Supplementary Table S7), which showed hybridization to the same band (data not shown).
Figure 9.
Figure 9.
Overview of change in transcript abundance in all funtional categories in the rnpA49 mutant compared to the wild type control at the nonpermissive temperature. Percentage of transcripts with higher (HA) or lower (LA) abundance in the rnpA49 mutant in each functional category were determined based on the total number of genes in that category (Table 2) (http://www.ncbi.nlm.mih.gov/COG/).
Figure 10.
Figure 10.
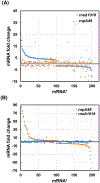
Effect of RNase P, RNase E and RNase III inactivation on various mRNA abundance. The fold change of mRNAs in the Δrne1018 and Δrnc-14 mutants observed previously using a high-density tiling microarray (Stead et al., 2011) were compared with the fold-changes of the same mRNAs in the rnpA49 mutant based on the current RNA-seq data. (A) The fold changes of 100 mRNAs with highest abundances and 100 mRNAs with lowest abundances in the rnpA49 single mutant were plotted pair-wise against the fold-changes of the same mRNAs in the Δrne1018 mutant. (B) The fold changes of 100 mRNAs with highest abundances and the 100 mRNAs with lowest abundances in the Δrne1018 mutant were plotted against the fold-changes of the same mRNAs in the rnpA49 mutant. (C) The fold changes of 29 mRNAs with highest abundances and the 30 mRNAs with lowest abundances in the Δrnc-14 mutant was plotted against the fold-changes of the same mRNAs in the rnpA49 mutant. The relative number of mRNAs affected in the Δrnc-14 mutant was much smaller compared to either in the Δrne1018 (Stead et al., 2011) or rnpA49 mutants. The mRNAs of cysteine regulon with their fold-changes in the rnpA49 mutant are highlighted. It should be noted that the RNase P data were obtained at 44°C, while the RNase E and RNase III experiments were carried out at 37°C. While no tRNAs are included in this analysis, some of the coding sequences considered as mRNAs (*) may in fact be non-coding RNAs (such as sRNA), since the functions of all the coding sequences have yet to be determined.
Figure 10.
Figure 10.
Effect of RNase P, RNase E and RNase III inactivation on various mRNA abundance. The fold change of mRNAs in the Δrne1018 and Δrnc-14 mutants observed previously using a high-density tiling microarray (Stead et al., 2011) were compared with the fold-changes of the same mRNAs in the rnpA49 mutant based on the current RNA-seq data. (A) The fold changes of 100 mRNAs with highest abundances and 100 mRNAs with lowest abundances in the rnpA49 single mutant were plotted pair-wise against the fold-changes of the same mRNAs in the Δrne1018 mutant. (B) The fold changes of 100 mRNAs with highest abundances and the 100 mRNAs with lowest abundances in the Δrne1018 mutant were plotted against the fold-changes of the same mRNAs in the rnpA49 mutant. (C) The fold changes of 29 mRNAs with highest abundances and the 30 mRNAs with lowest abundances in the Δrnc-14 mutant was plotted against the fold-changes of the same mRNAs in the rnpA49 mutant. The relative number of mRNAs affected in the Δrnc-14 mutant was much smaller compared to either in the Δrne1018 (Stead et al., 2011) or rnpA49 mutants. The mRNAs of cysteine regulon with their fold-changes in the rnpA49 mutant are highlighted. It should be noted that the RNase P data were obtained at 44°C, while the RNase E and RNase III experiments were carried out at 37°C. While no tRNAs are included in this analysis, some of the coding sequences considered as mRNAs (*) may in fact be non-coding RNAs (such as sRNA), since the functions of all the coding sequences have yet to be determined.
Figure 11.
Figure 11.
Northern blot analyses of specific tRNA transcripts with lower abundances in the rnpA49 mutant compared to the wild type control. Total RNA (10 μg/lane) isolated from exponentially growing culture after shifting from 30°C to 44°C for one hour were separated on 6% (w/v) acrylamide with 8 M urea and transferred to a nylon membrane. Blots were probed with 32P-end labelled oligonucleotide probes (Supplementary Table S7) specific to each transcrips. Genotypes are shown on top of the blot. The normalized intensity (to 5S rRNA) of each band was used to calculate the fold change (FC) compared to the wild type control and represents an average of two independent determinations. The FC obtained from RNA-seq data is also shown. NA: not applicable.

Similar articles

Cited by

References

    1. Agrawal A, Mohanty BK, and Kushner SR (2014). Processing of the seven valine tRNAs in Escherichia coli involves novel features of RNase P. Nucleic Acids Res 42, 11166–11179. - PMC - PubMed
    1. Alifano P, Rivellini F, Piscitelli C, Arraiano CM, Bruni CB, and Carlomagno MS (1994). Ribonuclease E provides substrates for ribonuclease P-dependent processing of a polycistronic mRNA. Genes Dev 8, 3021–3031. - PubMed
    1. Altuvia S, Weinstein-Fischer D, Zhang A, Postow L, and Storz G (1997). A small, stable RNA induced by oxidative stress: role as a pleiotropic regulator and antimutator. Cell 90, 43–53. - PubMed
    1. August J, Ortiz PJ, and Hurwitz J (1962). Ribonucleic acid-dependent ribonucleotide incorporation. I. Purification and properties of the enzyme. J Biol Chem 237, 3786–3793. - PubMed
    1. Babitzke P, and Kushner SR (1991). The Ams (altered mRNA stability) protein and ribonuclease E are encoded by the same structural gene of Escherichia coli. Proc Natl Acad Sci U S A 88, 1–5. - PMC - PubMed

Publication types

MeSH terms