

Alleviation of a polyglucosan storage disorder by enhancement of autophagic glycogen catabolism
- PMID: 34486811
- PMCID: PMC8495453
- DOI: 10.15252/emmm.202114554
Alleviation of a polyglucosan storage disorder by enhancement of autophagic glycogen catabolism
Abstract
This work employs adult polyglucosan body disease (APBD) models to explore the efficacy and mechanism of action of the polyglucosan-reducing compound 144DG11. APBD is a glycogen storage disorder (GSD) caused by glycogen branching enzyme (GBE) deficiency causing accumulation of poorly branched glycogen inclusions called polyglucosans. 144DG11 improved survival and motor parameters in a GBE knockin (Gbeys/ys ) APBD mouse model. 144DG11 reduced polyglucosan and glycogen in brain, liver, heart, and peripheral nerve. Indirect calorimetry experiments revealed that 144DG11 increases carbohydrate burn at the expense of fat burn, suggesting metabolic mobilization of pathogenic polyglucosan. At the cellular level, 144DG11 increased glycolytic, mitochondrial, and total ATP production. The molecular target of 144DG11 is the lysosomal membrane protein LAMP1, whose interaction with the compound, similar to LAMP1 knockdown, enhanced autolysosomal degradation of glycogen and lysosomal acidification. 144DG11 also enhanced mitochondrial activity and modulated lysosomal features as revealed by bioenergetic, image-based phenotyping and proteomics analyses. As an effective lysosomal targeting therapy in a GSD model, 144DG11 could be developed into a safe and efficacious glycogen and lysosomal storage disease therapy.
Keywords: adult polyglucosan body disease; autophagy; glycogen; lysosomes; polyglucosan.
© 2021 The Authors. Published under the terms of the CC BY 4.0 license.
Conflict of interest statement
Patent WO2018154578, awarded to OK and MW, pertains to 144DG11 results.
Figures

- A
Structural formula of 144DG11
- B
Kaplan‐Meier survival curve based on n = 17 144DG11‐treated and n = 9 vehicle‐treated animals. 144DG11 significantly increased survival (log‐rank test P‐value < 0.000692).
- C, D
Weight and (D) average duration in movement in an open field as a function of time after treating Gbeys/ys mice with vehicle (n = 8), or 144DG11 (n = 9).
- E
Upper panel, time spent at location (average based on n = 9 nine‐month‐old mice) is quantified as a heat map (blue (low) to red (high) scale). Lower panel, visual tracking examples from single animals. wt, vehicle‐treated wt animals; tg treated, 144DG11‐treated Gbeys/ys mice; tg, vehicle‐treated Gbeys/ys mice.
- F
Gait analysis of n = 9 nine‐month‐old mice treated with vehicle or 144DG11. Shown are average (± s.d.) stride lengths. A representative ink foot‐print trail is also shown for each arm. Statistically significant differences (one‐way ANOVA with Sidak’s post hoc tests) were demonstrated between 144DG11 and vehicle‐treated transgenic mice, and between transgenic and wt mice.
- G, H
Extension reflex as a function of time after treating Gbeys/ys mice with vehicle (n = 8), or 144DG11 (n = 9) (G), and, in another experiment (H), Gbeys/ys with vehicle (n = 8), or 144DG11 (n = 9), or wt mice with vehicle (n = 8).
- I, J
(I) (vehicle) and (J) (144DG11) show 7‐month‐old Gbeys/ys mice following 3 months under the respective treatments. Note unkempt fur in vehicle‐treated animal, which was improved by 144DG11.
- K
(K) Experimental design.
- L–N
(L) weight, (M) average duration in movement in an open field, and (N) extension reflex as a function of time after treating Gbeys/ys mice with vehicle (n = 8) or 144DG11 (n = 9) at 6 months of age (at onset).

Body weights of wild‐type C57Bl6J mice treated with 144DG11 for 3 months. Mice were injected twice a week with 150 μl of 144DG11 at 250 mg/kg in 5% DMSO (red, n = 5), or an equal volume of 5% DMSO (V, vehicle) control (black, n = 6). Injections were intravenous for the first month and then subcutaneous for the following 2 months. No significant change between the two treatments is observed. Error bars represent S.D.
Histology of 144DG11 tissues compared to vehicle control. Brain, liver, skeletal muscle, and heart slices of wild‐type C57Bl6J mice treated for 3 months with 144DG11 as in (A). The slices were stained by H&E staining in order to visualize lesions. No lesions were apparent in either treatment. Scale bars, 500 µm (brain), 100 µm (liver), 200 µm (muscle), 100 µm (heart).

Left panel, Mice, treated as indicated, were sacrificed, and the indicated tissues were collected and stained for PG (arrows) with PAS following diastase treatment. Scale bars, 200 µm (liver, muscle), 50 µm (cortex, heart, peripheral nerve). Right panel, PAS staining was quantified, as described in (Kakhlon et al, 2018), based on analysis of 4 sections from each tissue in n = 3 wt, n = 7 Gbeys/ys vehicle‐treated, and n = 9 144DG11‐treated mice.
Total glycogen in the indicated tissues, collected from n = 5 nine‐month‐old vehicle and 144DG11‐treated mice, was quantified as described in (Kakhlon et al, 2018). Repeated‐measures 2‐way ANOVA tests show that the pharmacokinetic profile of each tissue is significantly different from that of all other tissues (P < 0.05). *, Significant difference (P < 0.05) as determined by two‐tailed t‐tests.
144DG11 Pharmacokinetics. Gbeys/ys mice injected with 144DG1 were sacrificed 30, 60, 90, and 210 min postinjection, and the indicated tissues were removed, as well as 200 uL of serum drawn. Graph shows means (± SEM) of 144DG11 levels in the different tissues determined by LC‐MS/MS (see Materials & Methods). Results obtained from n = 3 mice at each time point.

- A–F
Mice were monitored over a 24‐hr period. Effective mass was calculated by ANCOVA (see Materials & Methods). Data are mean±SEM from nine‐month‐old mice (n = 11, wt vehicle‐treated, n = 6 Gbeys/ys vehicle‐treated, and n = 7 Gbeys/ys 144DG11‐treated). Vehicle‐treated Gbeys/ys mice demonstrate lower respiratory quotient (in the light) (A), total energy expenditure (TEE) (B), and fat oxidation (C) compared to wt controls. 144DG11 treatment increased these parameters (for fat oxidation only in the dark and total time). Carbohydrate oxidation and ambulatory activity, not significantly affected by the diseased state, were increased by 144DG11 even beyond wt control levels (D and E) (note, while 144DG11 increased carbohydrate oxidation in the light (D), P was only < 0.06). 144DG11 also reversed the decrease in meal size and water sip volume observed in Gbeys/ys mice as compared to wt control (F).
- G
Blood metabolic panel based on n = 3, 9.5‐month‐old mice treated as indicated. Blood glucose was increased and blood triglycerides decreased in Gbeys/ys cells by 144DG11 (P < 0.05).

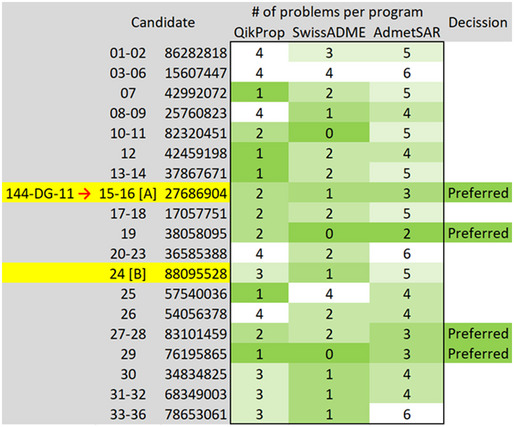
PAS staining for total glycogen in skin fibroblasts from different APBD patients. Staining fluorescence was quantified by InCell2200 (see Methods). Means (± SEM) are statistically different from each other (P < 0.0001, one‐way ANOVA). n = 3 technical replicates from each patient indicated at the x‐axis were used.
PAS staining for total glycogen in APBD87 fibroblasts glucose starved for 48 h (left), or glucose starved and then replenished for the last 24 h to induce glycogen burden (right). Image acquisition performed by Nikon Eclipse Ti2 microscope using a 40x PlanFluor objective and CY3 filter. Scale bar, 100 µm.
Image‐based multiparametric phenotyping (see Matrials & Methods) of APBD fibroblasts under 48 h glucose starvation (blue), or starvation and glucose replenishment as in (B) (red). Black line, level of significance P = 0.01. Green boxes indicate parameters whose extent of change was increased by glucose supplementation after starvation.
Glycolytic (red) and mitochondrial (blue) ATP production determined by Agilent’s Seahorse machine and real‐time ATP rate assay kit. HC and APBD patient fibroblasts were serum/glucose‐starved for 48 h, and then, full medium was replenished for 24 h without (untreated) or with (chronic) 50 µM 144DG11. Acute, 50 µM 144DG11 was added on assay for 20 min after 24 h of serum/glucose replenishment. Readings were normalized to cell number as determined by crystal violet staining. Shown are mean and SEM values based on n = 3‐6 technical repeats. For all experiments (HC, P < 0.01; APBD1, P < 0.02; APBD2, P < 0.09; APBD3, P < 0.11; one‐way ANOVA with Sidak’s post hoc correction for multiple comparisons), glycolytic ATP production was increased, as compared to untreated control, by acute, but not chronic, supplementation of 144DG11. Mitochondrial ATP production was increased only by acute supplementation of 144DG11 to APBD2 fibroblasts (P < 0.06).

- A
Heteroassembly forms around 144DG11 and not around endogenous molecules as shown by the liquid crystals formed in experiments 1‐3 (see Materials & Methods).
- B
STRING network of targets at the interactome of 144DG11. Targets also show strong protein–protein interactions among themselves, as connectors show (see legend). SLC17A5, Solute Carrier Family 17 Member 5; LAMP1, Lysosomal Associated Membrane Protein 1; LAMTOR4, Late endosomal/lysosomal adaptor, MAPK and MTOR activator 4; GBA, Glucosylceramidase; SCARB2 (aka LIMP2), Scavenger Receptor Class B Member 2; DPP4, Dipeptidyl peptidase‐4; GAA, Lysosomal alpha‐glucosidase; HEXA, Beta‐Hexosaminidase Subunit Alpha.
- C
Cellular thermal shift assay (CETSA) of different targets of the 144DG11heteroassembly (B). Only LAMP1 was significantly protected by 144DG11 from heat‐mediated denaturation (see right shift in its Tm in the lower panel) suggesting its specific interaction with 144DG11. n = 3 biological replicates. Error bars represent S.D.
- D–F
Surface plasmon resonance assays demonstrate dose and pH‐responsive interaction between LAMP1 and 144DG11. Full interaction (but with apparent KD of 6.3mM) was demonstrated only at the lysosomal pH 4.5‐5. (E) Upper panel, LAMP1 was deglycoslated as detailed in Materials & Methods. RNase B is a positive control for a glycosylated protein. Glycosylation status is shown after short (24 h) or long (72 h) dialysis. The results demonstrate a full deglycosylation of both LAMP1 luminal part and RNase B, with unique bands appearing after a long dialysis. Lower panel, surface plasmon resonance, performed as in (D), showing that the luminal domain of deglycosylated LAMP1 specifically binds 144DG11 with apparent KD of 52.5 nM. (F) Three binding modes of 144DG11 (gray) according to LAMP1 grids predicted by SiteMap (green), fPocket (cyan) and FtSite (magenta). Two out of three binding modes (SiteMap and fPocket) are identical. In FtSite part of the molecule went through a rotation relative to the other two. See Materials & Methodss5.
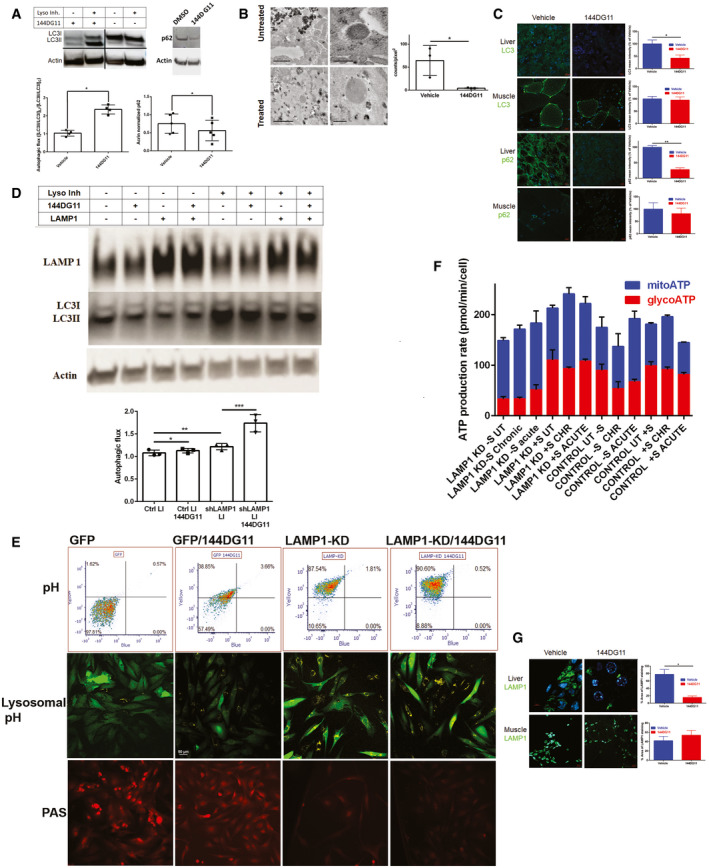
Left panel, Autophagic flux, determined by the extent of lysosomal inhibitor‐dependent increase in the ratio of lipidated to non‐lipidated LC3 (LC3II/LC3I), is increased by 144DG11 (50µM, 24h). Right panel, 144DG11‐mediated increase in autophagic flux, demonstrated by enhanced degradation of the autophagy substrate p62. Shown are representative immunoblots (grouped from different gels) and densitometric quantifications ±s.d. (for LC3II/LC3I, n = 4 biological replicates, *P < 0.0023; for p62, n = 5 biological replicates, *P < 0.0099; two‐tailed t‐test).
Left panel, TEM images of liver tissue from vehicle or 144DG11‐treated Gbeys/ys mice. High‐magnification (right, scale bars=200 nm) and low‐magnification (left, scale bars=1 µm) images show higher levels of glycogen/polyglucosan in lysosomes and cytosol, respectively. Right panel, quantification (± s.d) of lysosomal glycogen particles (n = 3 biological replicates, *P < 0.03, two‐tailed t‐test). G, Glycogen/polyglucosan; L, Lysosomes; M, Mitochondria.
144DG11 reduces LC3 and p62 in mouse liver, but not muscle (n = 3 biological replicates, *P < 0.04 for LC3, **P < 0.0007 for p62; two‐tailed t‐test, SEM). Scale bars, 10 µm.
LAMP1 knockdown increases autophagic flux, which is further facilitated by 144DG11 (see densitometric quantification ±SEM (n = 3 biological replicates, *P < 0.1; **P < 0.05; ***P < 0.01 (two‐tailed t‐tests)). Immunoblots show LAMP1, LC3II/I, and actin in LAMP1 knocked down and control APBD fibroblasts treated or not with 144DG11 and lysosomal inhibitors (LI).
LAMP1‐KD and 144DG11 treatment cause lysosomal acidification. Upper panel, flow cytometry results showing that 144DG11 slightly increased acidification (yellow to blue median fluorescence ratio (Y/B)) in control, GFP‐transduced, APBD fibroblasts (Y/B(GFP/144DG11)>Y/B(GFP), P < 0.12), but significantly acidified LAMP1‐KD, GFP‐shLAMP1‐transduced, APBD fibroblasts (Y/B(LAMP1‐KD/144DG11)>(Y/B(LAMP1‐KD), P < 0.03). LAMP1‐KD itself led to the most significant acidification (Y/B (LAMP1‐KD)>Y/B(GFP), P < 0.007). n = 3, two‐tailed t‐tests. Middle panel Lysosensor staining of the corresponding cells. Yellow fluorescence intensity correlates with acidification. Lower panel, PAS (glycogen) staining of the corresponding cells. Scale bars, 50 µm.
ATP production rates (Fig 4B) ± SEM in serum‐starved (−S) and non‐starved (+S) LAMP1‐KD and GFP (Control) cells, untreated (UT), or treated for 24 h (CHR, chronic) or on assay (acute) with 144DG11. See text (144DG11 enhances LAMP1 knockdown‐induced autolysosomal degradation and catabolism of glycogen, third paragraph) for results of statistical analysis (multiple t‐tests, one‐way ANOVA with Sidak’s post hoc corrections, n = 3 biological replicates).
144DG11 reduces lysosomal (LAMP1 positive) area in liver, but not muscle, of Gbeys/ys mice (n = 3 biological replicates, *P < 0.01, two‐tailed t‐test, SEM).Scale bars, 5 µm for liver (upper left panel), and 10 µm for muscle (lower left panel). Right panel shows quantification of the left panel.

- A, B
Principal component analysis of IBP parameters in HC (black circles) and APBD (red circles) fibroblasts. (B) Morphological characterization of lysosomes based on lysotracker staining of n = 4 HC and n = 4 (biological replicates) APBD patient skin fibroblasts starved for 48 h and treated or not with 50 uM 144DG11 for 24 h. Values are deviations from untreated HC. 144DG11 has reduced lysotracker mean intensity, integrated intensity (DXA), and area in both HC and APBD fibroblasts (***P < 0.0001, one‐way ANOVA with Sidak’s multi‐comparison post hoc test).
- B
Functional (mitochondrial membrane potential (TMRE parameters)) and biomass (mitotracker) characterization of mitochondria in HC and APBD cells treated and analyzed as in (B). Mean (***P < 0.0001) and integrated (***P < 0.0006) TMRE intensities, and mitochondrial biomass (***P < 0.0001), were reduced in APBD v HC. 144DG11 increased TMRE mean (**P < 0.009, ** P < 0.006) and integrated (*P < 0.01, **P < 0.001) intensities in APBD and HC cells, respectively, and mitotracker intensity in APBD cells only (***P < 0.0001). Data represent n = 3 biological replicates. Statistical differences analyzed by one‐way ANOVA with multiple comparisons.
- C
HC and APBD patient cells, starved for 48 h and then treated with 50 uM 144DG11 for 24 h in full medium, were subjected to bioenergetic characterization. 144DG11 treatment significantly increased basal and maximal (following FCCP) oxygen consumption rate (OCR), and coupling efficiency ((OCR drop following Oligomycin)/(Basal OCR)), in both HC and APBD fibroblasts, and ATP production (basal OCR – oligomycin OCR) only in APBD fibroblasts (Fig EV3). A representative experiment (n = 3 biological replicates) based on n = 6 technical replicates.
- D
Volcano plots of the proteins affected by APBD and 144DG11 under starvation or glycogen burden conditions. Analysis is based on cells derived from n = 3 APBD and n = 3 HC subjects.
- E
Venn diagrams of proteins down‐modulated by APBD and up‐modulated by 144DG11 and vice versa under starvation (48) and glycogen burden (48 + 24) conditions.
- F
Gene ontology of proteins up‐modulated (left) and down‐modulated (right) by 144DG11.

Basal respiration in the indicated groups calculated as the mean OCR from the initiation of the experiment until first injection of oligomycin. 144DG11 led to a significant increase in basal respiration in both healthy control (***P < 0.007) and APBD patient (**P < 0.02) cells.
Maximal respiration, defined as the difference between OCR values after FCCP and rotenone/antimycin supplementations, is increased by 144DG11 in both HC (*P < 0.04) and APBD patient (**P < 0.03) cells.
ATP production, defined as the difference in OCR values between basal and post oligomycin levels, is increased by 144DG11 only in APBD patient cells (***P < 0.006).
Spare respiratory capacity, defined as the difference between maximal (post FCCP) OCR and basal OCR values, was slightly (not significantly) increased by 144DG11 in both HC (*P < 0.1) and APBD patient (*P < 0.13) cells.
Coupling efficiency, defined as the quotient (OCR following Oligomycin)/(Basal OCR), was increased by 144DG11 in HC (*P < 0.01) and APBD patient (*P < 0.02) cells.


Predicted binding site for 144DG11 in LAMP1’s N‐terminal domain. Top ranked solution obtained by PATCHDOCK and FireDock servers. 144DG11, represented by black sticks, was docked to the putative binding site. LAMP1 N‐terminal chains are represented in green and cyan.
Schematic of the lysosomal membrane (LM), LAMP1, LAMP2, and the potential inhibitor 144DG11, a possible ancillary membrane protein mediating LAMP1 interaction.
Comment in
-
Amylopectinosis of the fatal epilepsy Lafora disease resists autophagic glycogen catabolism.EMBO Mol Med. 2024 May;16(5):1047-1050. doi: 10.1038/s44321-024-00063-9. Epub 2024 Apr 2. EMBO Mol Med. 2024. PMID: 38565807 Free PMC article.
References
-
- Akman HO, Lossos A, Kakhlon O (2009) [updated 2020 Sep 17] GBE1 adult polyglucosan body disease. In GeneReviews, Adam MP, Ardinger HH, Pagon RA, Wallace SE, Bean LJH, Stephens K, Amemiya A (eds). Seattle, WA: University of Washington, Seattle; 1993–2020. https://www.ncbi.nlm.nih.gov/books/NBK5300/
-
- Beyrath J, Pellegrini M, Renkema H, Houben L, Pecheritsyna S, van Zandvoort P, van den Broek P, Bekel A, Eftekhari P, Smeitink JAM (2018) Kh176 safeguards mitochondrial diseased cells from redox stress‐induced cell death by interacting with the thioredoxin system/peroxiredoxin enzyme machinery. Sci Rep 8: 6577 - PMC - PubMed
Publication types
MeSH terms
Substances
LinkOut - more resources
Full Text Sources
Medical
Research Materials
Miscellaneous
