. 2021 Nov;142(5):899-915.
doi: 10.1007/s00401-021-02366-4. Epub 2021 Sep 6.

Complement component 3 from astrocytes mediates retinal ganglion cell loss during neuroinflammation

Affiliations

Complement component 3 from astrocytes mediates retinal ganglion cell loss during neuroinflammation

Marjan Gharagozloo et al. Acta Neuropathol. 2021 Nov.

Abstract

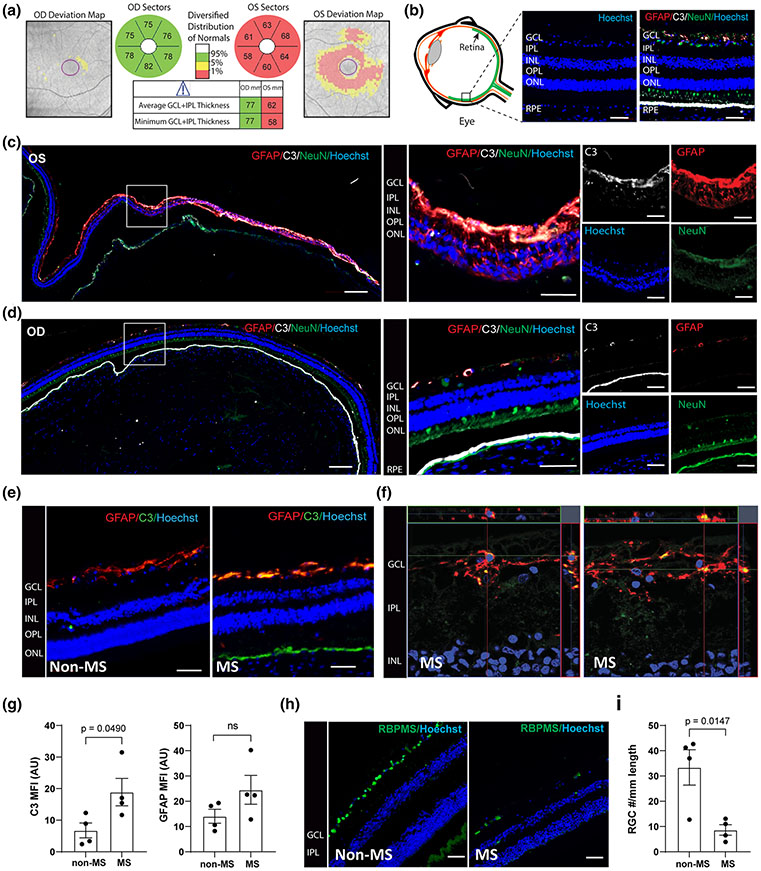
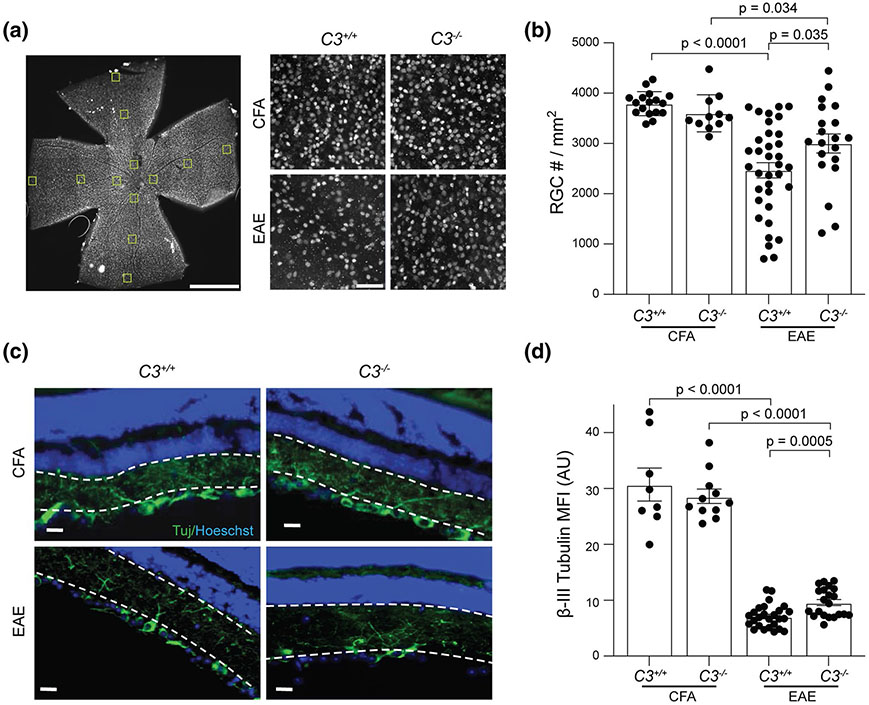
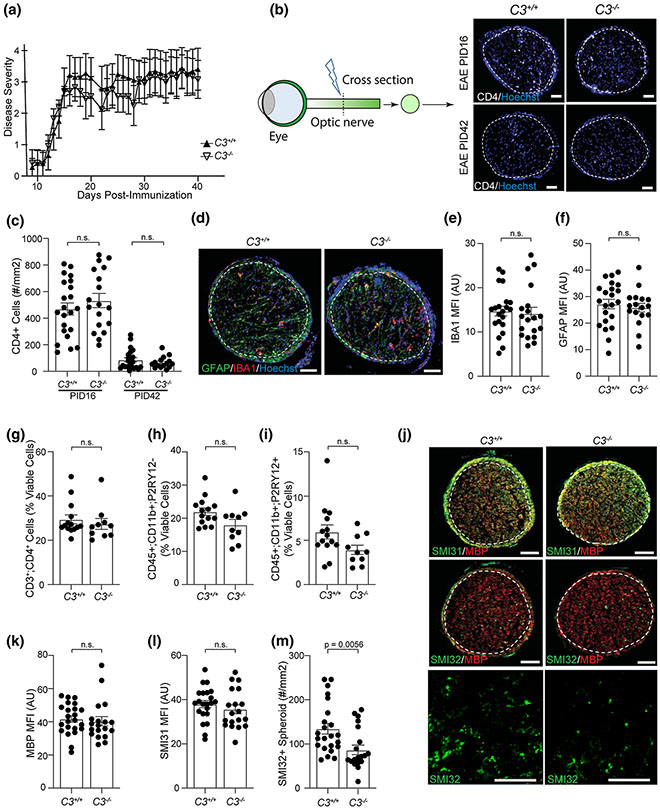
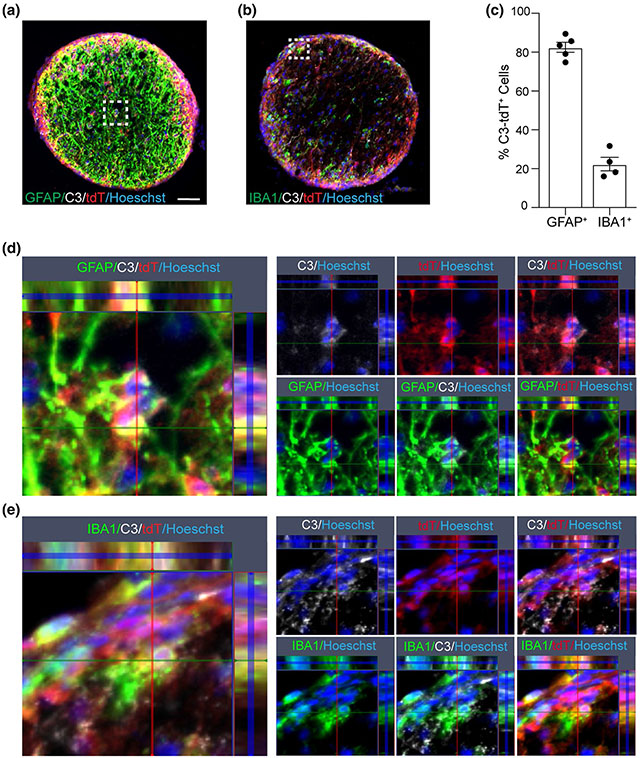
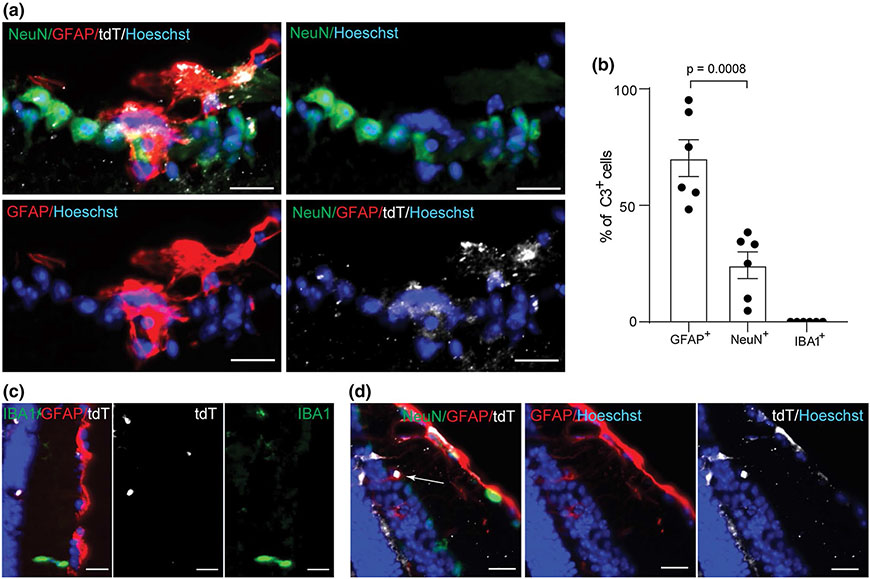
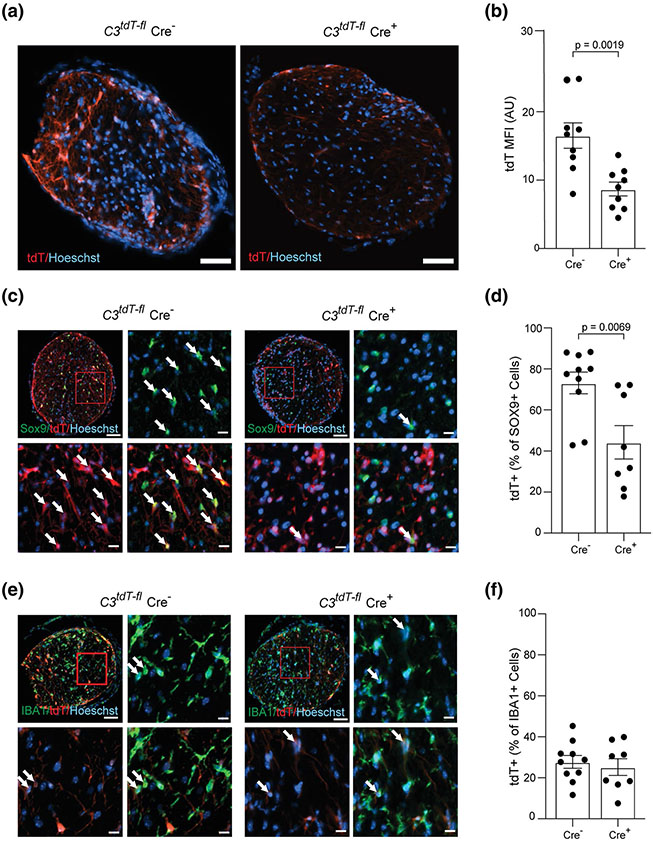
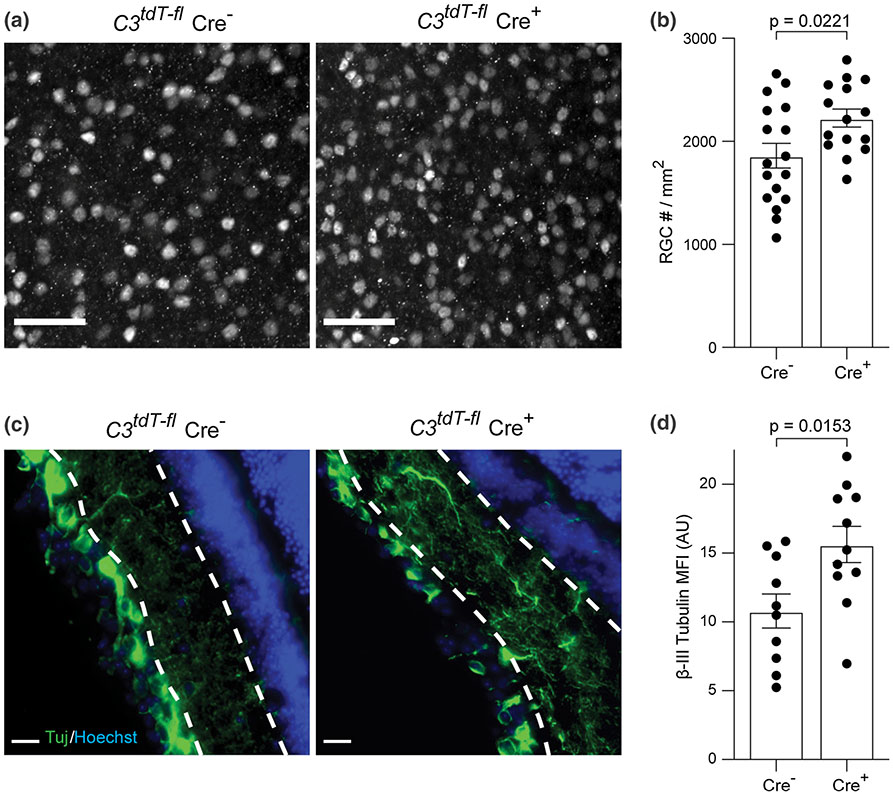
Multiple sclerosis (MS) is an inflammatory demyelinating disease of the central nervous system (CNS) characterized by varying degrees of secondary neurodegeneration. Retinal ganglion cells (RGC) are lost in MS in association with optic neuritis but the mechanisms of neuronal injury remain unclear. Complement component C3 has been implicated in retinal and cerebral synaptic pathology that may precede neurodegeneration. Herein, we examined post-mortem MS retinas, and then used a mouse model, experimental autoimmune encephalomyelitis (EAE), to examine the role of C3 in the pathogenesis of RGC loss associated with optic neuritis. First, we show extensive C3 expression in astrocytes (C3+/GFAP+ cells) and significant RGC loss (RBPMS+ cells) in post-mortem retinas from people with MS compared to retinas from non-MS individuals. A patient with progressive MS with a remote history of optic neuritis showed marked reactive astrogliosis with C3 expression in the inner retina extending into deeper layers in the affected eye more than the unaffected eye. To study whether C3 mediates retinal degeneration, we utilized global C3-/- EAE mice and found that they had less RGC loss and partially preserved neurites in the retina compared with C3+/+ EAE mice. C3-/- EAE mice had fewer axonal swellings in the optic nerve, reflecting reduced axonal injury, but had no changes in demyelination or T cell infiltration into the CNS. Using a C3-tdTomato reporter mouse line, we show definitive evidence of C3 expression in astrocytes in the retina and optic nerves of EAE mice. Conditional deletion of C3 in astrocytes showed RGC protection replicating the effects seen in the global knockouts. These data implicate astrocyte C3 expression as a critical mediator of retinal neuronal pathology in EAE and MS, and are consistent with recent studies showing C3 gene variants are associated with faster rates of retinal neurodegeneration in human disease.

Keywords: Astrocyte; Complement component 3; EAE; Multiple sclerosis; Optic nerve; Retina.


Conflict of interest statement

Conflict of interest The authors declare no competing financial interests.

Figures

Fig. 1
Fig. 1
MS retinas exhibit enhanced regional C3 expression and astrogliosis. a Retinal optical coherence tomography (OCT) scans from a 60-year-old woman with progressive MS and optic neuropathy, showing marked thinning of the ganglion cell layer in the left eye (OS) but not in the right eye (OD). Red indicates thickness value is less than 1st percentile for age matched controls. b Schematic diagram of retinal cross-section and immunofluorescence staining of individual retinal layers. GCL ganglion cell layer, INL inner nuclear layer, IPL inner plexiform layer, OPL outer plexiform layer, ONL outer nuclear layer, RPE Retinal pigment epithelium. c Representative immunofluorescence images of paraffin-embedded retinal cross-sections from the left eye (OS) of the patient presented in panel A. Magnification 20x; Scale bar = 200 μm. Enlarged images of the boxed region are shown to the right; Scale bar = 50 μm. d Representative immunofluorescence images of paraffin-embedded retinal cross-sections from the right eye (OD) of the patient presented in panel A. Magnification 20x; Scale bar = 200 μm. Enlarged images of the boxed region are shown to the right. Scale bar = 50 μm. e Representative images of non-MS and additional MS retina stained with GFAP and C3; Scale bar = 50 μm. f Confocal image of human MS retina stained with GFAP and C3, showing colocalization of C3 and GFAP staining; Scale bar = 10 μm. g Quantification of C3 and GFAP expression in the GCL from MS and non-MS retinas, presented as mean fluorescent intensity (MFI). AU arbitrary unit. (h) Representative images of RBPMS+ cells in retinal cross sections from 2 non-MS and 2 MS individuals; Scale bar = 50 μm. i Quantitation of the number of RBPMS+ cells/ mm length of retina from MS (n = 4) vs non-MS (n = 4) cases. The average length of retinas quantified for RBPMS + cells were 27.82 ± 6.47 mm for non-MS and 23.33 ± 2.13 mm for MS cases. The number of RBPMS+ cells for the retinas shown in panel c–d: OS#4, OD#18, average #11 presented in the plot as one of the MS cases. Significance between groups was assessed by unpaired t-test. Error bars represent SEM.
Fig. 2
Fig. 2
C3−/− EAE mice have less RGC loss and partially preserved neurite projections in the inner retina. a Representative images of Brn3a staining in flat-mount whole retina; Scale bar = 1 mm, 20X magnification. Brn3a+ RGC are shown from a central segment in whole mount retina from CFA and EAE groups at PID42. Images were acquired with 20 × magnification; Scale bar = 50 μm. b Quantification of Brn3a+ RGC in whole mount retina from different groups at PID42. Each dot represents a mouse RGC count, which was derived from an average of 12 segments as shown in panel A. c Representative images of Tuj staining in the retina of CFA and EAE mice. Dotted white lines indicate IPL ROI quantified in d. Images were acquired with 40 × magnification; Scale bar = 20 μm. d Quantification of IPL Tuj staining in CFA and EAE mice, presented as Mean Fluorescent Intensity (MFI). AU arbitrary unit. Significance between groups was assessed by unpaired t-test. Error bars represent SEM
Fig. 3
Fig. 3
C3 deletion does not affect EAE behavioral score, effector T cell infiltration into the optic nerve, or demyelination but reduces axonal swellings. a Behavior score of EAE mice over time from one representative experiment (C3+/+ EAE, n = 8; C3−/− EAE, n = 6). The experiment was replicated 5 times (across all 5 replicate experiments, C3+/+ EAE, n = 108; C3−/− EAE, n = 91). b Representative images of CD4+ T-cell staining in the cross sections of optic nerve from EAE mice, 20 × magnification; Scale bar = 50 μm. c Quantification of CD4+ T-cells in the optic nerves of EAE mice at PID16 and PID42. d Representative images of GFAP and IBA1 staining in optic nerves of EAE mice at PID16, 20 × magnification, Scale bar = 50 μm. e–f Quantification of IBA1 e and GFAP f staining in optic nerves of EAE mice at PID16, presented as MFI. AU arbitrary unit. g–i The percentage of CD3+CD4+ T cells g, infiltrating myeloid cells (CD11b + ;P2RY12−) h, and microglia (CD11b + ;P2RY12 +) i in the brain of EAE mice at PID16, quantified by flow cytometry in the population of viable cells. j Representative images of SMI31/MBP and SMI32/MBP staining in the optic nerve of EAE mice at PID16. The last row shows the magnified images of SMI32; Scale bar = 50 μm. k–l Quantification of MBP and SMI31 staining in the optic nerve of EAE mice at PID16, presented as MFI. m The counts of SMI32+ spheroids in the optic nerve of EAE mice at PID16. Significance between groups was assessed by unpaired t-test. Error bars represent SEM. In all quantifications, each dot represents a unique mouse
Fig. 4
Fig. 4
Astrocytes are the major C3 expressing cell in the optic nerve of EAE mice at PID16. a GFAP and C3 staining of optic nerves from EAE mice expressing tdTomato under the control of C3 promoter (C3 reporter mice); Scale bar = 50 μm. b IBA1 and C3 staining in the optic nerve of C3 reporter mice with EAE. c Quantification of GFAP+/tdTomato+ cells or IBA1+/tdTomato+ cells in the optic nerve of C3 reporter mice with EAE at PID16. d Enlarged figure for the box area in panel a. e Enlarged figure for the box area in panel b
Fig. 5
Fig. 5
C3-tdTomato cells are predominantly astrocytes in the retina. a tdTomato+/GFAP+ cells and tdTomato+/NeuN+ cells in cross sectioned retina of a tdTomato reporter mouse with EAE at PID16; Scale bar = 20 μm. b Quantification of tdTomato+/GFAP+ cells, tdTomato+/NeuN+ cells, and tdTomato/IBA1+ cells in the cross sections of retina from tdTomato reporter mice at PID16. Each dot represents one mouse. c Representative image of a cross sectioned retina showing tdTomato+GFAP+ cell while IBA1+ cells are negative for tdTomato; Scale bar = 20 μm. d tdTomato expression in Müller glia in the inner nuclear layer (INL) shown by a white arrow; Scale bar = 20 μm
Fig. 6
Fig. 6
GFAP-Cre expression specifically deletes C3 from astrocytes in EAE PID16 optic nerves. a Representative images of tdTomato expression in the optic nerve of C3tdT–fl x GFAP-Cre mice at EAE PID16; Scale bar = 50 μm. b Quantification of tdTomato expression in the optic nerve of C3tdT–fl x GFAP-Cre mice at EAE PID16, presented as MFI; AU, arbitrary unit. c Representative images of tdTomato expression in SOX9+ astrocytes in the optic nerve of C3tdT-–fl x GFAP-Cre at EAE PID16. d The percentage of tdTomato+ SOX9+ astrocytes in the optic nerve of C3tdT–fl x GFAP-Cre mice at EAE PID16, quantified by IHC. e Representative images of tdTomato expression in IBA1 + cells in the optic nerve of C3tdT–fl x GFAP-Cre mice at EAE PID16; Scale bar = 20 μm. f The percentage of tdTomato+/IBA1+ cells in the optic nerve of C3tdT–fl x GFAP-Cre mice at EAE PID16, quantified by IHC. Significance between groups was assessed by unpaired t-test. Error bars represent SEM
Fig. 7
Fig. 7
C3 depletion from astrocytes protects RGC and neurite projections in the retina. a Representative images of Brn3a staining in flat-mount whole retina from C3tdT–fl x GFAP-Cre mice at EAE PID42. Magnification 20x; Scale bar = 50 μm. b. Quantification of Brn3a + RGC number from different groups at PID42. c Representative images of Tuj staining in the retina of C3tdT–fl x GFAP-Cre mice at EAE PID42. Magnification 40x; Scale bar = 20 μm. d Quantification of Tuj staining in C3tdT–fl x GFAP-Cre mice with EAE, presented as MFI. Error bars represent SEM. AU arbitrary unit

References

    1. Antel JP, Becher B, Ludwin SK, Prat A, Quintana FJ (2020) Glial cells as regulators of neuroimmune interactions in the central nervous system. J Immunol 204:251–255. 10.4049/jimmunol.1900908 - DOI - PubMed
    1. Barbar L, Jain T, Zimmer M, Kruglikov I, Sadick JS, Wang M, et al. (2020) CD49f Is a novel marker of functional and reactive human iPSC-derived astrocytes. Neuron 10.1016/j.neuron.2020.05.014 - DOI - PMC - PubMed
    1. Bebo BF Jr, Dehghani B, Foster S, Kurniawan A, Lopez FJ, Sherman LS (2009) Treatment with selective estrogen receptor modulators regulates myelin specific T-cells and suppresses experimental autoimmune encephalomyelitis. Glia 57:777–790. 10.1002/glia.20805 - DOI - PMC - PubMed
    1. Brambilla R (2019) The contribution of astrocytes to the neuroinflammatory response in multiple sclerosis and experimental autoimmune encephalomyelitis. Acta Neuropathol 137:757–783. 10.1007/s00401-019-01980-7 - DOI - PMC - PubMed
    1. Calida DM, Constantinescu C, Purev E, Zhang GX, Ventura ES, Lavi E et al. (2001) Cutting edge: C3, a key component of complement activation, is not required for the development of myelin oligodendrocyte glycoprotein peptide-induced experimental autoimmune encephalomyelitis in mice. J Immunol 166:723–726 - PubMed

Publication types

MeSH terms