

Cardiopulmonary exercise testing in patients with moderate-severe obesity: a clinical evaluation tool for OSA?
- PMID: 34487305
- PMCID: PMC9418285
- DOI: 10.1007/s11325-021-02475-0
Cardiopulmonary exercise testing in patients with moderate-severe obesity: a clinical evaluation tool for OSA?
Abstract
Purpose: Obstructive sleep apnea (OSA) is a widespread comorbidity of obesity. Nasal continuous positive airway pressure (CPAP) has been demonstrated very effective in treating patients with OSA. The aims of this study were to investigate whether or not cardiopulmonary exercise testing (CPET) can characterize patients with OSA and to evaluate the effect of nasal CPAP therapy.
Methods: An observational study was conducted on patients with moderate to severe obesity and suspected OSA. All patients underwent cardiorespiratory sleep study, spirometry, and functional evaluation with ECG-monitored, incremental, maximal CPET.
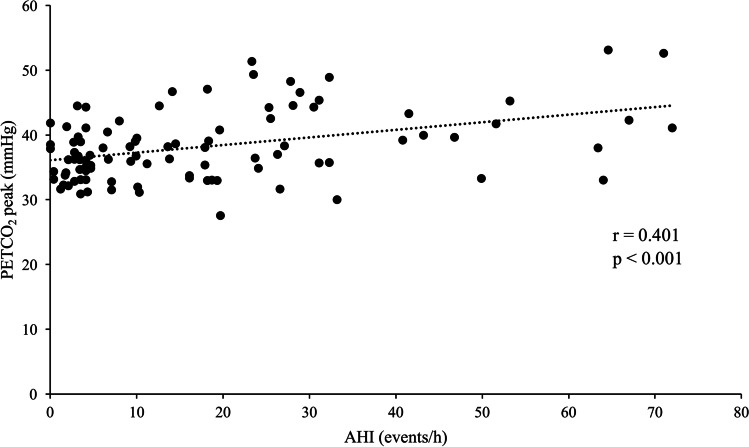
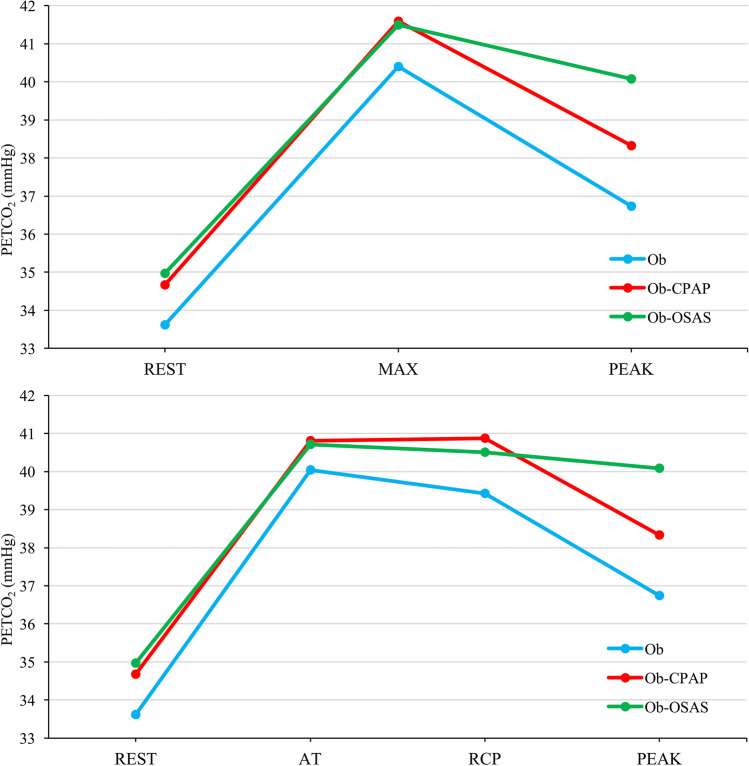
Results: Of the 147 patients, 94 presented with an apnea-hypopnea index (AHI) ≥ 15 events/h and were thus considered to have OSA (52 receiving nasal CPAP treatment; 42 untreated) while 53 formed a control group (AHI < 15 events/h). Patients with untreated OSA showed significantly lower oxygen uptake (VO2), heart rate, minute ventilation (VE), and end tidal carbon dioxide (PETCO2) at peak exercise compared to controls. Patients receiving nasal CPAP showed higher VE and VO2 at peak exercise compared to untreated patients. A difference in PETCO2 between the maximum value reached during test and peak exercise (ΔPETCO2 max-peak) of 1.71 mmHg was identified as a predictor of OSA.
Conclusion: Patients with moderate to severe obesity and untreated OSA presented a distinctive CPET-pattern characterized by lower aerobic and exercise capacity, higher PETCO2 at peak exercise associated with a lower ventilatory response. Nasal CPAP treatment was shown to positively affect these cardiorespiratory adaptations during exercise. ΔPETCO2 max-peak may be used to suggest OSA in patients with obesity.
Keywords: Cardiorespiratory fitness; Cardiorespiratory sleep study; Continuous positive airway pressure; End-tidal carbon dioxide; Obstructive sleep apnea.
© 2021. The Author(s).
Conflict of interest statement
The authors declare no competing interests.
Figures


References
-
- Mendelson M, Marillier M, Bailly S et al (2018) Maximal exercise capacity in patients with obstructive sleep apnoea syndrome: a systematic review and meta-analysis. Eur Respir J 51(6). 10.1183/13993003.02697-2017 - PubMed
Publication types
MeSH terms
LinkOut - more resources
Full Text Sources
