

Meta-analysis for individual participant data with a continuous exposure: A case study
- PMID: 34487835
- PMCID: PMC9263279
- DOI: 10.1016/j.jclinepi.2021.08.033
Meta-analysis for individual participant data with a continuous exposure: A case study
Abstract
Objective: Methods for meta-analysis of studies with individual participant data and continuous exposure variables are well described in the statistical literature but are not widely used in clinical and epidemiological research. The purpose of this case study is to make the methods more accessible.
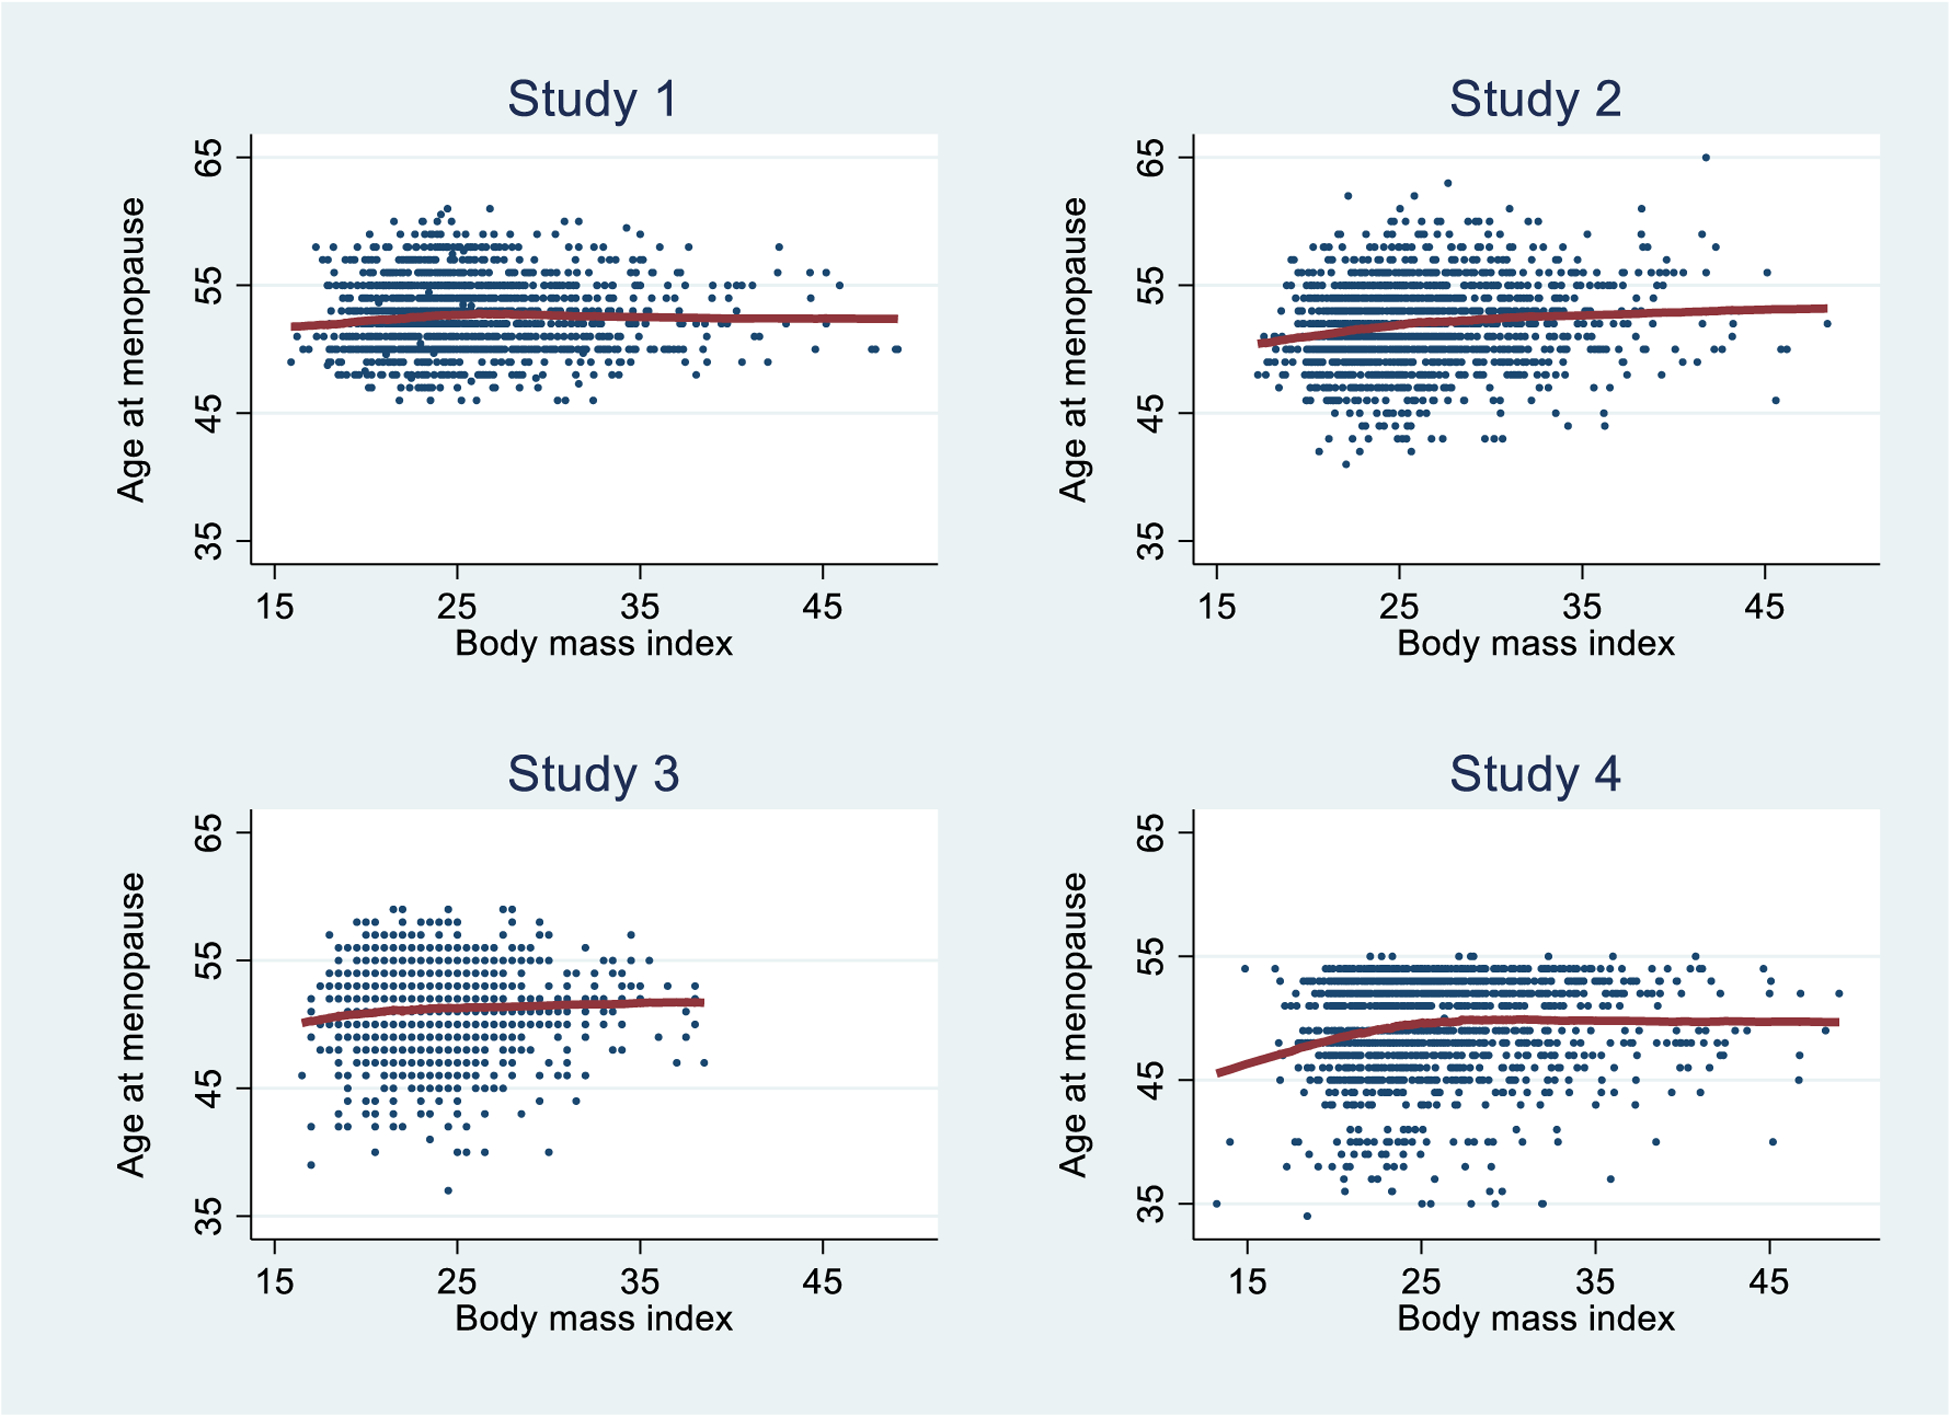
Study design and setting: A two-stage process is demonstrated. Response curves are estimated separately for each study using fractional polynomials. The study-specific curves are then averaged pointwise over all studies at each value of the exposure. The averaging can be implemented using fixed effects or random effects methods.
Results: The methodology is illustrated using samples of real data with continuous outcome and exposure data and several covariates. The sample data set, segments of Stata and R code, and outputs are provided to enable replication of the results.
Conclusion: These methods and tools can be adapted to other situations, including for time-to-event or categorical outcomes, different ways of modelling exposure-outcome curves, and different strategies for covariate adjustment.
Keywords: Continuous variables; Fractional polynomials; Individual participant data; Meta-analysis.
Copyright © 2021 The Authors. Published by Elsevier Inc. All rights reserved.
Conflict of interest statement
Declarations of interest: none.
Figures


References
-
- Greenland S, Longnecker MP. Methods for trend estimation from summarized dose–response data, with applications to meta-analysis. American Journal of Epidemiology 1992; 135: 1301–1309 - PubMed
-
- Liu Q, Cook NR, Bergström A, Hsieh CC. A two-stage hierarchical regression model for meta-analysis of epidemiologic nonlinear dose–response data. Computational Statistics & Data Analysis 2009; 53: 4157–4167,
-
- Rota M, Bellocco R, Scotti L, Tramacere I, Jenab M, Corrao G, La Vecchia C, Boffetta P, Bagnardi V. (2010), Random-effects meta-regression models for studying nonlinear dose–response relationship, with an application to alcohol and esophageal squamous cell carcinoma. Statist. Med 2010; 29: 2679–2687. doi: 10.1002/sim.4041 - DOI - PubMed
-
- Royston P, Altman DG, Sauerbrei W. Dichotomizing continuous predictors in multiple regression: a bad idea Statist. Med 2006; 25:127–141 - PubMed
Publication types
MeSH terms
Grants and funding
- MR/R024227/1/MRC_/Medical Research Council/United Kingdom
- R01 AG062622/AG/NIA NIH HHS/United States
- U01 AG012554/AG/NIA NIH HHS/United States
- RG/16/11/32334/BHF_/British Heart Foundation/United Kingdom
- R01 AG017644/AG/NIA NIH HHS/United States
- U01 AG012505/AG/NIA NIH HHS/United States
- U01 AG012531/AG/NIA NIH HHS/United States
- 001/WHO_/World Health Organization/International
- U01 AG012535/AG/NIA NIH HHS/United States
- U01 AG012553/AG/NIA NIH HHS/United States
- U01 NR004061/NR/NINR NIH HHS/United States
- U01 AG012539/AG/NIA NIH HHS/United States
- U01 AG012546/AG/NIA NIH HHS/United States
- U19 AG063720/AG/NIA NIH HHS/United States
- U01 AG012495/AG/NIA NIH HHS/United States
LinkOut - more resources
Full Text Sources
