Comparative Study
. 2021 Sep 6;16(1):62.
doi: 10.1186/s13024-021-00483-y.

APOΕ4 lowers energy expenditure in females and impairs glucose oxidation by increasing flux through aerobic glycolysis

Affiliations
Comparative Study

APOΕ4 lowers energy expenditure in females and impairs glucose oxidation by increasing flux through aerobic glycolysis

Brandon C Farmer et al. Mol Neurodegener. .

Abstract

Background: Cerebral glucose hypometabolism is consistently observed in individuals with Alzheimer's disease (AD), as well as in young cognitively normal carriers of the Ε4 allele of Apolipoprotein E (APOE), the strongest genetic predictor of late-onset AD. While this clinical feature has been described for over two decades, the mechanism underlying these changes in cerebral glucose metabolism remains a critical knowledge gap in the field.

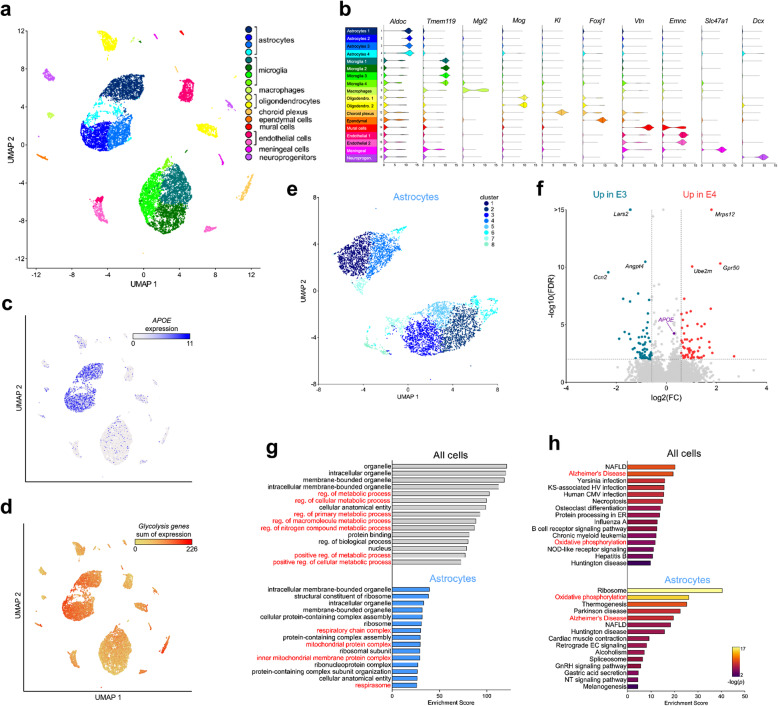
Methods: Here, we undertook a multi-omic approach by combining single-cell RNA sequencing (scRNAseq) and stable isotope resolved metabolomics (SIRM) to define a metabolic rewiring across astrocytes, brain tissue, mice, and human subjects expressing APOE4.

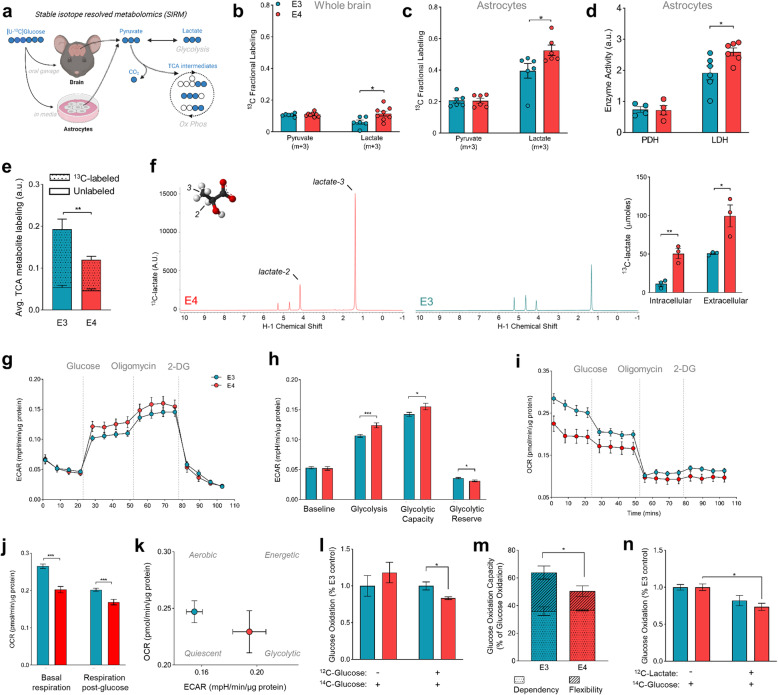
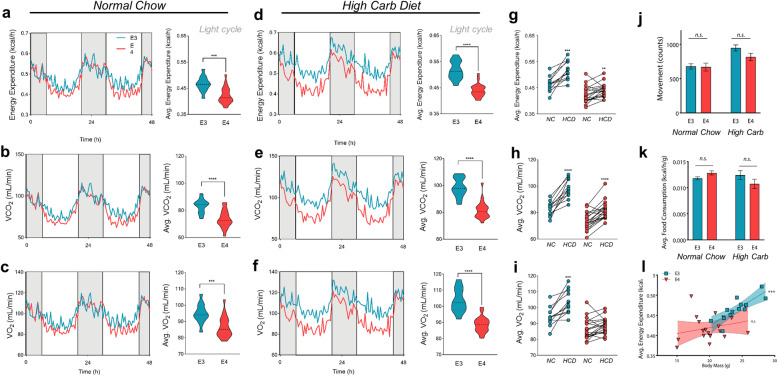
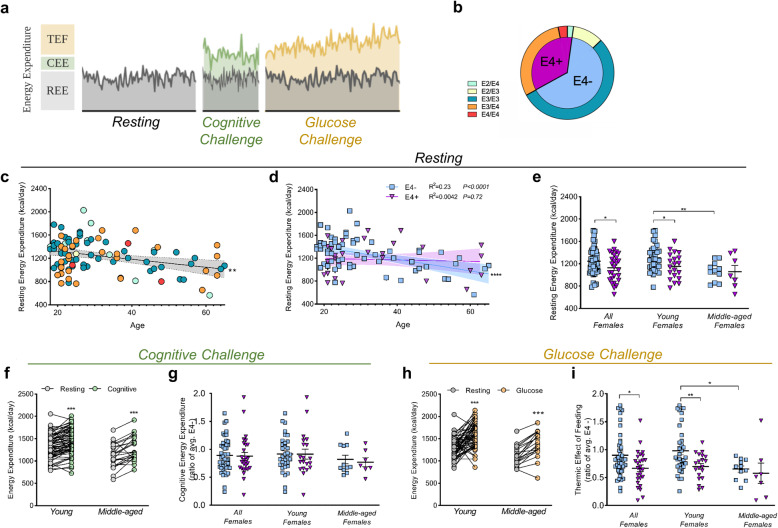
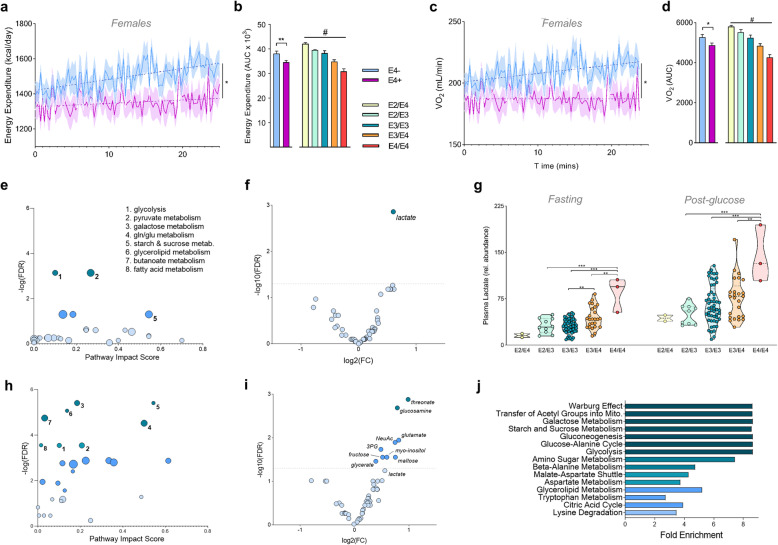
Results: Single-cell analysis of brain tissue from mice expressing human APOE revealed E4-associated decreases in genes related to oxidative phosphorylation, particularly in astrocytes. This shift was confirmed on a metabolic level with isotopic tracing of 13C-glucose in E4 mice and astrocytes, which showed decreased pyruvate entry into the TCA cycle and increased lactate synthesis. Metabolic phenotyping of E4 astrocytes showed elevated glycolytic activity, decreased oxygen consumption, blunted oxidative flexibility, and a lower rate of glucose oxidation in the presence of lactate. Together, these cellular findings suggest an E4-associated increase in aerobic glycolysis (i.e. the Warburg effect). To test whether this phenomenon translated to APOE4 humans, we analyzed the plasma metabolome of young and middle-aged human participants with and without the Ε4 allele, and used indirect calorimetry to measure whole body oxygen consumption and energy expenditure. In line with data from E4-expressing female mice, a subgroup analysis revealed that young female E4 carriers showed a striking decrease in energy expenditure compared to non-carriers. This decrease in energy expenditure was primarily driven by a lower rate of oxygen consumption, and was exaggerated following a dietary glucose challenge. Further, the stunted oxygen consumption was accompanied by markedly increased lactate in the plasma of E4 carriers, and a pathway analysis of the plasma metabolome suggested an increase in aerobic glycolysis.

Conclusions: Together, these results suggest astrocyte, brain and system-level metabolic reprogramming in the presence of APOE4, a 'Warburg like' endophenotype that is observable in young females decades prior to clinically manifest AD.

Keywords: APOE; Aerobic glycolysis; Alzheimer’s disease; Apolipoprotein E; Energy expenditure; Metabolism.


Conflict of interest statement

The authors declare that no competing interests exist.

Figures

Fig. 1
Fig. 1
Single-cell RNA sequencing highlights E4-associated changes in glycolysis and oxidative phosphorylation in astrocytes. Whole brain tissue from E3 and E4 mice was digested and subjected to single-cell RNA sequencing (scRNA-seq). a UMAP visualization of cells from E3 and E4 mouse brains (3 pooled hemi-brains per genotype). Cells are colored by cell type. b Assignment of clusters to specific cell types based on expression of known gene markers (astrocytes, Aldoc; microglia, Tmem119; macrophages, Mgl2; oligodendrocytes, Mog; choroid plexus, Kl; ependymal cells, Foxj1; mural cells, Vtn; Ednothelial cells, Emnc; meningeal, Slc47a1; neuroprogenitor cells, Dcx). c, d Expression of both APOE (c) and glycolysis genes (d) was highest in astrocyte cell populations. Glycolysis gene expression is shown as the sum of the expression of 39 detected genes belonging to the KEGG pathway “glycolysis and gluconeogenesis”. e UMAP visualization of astrocytes (Aldoc+ cells). Cells are colored by cluster. f Volcano plot showing differentially expressed genes in E3 and E4 astrocytes. g, h Gene ontology (g) and pathway enrichment (h) analyses highlights APOE-associated gene expression changes in metabolic pathways, particularly mitochondrial complex and oxidative phosphorylation (highlighted in red). Abbreviations: CMV, cytomegalovirus; EC, endocannabinoid; ER, endoplasmic reticulum; GnRH, Gonadotropin-releasing hormone; HV, herpesvirus; KS, Kaposi sarcoma; NAFLD, non-alcoholic fatty liver disease; NT, Neurotrophin; reg., regulation
Fig. 2
Fig. 2
E4 increases lactate production in mouse brain and E4 astrocytes show increased glycolytic flux and lower oxidative respiration. a Experimental design (13C, blue filled circles; 12C, white circles; (m + n, where n is the number of 13C labeled carbons within a metabolite). [U-13C] glucose was administered in vivo to E3 (n = 6) and E4 (n = 8) mice via oral gavage, brain tissue was collected after 45 min, and metabolites analyzed for 13C enrichment in pyruvate and lactate. E3 and E4 expressing astrocytes were cultured in [U-13C] glucose media for 24 h, media collected, cells washed, and metabolites analyzed for 13C enrichment (n = 6). b While fully labeled pyruvate is present in similar amounts in E3 and E4 brains, lactate synthesized from 13C-glucose is higher in E4 mouse brains. c-e Primary astrocytes expressing E4 show increased 13C enrichment in lactate (c), higher LDH activity (d), and decreased 13C enrichment in the TCA cycle (average of all detected TCA intermediates) (e). f Increased lactate synthesis as measured by HSQCAD NMR spectroscopy (n = 3). Representative NMR spectra (f) showing E4 astrocytes have both increased intracellular 13C-lactate and export more lactate into extracellular media (bar graph insert). g Extracellular acidification rate (ECAR) of E3 and E4 primary astrocytes shown over time during the glycolysis stress test (n = 24 for both groups). h Contributions to ECAR at baseline, in response to glucose (glycolysis), in response to stress (glycolytic capacity), and un-tapped reserve were calculated. i Oxygen consumption rate (OCR) during the glycolysis stress test assay was graphed over time and j represented as average respiration before and after glucose. k Metabolic phenotypes of E3 and E4 astrocytes were characterized by plotting ECAR vs. OCR. l E3 and E4 astrocytes were incubated in glucose free media (−) or glucose rich media (+) and oxidation of 1.0 μCi/mL 14C-glucose was measured by trapping 14CO2 and counting radio activity. (*P < 0.05 unpaired t-test, two-tailed, n = 4 per genotype). m Glucose oxidation capacity, dependency, and flexibility was assessed in E3 and E4 astrocytes via the Mito Fuel Flex Assay. n E3 and E4 astrocytes were incubated in 1.0 μCi/mL 14C-glucose with (+) or without (−) 12.5 mM lactate (n = 3). (b-l,n, *P < 0.05, ***P < 0.001, ****P < 0.0001, unpaired t-test, two tailed) (m, *P < 0.05 Two-way ANOVA, Sidak’s multiple comparisons test)
Fig. 3
Fig. 3
E4 mice have lower energy expenditure and fail to increase oxygen consumption following a high carbohydrate diet. a-f Female E3 and E4 mice were housed individually for 48 h with ad libitum access to normal chow (a-c) or a high carbohydrate diet (HCD) (d-f) and energy expenditure (EE), VCO2 and VO2 were measured. Dark cycles are indicated in grey with light cycles in white. Light cycles were used for calculating averages of EE, VCO2 and VO2 (shown to the right) (***P < 0.0001, ****P < 0.00001, unpaired t-test, two-tailed; E3 n = 13, E4 n = 20). j Activity and k food consumption during light cycles were averaged for E3 and E4 mice (E3 n = 10, E4 n = 14). l Analysis of covariance was performed by separately correlating average EE and body weight for E3 and E4 mice. (Spearman correlation r = 0.86, ***P < 0.001)
Fig. 4
Fig. 4
Female Ε4 carriers show lower resting energy expenditure and lower thermic effect of feeding after a glucose challenge. a Experimental design of study. Individual components of energy expenditure (EE) were assessed in three distinct periods. Resting energy expenditure (REE) was assessed during the resting period. Cognitive energy expenditure (CEE) was assessed during the cognitive challenge and defined as difference in the area under the curve (AUC) of EE during the cognitive challenge and the AUC of EE from the resting period. Thermic effect of feeding (TEF) was assessed during the glucose challenge and calculated as the difference in AUC of EE during the glucose challenge and AUC of REE. b APOE genotypes of subjects represented in the study (E4- n = 61, E4+ n = 33; E2/E4 n = 2, E2/E3 n = 10, E3/E3 n = 51, E3/E4 n = 28, E4/E4 n = 3). c Correlation of average REE with participant age (Pearson correlation R2 = 0.11, **P < 0.01, n = 94). d Correlation of average REE and participant age separated by Ε4 carriers (purple) and non-carriers (blue) (Ε4- R2 = 0.233, ****P < 0.0001; Ε4+ R2 = 0.0042, P = 0.719, E4- n = 61 and E4+ n = 33). Shaded areas refer to 95% confidence intervals. e Average REE for all, young, and middle-age E4- (n = 44, 33, and 11 respectively) and E4+ females (n = 27, 20, and 7 respectively) (*P < 0.05, **P < 0.01, unpaired t-test, two-tailed). f Average EE between resting and cognitive test periods in young (n = 71) and middle-aged (n = 23) participants. (***P < 0.001, paired t-test, two-tailed). g CEE for all female participants and for the two age cohorts. h Average EE between resting and glucose challenge periods in young and middle-aged participants (***P < 0.001, paired t-test, two-tailed). i TEF for all females and for the two age cohorts, further separated by Ε4 carriers and non-carriers. (*P < 0.05, unpaired t-test, two-tailed)
Fig. 5
Fig. 5
Ε4 carriers show lower energy expenditure, decreased oxygen consumption, and pro-glycolytic changes in the plasma metabolome. a, c Energy expenditure (EE) (a) and VO2 (c) of female Ε4 carriers (purple) and Ε4 non-carriers (blue) during the glucose challenge. Values shown are means (lines) +/− SEM (shaded). (E4- n = 44, E4+ n = 27; *P < 0.05, Two-way ANOVA repeated measures) (b, d) Incremental area under the curve (AUC) of EE (b) and VO2 (d) was determined by Ε4 carriage and further by respective APOE genotypes in all participants. (E4- n = 61, E4+ n = 33; E2/E4 n = 2, E2/E3 n = 10, E3/E3 n = 51, E3/E4 n = 28, E4/E4 n = 3) (*P < 0.05, **P < 0.01, unpaired t-test, two-tailed; #P < 0.05 One-way ANOVA). e, h Pathway impact analysis highlights pyruvate metabolism and glycolysis as pathways significantly altered by E4 carriage in human plasma at baseline (e), while multiple carbohydrate and lipid processing pathways are altered by E4 carriage following the glucose drink (h) (FDR < 0.01). f, i Volcano plots showing changes in plasma metabolites. Lactate was the most significantly altered metabolite by APOE genotype at baseline (f), while multiple metabolites differed post-glucose drink (i) (ANOVA, FDR < 0.05). g Lactate values in individual subjects as determined by GC-MS analysis. j Enrichment analysis highlights multiple metabolic pathways as significantly altered by E4 carriage following the glucose drink, including the top hit of ‘Warburg effect’. All comparisons are E4+ (n = 33) vs E4- (n = 61)

References

    1. Belloy ME, Napolioni V, Greicius MD. A quarter century of APOE and Alzheimer's disease: Progress to date and the path forward. Neuron. 2019;101(5):820–838. doi: 10.1016/j.neuron.2019.01.056. - DOI - PMC - PubMed
    1. Liu C-C, Kanekiyo T, Xu H, Bu G. Apolipoprotein E and Alzheimer disease: risk, mechanisms, and therapy. Nat Rev Neurol. 2013;9(2):106–118. doi: 10.1038/nrneurol.2012.263. - DOI - PMC - PubMed
    1. Riedel BC, Thompson PM, Brinton RD. Age, APOE and sex: triad of risk of Alzheimer's disease. J Steroid Biochem Mol Biol. 2016;160:134–147. doi: 10.1016/j.jsbmb.2016.03.012. - DOI - PMC - PubMed
    1. Farrer LA, Cupples LA, Haines JL, Hyman B, Kukull WA, Mayeux R, Myers RH, Pericak-Vance MA, Risch N, van Duijn CM. Effects of age, sex, and ethnicity on the association between apolipoprotein E genotype and Alzheimer disease. A meta-analysis. APOE and Alzheimer disease Meta analysis consortium. Jama. 1997;278(16):1349–1356. doi: 10.1001/jama.1997.03550160069041. - DOI - PubMed
    1. Payami H, Montee KR, Kaye JA, Bird TD, Yu CE, Wijsman EM, Schellenberg GD. Alzheimer’s disease, apolipoprotein E4, and gender. Jama. 1994;271(17):1316–1317. doi: 10.1001/jama.1994.03510410028015. - DOI - PubMed

Publication types

MeSH terms

Associated data