. 2021 Sep 6;22(1):259.
doi: 10.1186/s13059-021-02474-0.

Gramtools enables multiscale variation analysis with genome graphs

Affiliations

Gramtools enables multiscale variation analysis with genome graphs

Brice Letcher et al. Genome Biol. .

Abstract

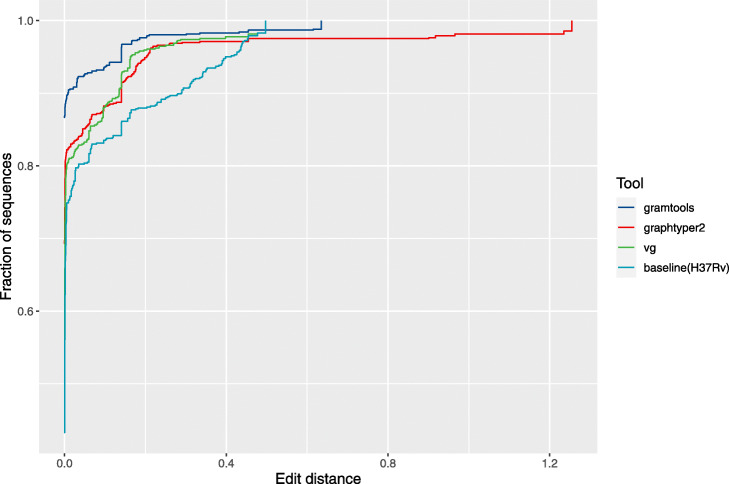
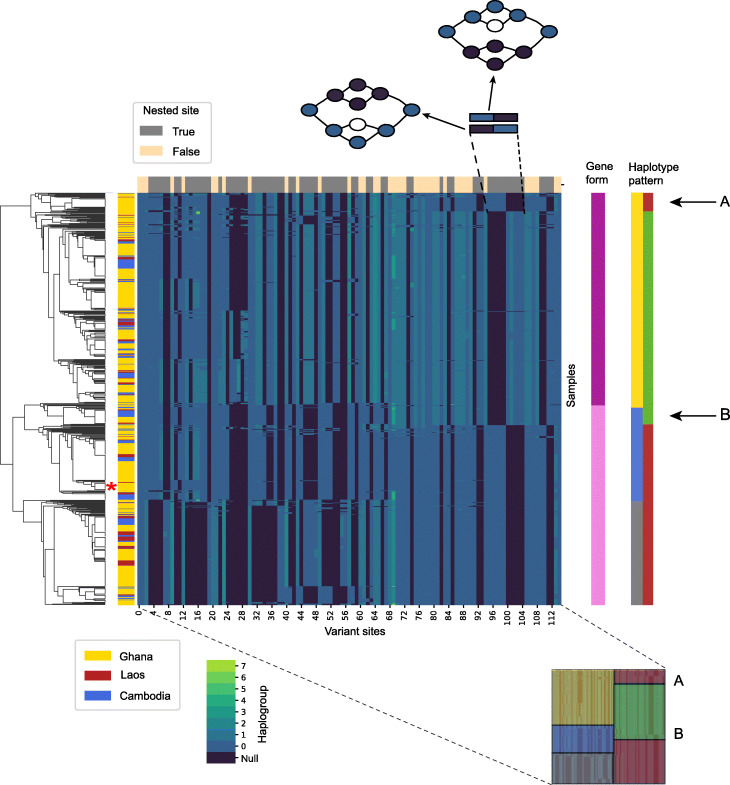
Genome graphs allow very general representations of genetic variation; depending on the model and implementation, variation at different length-scales (single nucleotide polymorphisms (SNPs), structural variants) and on different sequence backgrounds can be incorporated with different levels of transparency. We implement a model which handles this multiscale variation and develop a JSON extension of VCF (jVCF) allowing for variant calls on multiple references, both implemented in our software gramtools. We find gramtools outperforms existing methods for genotyping SNPs overlapping large deletions in M. tuberculosis and is able to genotype on multiple alternate backgrounds in P. falciparum, revealing previously hidden recombination.

Keywords: Genome graph; Mycobacterium tuberculosis; Pangenome; Plasmodium falciparum; VCF; Variant calling.


Conflict of interest statement

The authors declare that they have no competing interests.

Figures

Fig. 1
Fig. 1
Genome graph workflow implemented in gramtools. Black nodes represent genomic sequence or site entry/exit points. Build consists of producing a genome graph that is directed and acyclic, a requirement for gramtools. Genotyping consists of calling alleles at each variant site and thereby inferring a haploid personalised reference genome for a sample. New variants, shown in red, are discovered using standard reference-based callers run against the personalised reference
Fig. 2
Fig. 2
Gramtools requires variation to be expressed as a nested directed, acyclic graph (DAG). A nested DAG represents the genome as a DAG with a single source and sink, which can be decomposed into a succession of subgraphs (or sites). Each site starts with an opening node, and finishes with a closing node, and consists of strictly nested sub-sites. This allows hierarchical genotyping of alternate alleles. Strict nesting means that sub-sites must close off and complete before their parent site and without connecting to different sub-sites (e.g. the dotted pink edges would not be permitted)
Fig. 3
Fig. 3
Example VCF and jVCF calls for a graph containing nested variation. Three sites exist in the graph, and site-opening edges are labelled by haplogroup (0 or 1). Below the graph, parts of VCF and jVCF files describe a genotyped sample (blue path in the graph). In VCF, only one variant site is genotyped, with the “sample” column stating that allele 4 has been called (this corresponds to “ATCCAC”, as the numbering is 0-based). However, the two nested variants—sites 1 and 2—cannot be expressed independently from site 0, as they do not occur on the linear reference (red path in the graph). jVCF stores the same information as VCF in the “Sites” array (one entry per site) and additionally records site relationships using a “Child_Map” entry, which states that sites 1 and 2 occur under site 0 (first key), haplogroup 1 (second key). This places sites 1 and 2 on an alternate reference background (the sequence “ATACTTC”) allowing them to be expressed in the “Sites” entry. Alternate reference sequences are obtained by following haplogroup 0 at each nested variant site (here this spells “ATACTTC”)
Fig. 4
Fig. 4
Nested graphs improve site resolution and coverage differences. A call for part of DBLMSP2 is shown (P. falciparum reference genome Pf3D7 chromosome 10 positions 1433921:1433987). Red nodes mark the called allele and spell the same sequence across nested (a) and non-nested (b) graphs. Numbered nodes mark variant sites and edges are labelled by haplogroup. Blue text under the nodes gives read coverage for the called and next best allele. In the non-nested graph, the next best allele is long and only one SNP away from the best allele so that reads mapping to common sequence add coverage to both. This reduces coverage differences compared to the nested graph. For clarity, only 3 of the 13 alleles that exist in the non-nested graph are shown in b
Fig. 5
Fig. 5
gramtools genotyping compared to reference-based callers at four surface antigens in 14 validation samples. The x-axis is the scaled edit distance (edit distance divided by the length of the gene) to the true sequence (as determined from high-quality PacBio assemblies). The y-axis gives sequence counts across all four genes (AMA1, EBA175, DBLMSP and DBLMSP2) and all 14 evaluated samples. The top left panel shows the distances between the 3D7 sequence and the truth assemblies, while the other panels show the distances for sequences inferred by the evaluated tools. The dotted lines and adjacent numbers show the mean scaled edit distance
Fig. 6
Fig. 6
gramtools joint SNP and deletion genotyping performance compared to other genome graph tools. For each of the 45 deletion regions in each of the 17 validation samples, we made a sequence containing each tool’s calls, giving a total of 765 data points per tool (gramtools, vg, graphtyper). The curves show the cumulative frequency of edit distances between these sequences and truth assemblies. Baseline refers to using the M. tuberculosis H37Rv standard reference sequence only
Fig. 7
Fig. 7
gramtools captures allelic dimorphism and nested variation in P. falciparum gene DBLMSP2. Genotypes of 706 samples from Ghana, Laos and Cambodia spanning the DBL domain of gene DBLMSP2 are represented in a heatmap of variant sites (x-axis) versus samples (y-axis). Each cell in the main square is coloured by haplogroup, which can be considered here as an alternate allele number; a null (darkest blue) haplogroup indicates no call made at a site. The tree on the left shows a hierarchical clustering of alleles. The clade nearest to the reference genome 3D7 is shown with a red asterisk to the right of the tree. The vertical strip to the left of the heatmap shows country of origin of each sample. The vertical strip to the right of the heatmap shows the broad classification of haplotypes into two forms—form 1 (dark pink) and form 2 (light pink), corresponding to the deepest split in the tree and the two known dimorphic forms. Comparing the location of the asterisk shows 3D7 is of form 2. In order to linearise the sites within the graph for display in a heatmap, they are sorted topologically, and a strip across the top of the heatmap shows whether sites are nested. As a clarifying example, the blowout at the top shows how two incompatible nested SNPs on different backgrounds are displayed as either dark-then-light-blue or light-then-dark blue blocks in the heatmap, with the incompatible haplotype shaded darkest blue (null call). This heatmap allows visualisation of haplotype patterns and recombination. We show, bottom right, a blowout with 5 haplotype patterns coloured yellow, blue, grey (all from the left side of the heatmap) and green, red (from the right). Using these classifications, we describe all alleles as combinations of two haplotype patterns, shown in the far-right vertical strip. Form 1 is almost entirely yellow-green, and form two itself has two subforms—blue-red and grey-red. We highlight two recombinant haplotype patterns labelled A (yellow-red) and B (blue-green). Both A and B exist in all 3 countries
Fig. 8
Fig. 8
gramtools mapping and coverage recording. a Variant-aware Burrows Wheeler Transform (vBWT). Each row of the text matrix encodes one position in a linear representation of the graph. BWT: stores the character in the previous position; SA: suffix array, stores the position in the text; suffix: stores the text from SA position to the end. Two markers are used for every variant site in the genome graph: odd markers mark site entry and even markers allow alleles to sort and be queried together. Black intervals mark regular BWT backward searching, with each match to the currently mapped base shown in green. Arrows from red intervals mark vBWT-specific jumps in and out of sites, making the search branch. The read being mapped is shown in dashed orange. b Square brackets under allele nodes show per-base coverage storage. Another array shown below stores allele-level coverage at each site. Mapped reads increment equivalence class counts representing compatibility: in this example, the read is compatible with both alleles 0 and 1 at site 5 and only with allele 1 at site 7. Both kinds of coverage are used in genotyping
Fig. 9
Fig. 9
Nested genotyping procedure. Nodes with numbers mark the start and end of variant sites. In each panel, blue-filled nodes mark which site is being processed, red-filled nodes mark called alleles, and red paths mark alleles considered for genotyping. Ref is the reference allele, Alts are the alleles considered for genotyping, and GT is the called genotype. The example shows haploid genotyping. a Genotyping of child site 2. Allele “G” gets called. b Genotyping of child site 3. Allele “CC” gets called. c Genotyping of parent site 1. Alts are generated from the alleles called in child sites 2 and 3: allele “G” is used from site 2, and allele “CC” is used from site 3, producing alleles “AGT” and “CC”. Allele “AGT” gets called, going through site 2. d In c, the path going through site 2 was called. Because genotyping is haploid, the call at site 3 is invalidated (GT becomes “null”)

References

    1. Brandt DYC, Aguiar VRC, Bitarello BD, Nunes K, Goudet J, Meyer D. Mapping bias overestimates reference allele frequencies at the HLA genes in the 1000 genomes project phase I data. G3: Genes Genomes Genetics (Bethesda, Md.) 2015;5(5):931–41. doi: 10.1534/g3.114.015784. - DOI - PMC - PubMed
    1. Schneeberger K, Hagmann J, Ossowski S, Warthmann N, Gesing S, Kohlbacher O, Weigel D. Simultaneous alignment of short reads against multiple genomes. Genome Biol. 2009;10(9):98. doi: 10.1186/gb-2009-10-9-r98. - DOI - PMC - PubMed
    1. Dilthey A, Cox C, Iqbal Z, Nelson MR, McVean G. Improved genome inference in the MHC using a population reference graph. Nat Genet. 2015;47(6):682–8. doi: 10.1038/ng.3257. - DOI - PMC - PubMed
    1. Garrison E, Sirén J, Novak AM, Hickey G, Eizenga JM, Dawson ET, Jones W, Garg S, Markello C, Lin MF, Paten B, Durbin R. Variation graph toolkit improves read mapping by representing genetic variation in the reference. Nat Biotechnol. 2018;36(9):875–9. doi: 10.1038/nbt.4227. - DOI - PMC - PubMed
    1. Iqbal Z, Caccamo M, Turner I, Flicek P, McVean G. De novo assembly and genotyping of variants using colored de Bruijn graphs. Nat Genet. 2012;44(2):226–32. doi: 10.1038/ng.1028. - DOI - PMC - PubMed

Publication types

Substances

LinkOut - more resources