. 2021 Sep;9(9):e002787.
doi: 10.1136/jitc-2021-002787.

GDF15 induces immunosuppression via CD48 on regulatory T cells in hepatocellular carcinoma

Affiliations

GDF15 induces immunosuppression via CD48 on regulatory T cells in hepatocellular carcinoma

Zhaowei Wang et al. J Immunother Cancer. 2021 Sep.

Abstract

Background: A better understanding of the molecular mechanisms that manifest in the immunosuppressive tumor microenvironment (TME) is crucial for developing more efficacious immunotherapies for hepatocellular carcinoma (HCC), which has a poor response to current immunotherapies. Regulatory T (Treg) cells are key mediators of HCC-associated immunosuppression. We investigated the selective mechanism exploited by HCC that lead to Treg cells expansion and to find more efficacious immunotherapies.

Methods: We used matched tumor tissues and blood samples from 150 patients with HCC to identify key factors of Treg cells expansion. We used mass cytometry (CyTOF) and orthotopic cancer mouse models to analyze overall immunological changes after growth differentiation factor 15 (GDF15) gene ablation in HCC. We used flow cytometry, coimmunoprecipitation, RNA sequencing, mass spectrum, chromatin immunoprecipitation and Gdf15-/-, OT-I and GFP transgenic mice to demonstrate the effects of GDF15 on Treg cells and related molecular mechanism. We used hybridoma technology to generate monoclonal antibody to block GDF15 and evaluate its effects on HCC-associated immunosuppression.

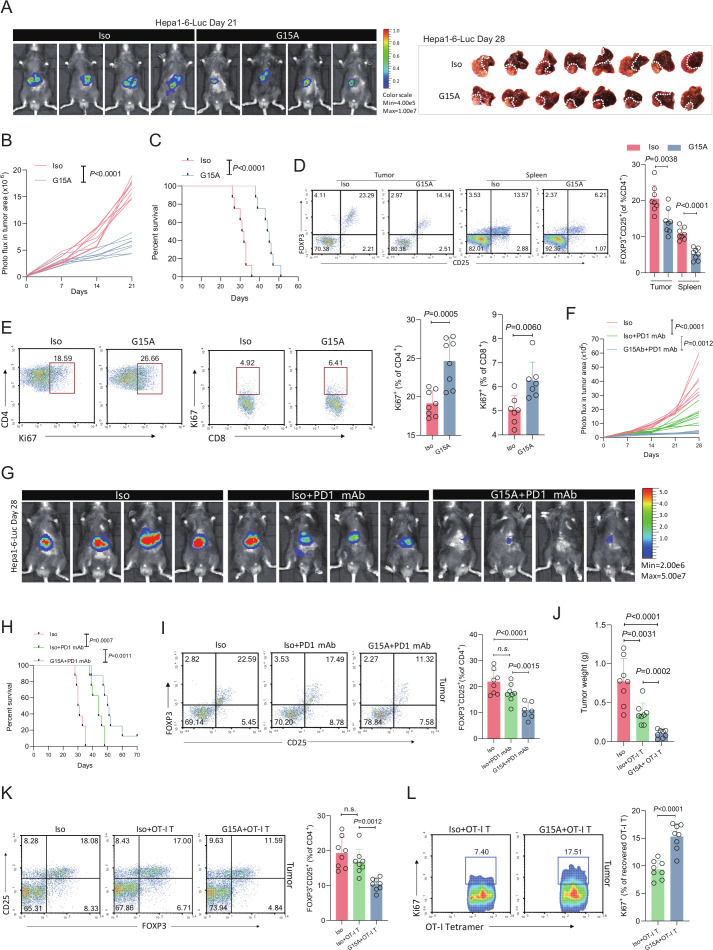
Results: GDF15 is positively associated with the elevation of Treg cell frequencies in patients wih HCC. Gene ablation of GDF15 in HCC can convert an immunosuppressive TME to an inflammatory state. GDF15 promotes the generation of peripherally derived inducible Treg (iTreg) cells and enhances the suppressive function of natural Treg (nTreg) cells by interacting with a previously unrecognized receptor CD48 on T cells and thus downregulates STUB1, an E3 ligase that mediates forkhead box P3 (FOXP3) protein degradation. GDF15 neutralizing antibody effectively eradicates HCC and augments the antitumor immunity in mouse.

Conclusions: Our results reveal the generation and function enhancement of Treg cells induced by GDF15 is a new mechanism for HCC-related immunosuppression. CD48 is the first discovered receptor of GDF15 in the immune system which provide the possibility to solve the molecular mechanism of the immunomodulatory function of GDF15. The therapeutic GDF15 blockade achieves HCC clearance without obvious adverse events.

Keywords: biomarkers; immune tolerance; immunotherapy; tumor; tumor escape; tumor microenvironment.


Conflict of interest statement

Competing interests: None declared.

Figures

Figure 1
Figure 1
Identification of growth differentiation factor 15 (GDF15) as a modulator of regulatory T (Treg) cells in hepatocellular carcinoma (HCC). (A) Treg cell frequencies among CD4+ T cells in 60 HCC tissues, 48 normal liver tissues and 5 blood samples from volunteers. HCC tissues with a relatively high (red, Treg_hi) and low (blue, Treg_lo) Treg cell frequency were selected for RNA sequencing (RNA-seq) (n=8 per group). (B, C) Treg cell frequency among CD4+ T cells in draining lymph nodes and peripheral blood of the 16 patients whose tissues were submitted for RNA-seq. (D) Heatmap of differentially expressed genes (fold change >2). (E–G) A 90 HCC patient cohort was classified into two groups by the mean Treg cell frequency among CD4+ tumor-infiltrating lymphocytes (TILs) (17.04%, n=38 vs n=52) (E). GDF15 expression in TME was measured by ELISA (F) and quantitative immunofluorescence (GDF15 (purple), CD4 (red) and FOXP3 (green) and DAPI (blue)) (G). (H–J) The correlations between GDF15 concentrations and the frequencies of Treg cells in TME (H), draining lymph nodes (I) and peripheral blood (J). (K) Messenger RNA (mRNA) expression levels of GDF15 in HCC versus corresponding normal tissues, as determined by meta-analysis of the The Cancer Genome Atlas (TCGA) database (n= 367 vs 149 samples of tumor vs normal tissues, respectively). (L) Kaplan-Meier survival curves for patients wih HCC with low and high GDF15 expression as determined by meta-analysis of the database. The cut-off value is the average GDF15 mRNA expression level (low GDF15 cohort, n=246; high GDF15 cohort, n=121). The 95% CIs are shown by dotted lines. TCGA data analysis is finished using GEPIA (gepia.cancer-pku.cn) online tool. (M, N) Heatmap for CD4 and CD25 expression of 367 patients in TCGA HCC cohort. Two clusters (1 and 2) were found by unsupervised hierarchical clustering with a correlation matrix on the basis of CD4 and CD25 expression levels (M). Relative GDF15 mRNA levels after normalization to CD4 mRNA levels in two clusters are shown (N). Data are representative of two independent experiments performed for the tissues isolated from each of patients (B, C, E, F, H–J). P values were determined by two-tailed unpaired t-test (A–C, F, G, N) or Pearson’s correlation coefficient (H–J).
Figure 2
Figure 2
The immunosuppressive function of growth differentiation factor 15 (GDF15) in vivo is related to regulatory T (Treg) cells. (A–D) GDF15 knockout Hepa1-6-luc cells (sgRNA2) or mock cells (Vec) were inoculated into the livers of syngeneic C57BL/6 mice (n=6 mice per group). Tumor growth was monitored by values of bioluminescence (p/s/cm2/sr) (A, right). Representative bioluminescence imaging of three mice in each group on day 16 and the liver images of all mice acquired on day 28 after euthanasia (A, left; the tumor is identified by the red line) are shown. Survival was evaluated by using another two groups of mice (n=6 mice per group) (B). GDF15 concentrations in the tumor and circulation of mice on day 28 after euthanasia (C) and the frequencies of Treg cells among CD4+ tumor-infiltrating lymphocytes (TILs) and splenic cells (D) were analyzed. (E–J) Sixteen days after Hepa1-6-sgRNA or Hepa1-6-Vec cells inoculation (n=9 mice per group), the tumor of each mouse was digested and filtered to obtain a single cell suspension. The cell suspensions of every three mice in each group were pooled. CD45+ tumor-infiltrating leukocytes were analyzed by mass cytometry (CyTOF) (n=3 samples per group). The t-distributed stochastic neighbor embedding (t-SNE) plot of CD4+ tumor-infiltrating leukocytes of total six samples (pooled data) (E, left panel; overlaid with color-coded clusters) and density t-SNE plots of CD4+ tumor-infiltrating leukocytes in Hepa1-6-sgRNA or Hepa1-6-Vec group (E, right two panels; 2×10⁵ cells per group were displayed) are shown. The frequencies of the CD4+ clusters were calculated as the assigned cell events divided by the total CD4+ cell events in the same sample (F). The normalized expression values (mean mass intensities) of Treg cell-related molecules and Ki67 in the CD4+ population are shown as a heatmap (G). The CD45+ population was plotted by t-SNE and density t-SNE with same methods, and it overlaid with 22 clusters (H, I). The frequencies of the indicated immune cell subsets within the CD45+ population are shown (J). Data are representative of three independent experiments (A–D). P values were determined by a two-tailed Mann-Whitney U test (A), a log rank test (B) and a two-tailed unpaired t-test (C, D, F, J). n.s., not significant; p>0.05.
Figure 3
Figure 3
Growth differentiation factor 15 (GDF15) induces the generation of inducible regulatory T (iTreg) cells in vitro with an effect comparable to that of transforming growth factor β (TGF-β). (A–E) The iTreg cell generation from human naïve CD4+ cells after GDF15, TGF-β or Mock conversion (A). The expression of Treg cell signature genes (CTLA4, TNFRSF4, TIGIT, GITR) of the converted CD4+ T cells (B–E). (F) The inhibition of iTreg cells induced from human naïve CD4+ T cells by GDF15 (GDF15 iTregs) or mock treatment (Mock iTregs) to the proliferation of naïve CD4+CD25 T cells was determined by carboxy fluorescein succinimidyl ester (CFSE) dilution assay (n=4 cell cultures from four healthy donors). (G, H) The iTreg cell generation from mouse splenic naïve CD4+ T cells after mouse GDF15 (mGDF15) or mock conversion (G). The inhibition of iTreg cells induced from mouse naïve CD4+ T cells by mouse GDF15 (mGDF15 iTregs) or mock treatment (Mock iTregs) to the proliferation of mouse naïve CD4+ T cells was determined by CFSE dilution assay (H). (I) The inhibitions of iTreg cells induced from mouse naïve CD4+ T cells (transparent) by mouse GDF15 (mGDF15 iTregs) or mock treatment (Mock iTregs) to GFP CD4+ T cell was visually observed with real-time confocal microscopy for 8 hours (see online supplemental videos 1 and 2). Live GFP CD4+ T cells were counted 3 hours after mixing (for each cell culture, 10 high-power fields (HPFs) were counted) (n=4 cell cultures). Mock, anti-CD3/anti-CD28 monoclonal antibodies (mAbs) and interleukin (IL)-2 stimulations. Data are representative of three independent experiments. P values were determined by a two-tailed unpaired t-test. Iso, isotype control; n.s., not significant; p>0.05.
Figure 4
Figure 4
Growth differentiation factor 15 (GDF15)-deficient mice are defective in the generation of competent regulatory T (Treg) cells. (A, B) Frequencies of Treg cells among the total CD4+ T cell population in spleen, mesenteric lymph nodes (MLNs), gut lamina propria (gLP), peripheral blood and thymus of GDF15 whole-body knockout mouse strain (GDF15 KO) or wild-type (WT) mice (A). The activation status of splenic CD4+ T cells of GDF15 KO or WT mice (B) (n=8 mice per group). (C) Real-time survival of Hepa1-6-OVA cells cocultured with OT-I cells (+OT I), OT-I cells plus Treg cells from GDF15 KO mice (+OT I+GDF15 KO Tregs) or from WT mice (+OT I+WT Tregs). Data at 120 hours are shown as a bar (n=4 cell cultures). (D) A total of 2×10⁶ naive CD4+ T cells from B6-GFP (CD45.1) mice were transferred into irradiated GDF15 KO or WT mice (n=6 mice per group). Five days later, CD45.1 T cells of GDF15 KO or WT mice were sorted and the frequency of Treg cells was determined. (E–G) A total of 2×10⁶ primary natural Treg (nTreg) cells of B6-GFP (CD45.1) mice were transferred into irradiated GDF15 KO mice or their WT littermates (n=6 mice per group). Five days later, CD4+CD25hiFOXP3+ Treg cells were isolated, and the quantity and proportion of CD45.1 cells among the isolated Treg cells (E), and the expression of forkhead box P3 (FOXP3) and cytotoxic T lymphocyte-associated molecule 4 (CTLA4) in sorted CD45.1 cells was determined (F, G). Data are representative of two (A, B) or three (C–G) independent experiments. P values were determined by two-tailed unpaired t-test. Iso, isotype control; n.s., not significant; p>0.05.
Figure 5
Figure 5
Growth differentiation factor 15 (GDF15) blocks FOXP3 ubiquitination by downregulating STUB1. (A, B) The protein and messenger RNA (mRNA) expressions of FOXP3 in human or mouse naïve CD4+ T cells after indicated stimulation. (C) FOXP3 expressions in GDF15 or transforming growth factor β (TGF-β) induced human (upper panel) or mouse (lower panel) inducible regulatory T (iTreg) cells after treated with cycloheximide (CHX) of the indicated time. (D, E) Coimmunoprecipitation (CoIP) analysis of FOXP3 ubiquitination in human (D) and mouse (E) naïve CD4+ T cells after indicated stimulation. (F) Reciprocal CoIP analysis of FOXP3 ubiquitination in human naïve CD4+ T cells. (G, H) CoIP analysis of FOXP3 ubiquitination in human (G) and mouse (H) primary natural Treg (nTreg) cells after indicated stimulation. (I) Gene set enrichment analysis (GSEA) of ubiquitination genes in GDF15 converted iTreg cells versus those in TGF-β converted iTreg cells. The enrichment score (ES) and p value are reported for the gene ontology (GO) term ‘protein ubiquitination’ and were calculated from GSEA data with weighted enrichment statistics and the ratio of classes for the metric as input parameters. (J) Heatmap showing expressions of 26 FOXP3 ubiquitination-related genes (including STUB1, arrow) in GDF15 or TGF-β converted iTreg cells (n=4 cell cultures). (K, L) The expression of STUB1 in GDF15 or TGF-β converted iTreg cells from human (K) and mouse (L) naïve CD4+ T cells. (M, N) The protein (M) and mRNA (N) expression levels of STUB1 in GDF15 simulated human nTreg cells or mouse GDF15 simulated mouse nTreg cells. (O, P) FOXP3 accumulation (O) and ubiquitination (P) in either STUB1 (WT) or its K30A or H260Q mutants or control vector (Vec) successfully transduced Jurkat T cells after indicated stimulation. Mock, anti-CD3/anti-CD28 monoclonal antibodies (mAbs) and interleukin (IL)-2 stimulations. Data are representative of three independent experiments. The mRNA expressions of FOXP3 and STUB1 are normalized to that of the reference gene GAPDH (B, K, L, N, n=4 cell culture). The intensities of target bands were quantified and normalized to GAPDH expression (A, C, K–M, O). P values were determined by a two-tailed unpaired t-test (B, K, L, N), n.s., not significant; WCL, whole-cell lysate; p>0.05.
Figure 6
Figure 6
Growth differentiation factor 15 (GDF15) interacts with CD48 and downregulates STUB1 through inhibition of the ERK/AP-1 pathway. (A) Coimmunoprecipitation (CoIP) analysis of the interaction between GDF15 and CD48. (B, C) ELISA confirmed GDF15 binds to CD48 in a dose-dependent manner and transforming growth factor β (TGF-β) did not exhibit interaction with CD48 (B). The interaction of GDF15 to plate-bound CD48 could be blocked by the addition of soluble CD48 protein (C) (n=4). (D) Representative immunofluorescence (IF) analysis of the interaction of GDF15 (red) with CD48 (green) on Jurkat T cells. (E) The interaction of GDF15 with purified CD48, as measured by surface plasmon resonance (SPR) spectroscopy. (F) ELISA confirmation of mouse GDF15 with mouse CD48 (n=4). (G–J) In human (G, I) and mouse (H, J) naïve CD4+ T cells, anti-CD3/anti-CD28 monoclonal antibodies (mAbs) and interleukin (IL)-2 stimulations with GDF15 (GDF15) or mouse GDF15 (mGDF15) led to a steady decline in the phosphorylation of Lck and ERK, and the decreasing of c-fos and c-jun in nucleus. Expression levels of p-Lck and p-ERK were quantified and normalized to GAPDH expression. (K, L) Chromatin immunoprecipitation experiments showed that anti-CD3/anti-CD28 mAbs and IL-2 stimulations with GDF15 or mGDF15 significantly decreased the binding of c-jun and c-fos to the STUB1 promoter in human (K) and mouse (L) naïve CD4+ T cells (n=4 cell cultures). (M) The phosphorylation of ERK and the expressions of STUB1 and FOXP3 in unmanipulated Jurkat T cells after anti-CD28/anti-CD3 mAbs and IL-2 stimulations (Mock), CD48 gene (GDF15+WT) or control vector (GDF15+Vec) successfully transduced Jurkat T cells after anti-CD28/anti-CD3 mAbs and IL-2 stimulations with GDF15. (N) The phosphorylation of ERK and the expression of STUB1 and FOXP3 in unmanipulated (Mock), control knockout (CD48_Vec) and CD48 knockout Jurkat T cells after anti-CD28/anti-CD3 mAbs and IL-2 stimulations without (CD48_sgRNA) or with (CD48_sgRNA+GDF15) GDF15. Data are representative of two (E) or three (A–D, F–M) independent experiments. The intensities of target bands were quantified and normalized to GAPDH expression (G–J, M, N). P values were determined by a two-tailed unpaired t-test (B, F, K, L), n.s., not significant; p>0.05.
Figure 7
Figure 7
A growth differentiation factor 15 (GDF15) neutralizing monoclonal antibody (mAb) (G15A) amplifies antitumor immunity in mice. (A–E) Mice carrying Hepa1-6-Luc cells in livers were treated with G15A or control antibody (Iso) (A, n=8 mice per group). Tumor growth was monitored by values of bioluminescence (p/s/cm2/sr) (B). Representative bioluminescence imaging of four mice in each group on day 21 and liver images of all 16 mice acquired on day 28 after euthanasia are shown (A, the tumor is identified by the dotted line). Survival was evaluated using another two groups of mice (C, n=8 mice per group). The frequencies of regulatory T (Treg) cells among CD4+ tumor-infiltrating lymphocytes (TILs) and splenic CD4+ T cells (D), and Ki67 expression in CD4+ and CD8+ TILs (E) on day 28 after euthanasia are shown. (F–I) Mice carrying Hepa1-6-Luc cell in livers were treated with Iso, Iso plus antimouse programmed cell death protein 1 (PD-1) antibody (PD-1 mAb) or G15A plus PD-1 mAb (n=8 mice per group). Tumor growth was monitored by bioluminescence (p/s/cm2/sr) (F). Representative bioluminescence imaging of four mice in each group at day 21 are shown (G). Survival was evaluated in another three groups of mice (H, n=8 mice per group). The frequencies of Treg cells among CD4+ TILs cells on 28 days after euthanasia are shown (I). (J–L) Mice carrying Hepa1-6-OVA cells in livers were treated with Iso, Iso plus OT-I T cells or G15A plus OT-I T cells. Tumor weights at day 21 after mice were euthanized (J), the frequency of Treg cells among CD4+ TILs (K) and Ki67 expression in OT-I T cells in tumors on day 21 are shown (L). Data are representative of three independent experiments. P values were determined by two-tailed Mann-Whitney U test (B, G), log rank test (C, H) or two-tailed unpaired t-test (D, E, I–K), Iso, isotype control; n.s., not significant; p>0.05.

References

    1. Hegde PS, Chen DS. Top 10 challenges in cancer immunotherapy. Immunity 2020;52:17–35. 10.1016/j.immuni.2019.12.011 - DOI - PubMed
    1. El-Khoueiry AB, Sangro B, Yau T, et al. . Nivolumab in patients with advanced hepatocellular carcinoma (CheckMate 040): an open-label, non-comparative, phase 1/2 dose escalation and expansion trial. Lancet 2017;389:2492–502. 10.1016/S0140-6736(17)31046-2 - DOI - PMC - PubMed
    1. Robert C, Schachter J, Long GV, et al. . Pembrolizumab versus ipilimumab in advanced melanoma. N Engl J Med 2015;372:2521–32. 10.1056/NEJMoa1503093 - DOI - PubMed
    1. Motzer RJ, Escudier B, McDermott DF, et al. . Nivolumab versus everolimus in advanced renal-cell carcinoma. N Engl J Med 2015;373:1803–13. 10.1056/NEJMoa1510665 - DOI - PMC - PubMed
    1. Garon EB, Hellmann MD, Rizvi NA, et al. . Five-Year overall survival for patients with advanced Non‒Small-Cell lung cancer treated with pembrolizumab: results from the phase I KEYNOTE-001 study. J Clin Oncol 2019;37:2518–27. 10.1200/JCO.19.00934 - DOI - PMC - PubMed

Publication types