. 2021 Sep 6;12(1):5270.
doi: 10.1038/s41467-021-25653-w.

Nrf1 promotes heart regeneration and repair by regulating proteostasis and redox balance

Affiliations

Nrf1 promotes heart regeneration and repair by regulating proteostasis and redox balance

Miao Cui et al. Nat Commun. .

Abstract

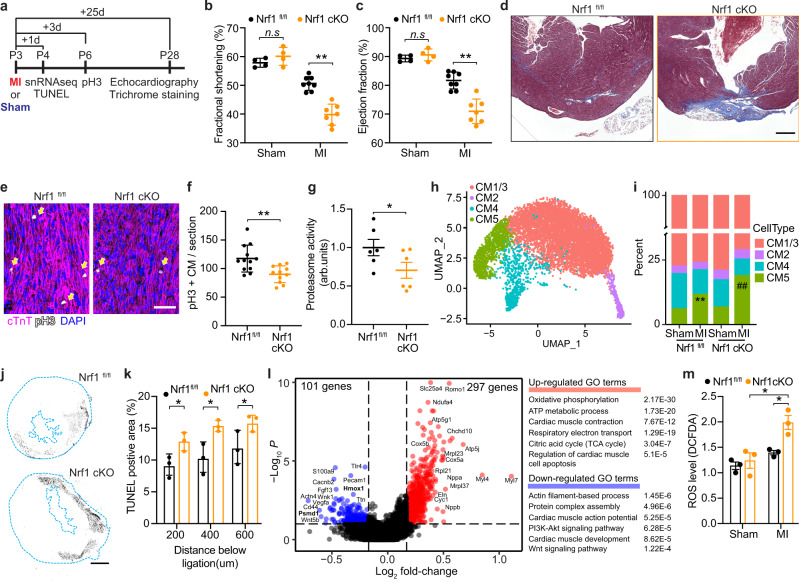
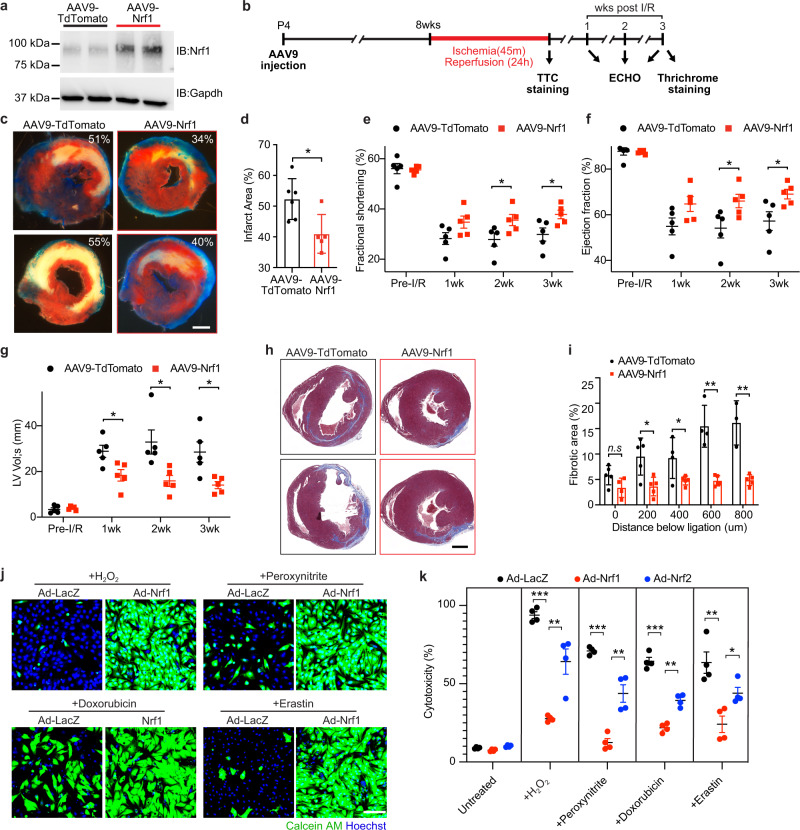
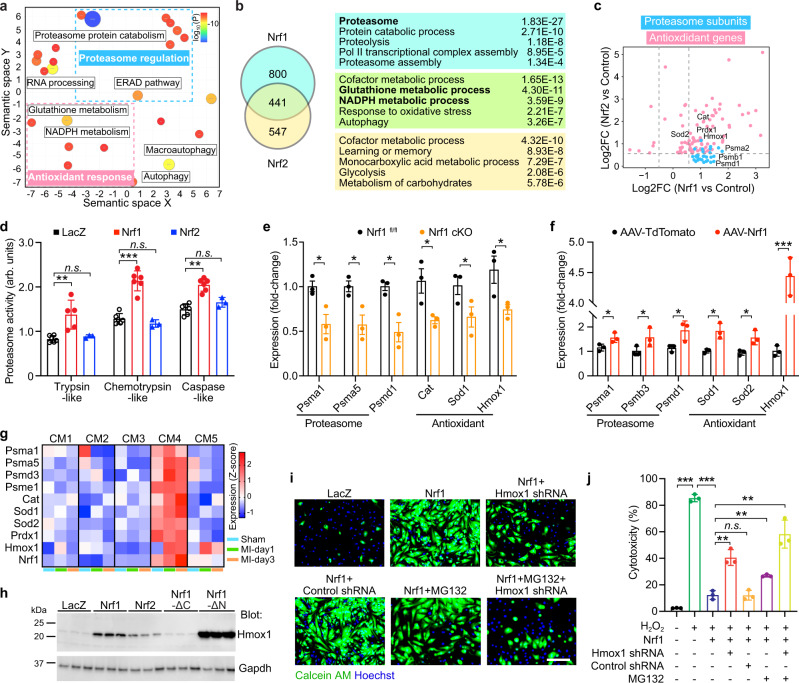
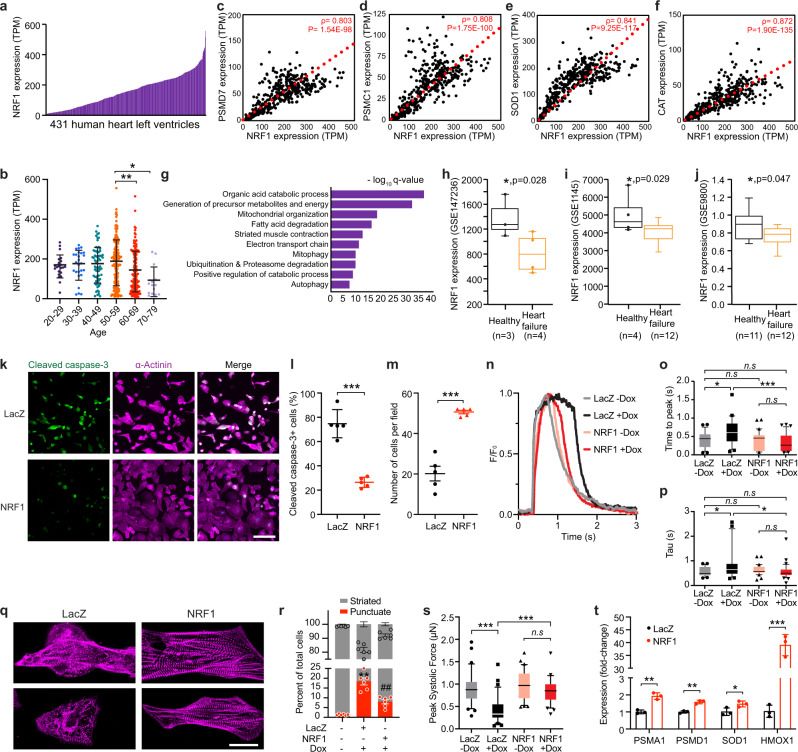
Following injury, cells in regenerative tissues have the ability to regrow. The mechanisms whereby regenerating cells adapt to injury-induced stress conditions and activate the regenerative program remain to be defined. Here, using the mammalian neonatal heart regeneration model, we show that Nrf1, a stress-responsive transcription factor encoded by the Nuclear Factor Erythroid 2 Like 1 (Nfe2l1) gene, is activated in regenerating cardiomyocytes. Genetic deletion of Nrf1 prevented regenerating cardiomyocytes from activating a transcriptional program required for heart regeneration. Conversely, Nrf1 overexpression protected the adult mouse heart from ischemia/reperfusion (I/R) injury. Nrf1 also protected human induced pluripotent stem cell-derived cardiomyocytes from doxorubicin-induced cardiotoxicity and other cardiotoxins. The protective function of Nrf1 is mediated by a dual stress response mechanism involving activation of the proteasome and redox balance. Our findings reveal that the adaptive stress response mechanism mediated by Nrf1 is required for neonatal heart regeneration and confers cardioprotection in the adult heart.


Conflict of interest statement

The authors declare no competing interests as defined by Nature Research.

Figures

Fig. 1
Fig. 1. Nrf1 is expressed in regenerative CM4 cardiomyocytes.
a Violin plot showing the expression of Acta2 in CM1–CM5 cardiomyocyte populations. Expression levels are shown as reads per 10k counts. b Acta2 and Tnnt2 RNA transcripts detected by RNA-scope probes in the left ventricular myocardium on a transverse section of P1 hearts. Scale bar, 20 μm. c Quantification of Acta2 transcript levels in cardiomyocytes from P1 and P8 heart; n = 29–34 cardiomyocytes were quantified. d Acta2 and Tnnt2 RNA transcripts detected by RNA-scope probes in the left ventricular myocardium on a transverse section of P8 hearts. Scale bar, 20 μm. e Schematic diagram showing the spatial transcriptome analysis of heart sections to identify anatomic locations of cardiac cell type populations. f Hematoxylin and eosin (H&E) image of a heart transverse section collected at 7-day post P1 MI. Left and right ventricles are indicated. Black arrowheads depict fibrotic tissue; Scale bar, 500 μm. g Left: cell type composition shown in pie-charts for individual spatial spots mapped onto the heart section with H&E staining shown in (f). Right: the boxed region is shown in high magnification overlayed with the H&E image to highlight the fibrotic region; Scale bar, 200 μm. hm Anatomic localization of endocardial cells (h), immune cells (i), fibroblasts (j), CM1 (k), CM5 (l), and CM4 (m) on the same heart section in (f). Color scale indicates cell type ratio from 0 to 1. Endocardium is outlined by black dash lines, and infarct region, which is identified by the location of suture, is outlined in white; Scale bar, 500 μm. n Expression correlation plots between Nrf1, Acta2, and Mki67 in individual cardiomyocytes from our previous snRNA-seq data (GSE130699). Nrf1 positively correlates with Acta2 (Spearman’s coefficient = 0.91). Color scale represents the expression level of Mki67. Expression levels are shown as reads per 10k counts. o, p Nrf1 and Tnnt2 RNA transcripts detected by RNA-scope probes in the left ventricular myocardium on transverse sections of P1 hearts (o) and P8 hearts (p). Scale bar, 20 μm. q Quantification of Nrf1 expression levels in cardiomyocytes from P1 and P8 hearts; n = 30 cardiomyocytes were quantified for each group. fm experiments were repeated independently twice with similar results. ***p < 0.0001, Student’s t-test two-tailed. c and q arb. units. arbitrary units. e and g EC endothelial cells, EndoEC endocardial cells, FB fibroblasts, EPI epicardial cells.
Fig. 2
Fig. 2. Nrf1 deletion impairs neonatal heart regeneration.
a Illustration showing timeline of MI and Sham surgeries performed at P3 and subsequent days of sample collection. b, c Fractional shortening (b) and ejection fraction (c) of Nrf1fl/fl and Nrf1 cKO mouse hearts at 25 days after MI or Sham surgery; n = 4 animals for Sham groups and n = 7–8 animals for MI groups; **p = 0.0022 (b), **p = 0.0009 (c) by Student’s t-test two-tailed. d Masson’s trichrome staining showing fibrotic scarring in Nrf1fl/fl and Nrf1 cKO mouse hearts at 25-day after MI; similar results were observed in six animals; Scale bar, 200 μm. e Immunohistochemistry showing pH3+ cardiomyocytes (cTnT+), marked by arrows, in heart sections collected from Nrf1 cKO and Nrf1fl/fl mice 3-day post-MI; Scale bar, 50 μm. f Quantification of pH3+ cardiomyocytes (cTnT+) in heart sections from (e); n = 12 animals for WT and n = 11 animals for Nrf1 cKO, **p = 0.0034 by Student’s t-test two-tailed. g Chymotrypsin-like activity of the proteasome in hearts from Nrf1 cKO and Nrf1fl/fl mice at P4. arb. units, arbitrary units; n = 6 animals for each group; *p = 0.0373 by Student’s t-test one-tailed. h UMAP visualization of cardiomyocyte clusters colored by identity. CM1 and CM3 were merged as a single cluster due to their transcriptome similarity. i Fraction of cardiomyocyte populations in Nrf1fl/fl and Nrf1 cKO hearts in MI or Sham conditions; n = 4–6 animals for each group examined over 1 independent experiment; **p = 4.49E−16 compared to WT-Sham, ##p = 5.05E−31 compared to KO-Sham; Chi-squared test. j Representative images showing TUNEL staining on heart sections from Nrf1 cKO and Nrf1fl/fl mice at 1-day post-MI; Scale bar, 500 μm. k Quantification of TUNEL positive area in heart sections collected at 200, 400, and 600 μm below the ligation from Nrf1 cKO and Nrf1fl/fl mice at 1-day post-MI; n = 3 animals for each group; *p = 0.039 (200 μm); p = 0.025 (400 μm), p = 0.047 (600 μm), Student’s t-test two-tailed. l Volcano plot showing fold-change and p-value of genes up-regulated (red) and down-regulated (blue) in CM4 cells of Nrf1 KO hearts compared to CM4 cells in control hearts at 1-day post-MI; p-adjust < 0.1 and fold-change > 1.5 were used for cutoffs; p-adjust values are calculated by Wilcoxon rank-sum test two-tailed. Top enriched GO terms are shown (right). m Quantification of ROS levels in Nrf1 cKO and Nrf1fl/fl mice at 3-day post-MI or Sham; n = 3 animals for each group. WT-MI vs Nrf1 cKO-MI, *p = 0.015; Nrf1 cKO-Sham vs. Nrf1 cKO-MI, *p = 0.022, by Student’s t-test two-tailed. b, c, f, g, k, m results are shown as mean ± s.e.m.; n.s. not significant.
Fig. 3
Fig. 3. Nrf1 overexpression protects cardiomyocytes against I/R and cardiotoxin injury.
a Western blot analysis showing Nrf1 expression in hearts from mice at 4-week after AAV9-TdTomato and AAV9-Nrf1 injection at P4; experiments were repeated independently twice with similar results. b Illustration of a timeline showing the experimental design for AAV9 injection and time points of sample collections. c TTC staining showing infarct size on transverse heart sections collected at the end of reperfusion; Scale bar, 500 μm. d Quantification of infarct area in sections from (c); AAV9-TdTomato, n = 6; AAV9-Nrf1, n = 5; *p = 0.0183, by Student’s t-test two-tailed. eg Fractional shortening (e), ejection fraction (f), and systolic volume (g) of left ventricles from AAV9-TdTomato and AAV9-Nrf1 hearts at baseline (before I/R), and 1–3 weeks (wk) after I/R; n = 5 animals for each group. e 2wk, *p = 0.0388; 3wk, *p = 0.034. f 2wk, *p = 0.0422; 3wk, *p = 0.0336. g 1wk, *p = 0.0207, 2wk, *p = 0.0188; 3wk, *p = 0.0155. h Masson’s trichrome staining showing fibrotic scarring on transverse sections of hearts collected at 600 μm below the ligation suture; Scale bar, 500 μm. i Quantification of fibrotic regions of heart sections collected at multiple planes below the ligation suture from AAV-TdTomato and AAV-Nrf1 mice; AAV9-TdTomato, n = 5; AAV9-Nrf1, n = 4; 200 μm, *p = 0.012, 400 μm, *p = 0.0455, 600 μm, *p = 0.0007, 800 μm, *p = 0.0012. j Viable NRVMs with adenoviral (Ad) overexpression of LacZ or Nrf1 following H2O2, peroxynitrite, doxorubicin, and erastin treatments, indicated by Calcein AM (green); Scale bar, 100 μm. k Cell death measured by lactate dehydrogenase (LDH) release in NRVMs-overexpressing LacZ, Nrf1, or Nrf2 following toxin treatments; n = 4 biologically independent experiments for each group. H2O2, ***p < 0.000001, **p = 0.0043. Peroxynitrite, ***p < 0.000001, **p = 0.0022. Doxorubicin, ***p = 0.000006, **p = 0.0003. Erastin, **p = 0.0039, *p = 0.0215. dg, i, k Results are shown as mean ± s.e.m.; Student’s t-test two-tailed; n.s. not significant.
Fig. 4
Fig. 4. Nrf1 confers protection by regulating the proteasome and antioxidant response.
a Gene ontology analysis of genes upregulated in Nrf1 samples compared to LacZ control samples. Upregulated genes are displayed in semantic space as clusters; the color and proportional size of circles indicate log10 (P value). P values were obtained using Metascape (see the “Methods” section). b Left: Venn diagram showing a number of genes upregulated by Nrf1, Nrf2, or both; Right: top enriched GO terms for each gene group. c Log2 fold-change (FC) of selected proteasome subunit genes (blue) and antioxidant genes (pink) in NRVMs overexpressing Nrf1 (x-axis) or Nrf2 (y-axis). d Proteasomal activity in arbitrary units (arb. units) of NRVMs overexpressing LacZ, Nrf1 or Nrf2; n = 6 biologically independent experiments for groups LacZ and Nrf1; n = 3 biologically independent experiments for group Nrf2; Trypsin-like, **p = 0.0030; Chemotrypsin-like, ***p = 0.000009; Caspase-like, **p = 0.000031. e qPCR measurement of proteasome subunit genes and antioxidant genes in Nrf1 cKO and control hearts at P14; n = 3 for each group. Psma1, *p = 0.0266; Psma5, *p = 0.0261; Psmd1, *p = 0.0120; Cat, *p = 0.0364; Sod1,*p = 0.0462, Hmox1, *p = 0.0510. f qPCR measurement of proteasome subunit genes and antioxidant genes in AAV-Nrf1 and AAV-TdTomato hearts from 2-month-old mice; n = 3 for each group. Psma1, *p = 0.0459; Psmb3, *p = 0.0426; Psmd1, *p = 0.0507; Sod1, *p = 0.0128; Sod2, *p = 0.0268, Hmox1, ***p = 0.0001. g Expression of proteasome subunit genes and antioxidant genes in CM1–CM5 cells from our previous snRNA-seq data (GSE130699). Expression levels in z-scores from 1-day post-Sham (Sham), 1-day post-MI (MI-day1), and 3-day post-MI (MI-day3) samples were plotted. h Western blot showing Hmox1 expression in NRVMs overexpressing LacZ, Nrf1, Nrf2, Nrf1-ΔN, or Nrf1-ΔC. i, j Viable cells (i, green) and percent of cell death (j) in NRVMs overexpressing Nrf1 plus Hmox1 shRNA, or MG132 treatment, or both, following H2O2 treatment; n = 3 biologically independent experiments. ***p < 0.0001, **p = 0.002 (column 3 vs. 4 and column 3 vs. 7), **p = 0.0018 (column 3 vs. 6). Scale bar, 100 μm; d, e, f, j results are shown as mean ± s.e.m.; Student’s t-test two-tailed; n.s. not significant.
Fig. 5
Fig. 5. NRF1 is an essential stress regulator in human iPSC-derived cardiomyocytes.
a Expression (TPM, transcript per million reads) of NRF1 in 431 human heart left ventricle samples from the GTEx database. Samples were collected from 293 males and 138 females. b Expression of NRF1 grouped by age. Age 20–29, n = 22; Age 30–39, n = 26; Age 40–49, n = 66; Age 50–59, n = 154; Age 60–69, n = 149; Age 70–79, n = 14; *p = 0.0106, **p = 0.0027, one-way ANOVA test. cf Expression correlation plots showing that PSMD7 (c), PSMC1 (d), SOD1 (e), and CAT (f) are highly co-expressed with NRF1 in the 431 human heart left ventricle samples from the GTEx database. Spearman’s correlation coefficient (ρ) and p-values are depicted; one-tailed t-test. g Top enriched GO terms for the 1167 NRF1 co-expressed genes. hj NRF1 expression is significantly reduced in heart ventricular tissue from patients with heart failure compared to healthy hearts. Box-and-whisker plots are provided in which the central line denotes the median value, the edges of the boxes represent the upper and lower quartiles, and whiskers indicate the minimum and maximum values; *p < 0.05 with exact p-value depicted. h RNAseq data from GSE147236; n = 4 for heart failure, n = 3 for healthy control; two-tailed Wald test. i Affymetrix microarray data from GSE1145; n = 12 for heart failure, n = 4 for healthy control; Wilcoxon rank sum test two-tailed. j Agilent microarray data from GSE9800; n = 12 for heart failure, n = 11 for healthy control; Wilcoxon rank-sum test two-tailed. k Immunostaining of cleaved caspase-3 and α-actinin in hPSC-CMs overexpressing NRF1 or LacZ after Dox treatment. Scale bar, 100 μm. l, m Quantification of the percentage of cleaved caspase-3+ cardiomyocytes (l) and total cell number (m) in hPSC-CMs overexpressing NRF1 or LacZ after Dox treatment. ***p < 0.0001, Student’s t-test two-tailed. n Calcium transient in hPSC-CMs overexpressing NRF1 or LacZ with and without Dox treatment; n = 29–33 cells from two independent experiments were measured for each group. o, p Quantification of time-to-peak (o) and average decay time (Tau) (p) of calcium transient in hPSC-CMs overexpressing NRF1 or LacZ with and without Dox treatment; n = 29–33 cells from two independent experiments were measured for each group. o *p = 0.0163, ***p = 0.0004; p LacZ (−Dox) vs. LacZ (+Dox), *p = 0.0479; LacZ (+Dox) vs. Nrf1 (+Dox), *p = 0.0416; one-way ANOVA. q Immunostaining with α-actinin antibody showing sarcomere disarray in LacZ control cells and preserved sarcomere organization in NRF1-expressing cells after Dox treatment. Scale bar, 20 μm; r Quantification of the percentage of sarcomere disarray in hPSC-CMs overexpressing NRF1 or lacZ treated with Dox; n = 481 cells from six independent experiments were measured for the ‘−Dox’ group; n = 83 cells from six independent experiments were measured for the ‘LacZ + Dox’ group; n = 233 cells from six independent experiments were measured for the ‘NRF1 + Dox’ group. **p < 0.0001 compared to untreated ‘−Dox’ sample; ##p = 0.001 compared to ‘LacZ + Dox’ sample; Student’s t-test two-tailed. s Peak systolic force of single hPSC-CMs overexpressing NRF1 or LacZ with (+Dox) and without (−Dox) Dox treatment; n = 34 for LacZ (−Dox), n = 32 for LacZ (+Dox), n = 36 for NRF1 (−Dox), and n = 35 for NRF1 (+Dox) from two independent experiments; ***p < 0.0001, one-way ANOVA. t qPCR measurement of proteasome subunit genes, PSMA1 and PSMD1, and antioxidant genes, SOD1 and HMOX1, in hPSC-CMs overexpressing NRF1 or LacZ; n = 3 for each group; PSMA1, **p = 0.0019; PSMD1, **p = 0.0013; SOD1, *p = 0.0486; HMOX1, ***p < 0.0001; Student’s t-test two-tailed. b, l, t results are shown as mean ± s.d.; m, r results are shown as mean ± s.e.m.; o, p, s Box-and-whisker plots are provided in which the central line denotes the median value, the edges of the boxes represent the upper and lower quartiles, and whiskers indicate the 10–90 percentile values with points below or above the whiskers shown as individual dots. n.s. not significant.

Similar articles

Cited by

References

    1. Cohn JN, Ferrari R, Sharpe N. Cardiac remodeling-concepts and clinical implications: a consensus paper from an international forum on cardiac remodeling. Behalf of an International Forum on Cardiac Remodeling. J. Am. Coll. Cardiol. 2000;35:569–582. doi: 10.1016/S0735-1097(99)00630-0. - DOI - PubMed
    1. Gaballa MA, Goldman S. Ventricular remodeling in heart failure. J. Card. Fail. 2002;8:S476–S485. doi: 10.1054/jcaf.2002.129270. - DOI - PubMed
    1. Porrello ER, et al. Transient regenerative potential of the neonatal mouse heart. Science (N. Y., N. Y.) 2011;331:1078–1080. doi: 10.1126/science.1200708. - DOI - PMC - PubMed
    1. Porrello ER, et al. Regulation of neonatal and adult mammalian heart regeneration by the miR-15 family. Proc. Natl. Acad. Sci. USA. 2013;110:187–192. doi: 10.1073/pnas.1208863110. - DOI - PMC - PubMed
    1. Cui M, et al. Dynamic transcriptional responses to injury of regenerative and non-regenerative cardiomyocytes revealed by single-nucleus RNA sequencing. Dev. Cell. 2020;53:102–116.e108. doi: 10.1016/j.devcel.2020.02.019. - DOI - PMC - PubMed

Publication types

MeSH terms