. 2021 Sep 6;12(1):5289.
doi: 10.1038/s41467-021-25590-8.

Capillary-associated microglia regulate vascular structure and function through PANX1-P2RY12 coupling in mice

Affiliations

Capillary-associated microglia regulate vascular structure and function through PANX1-P2RY12 coupling in mice

Kanchan Bisht et al. Nat Commun. .

Abstract

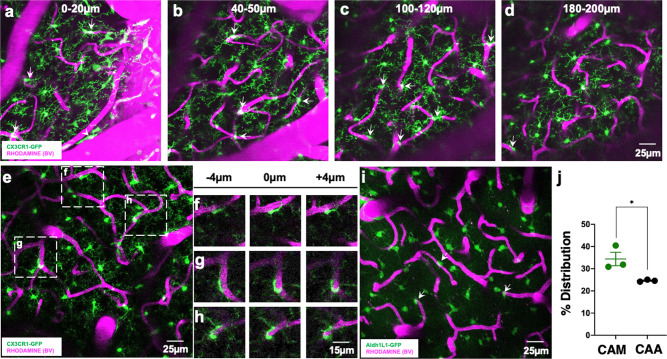
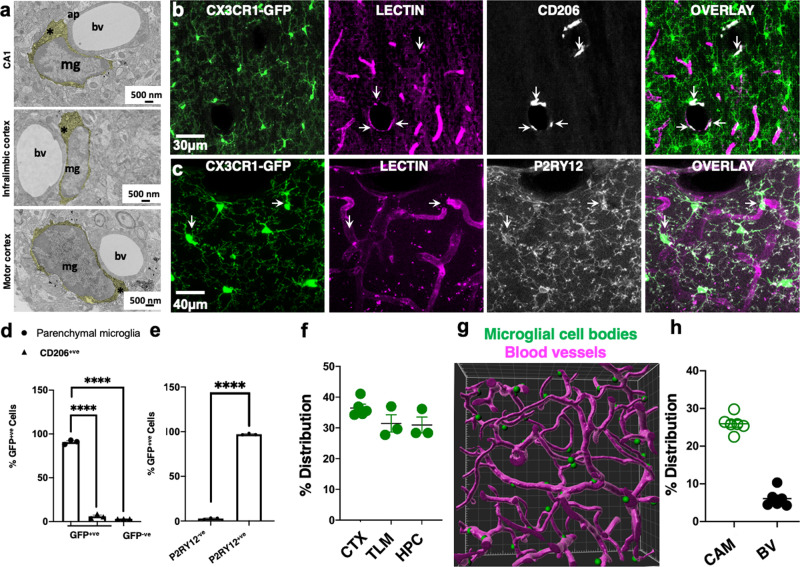
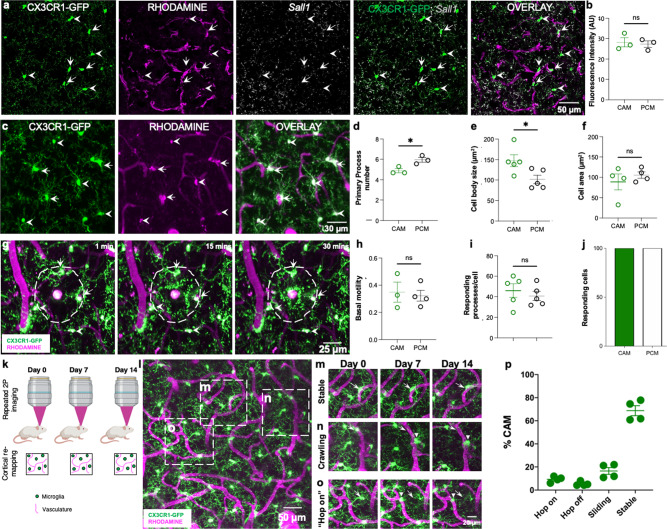
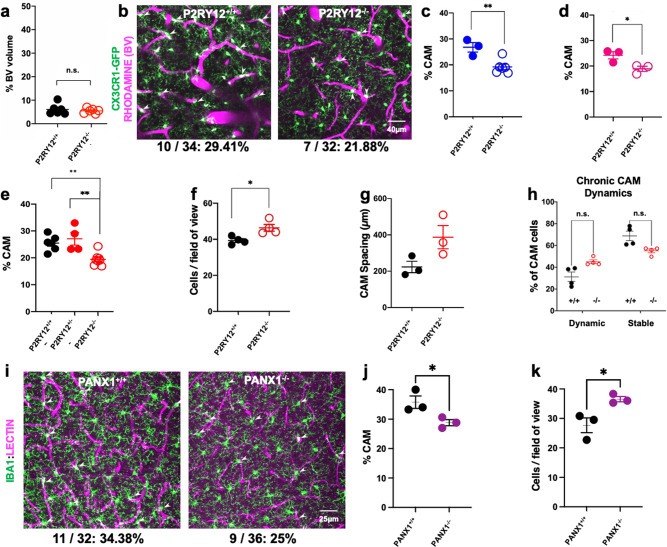
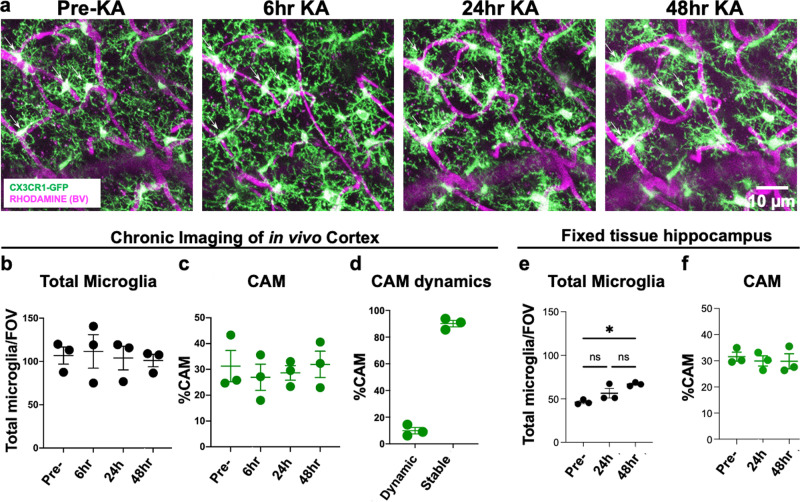
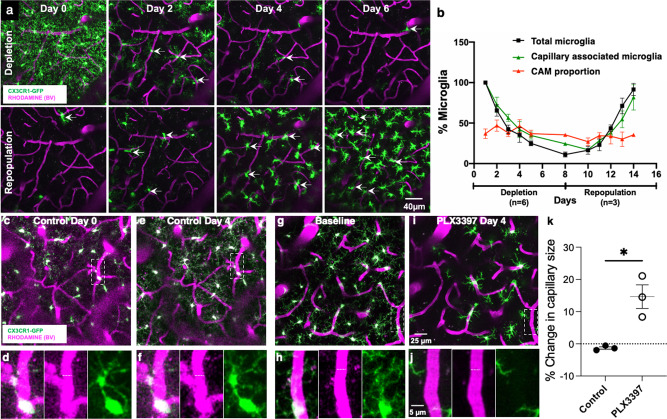
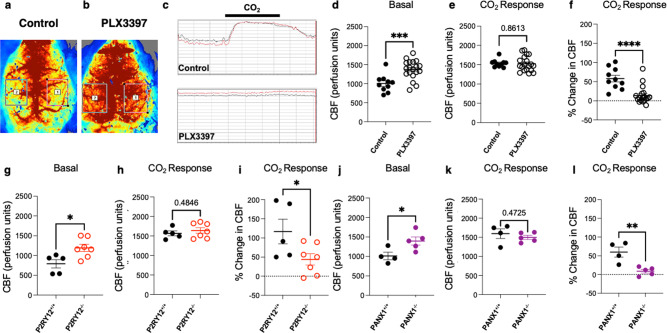
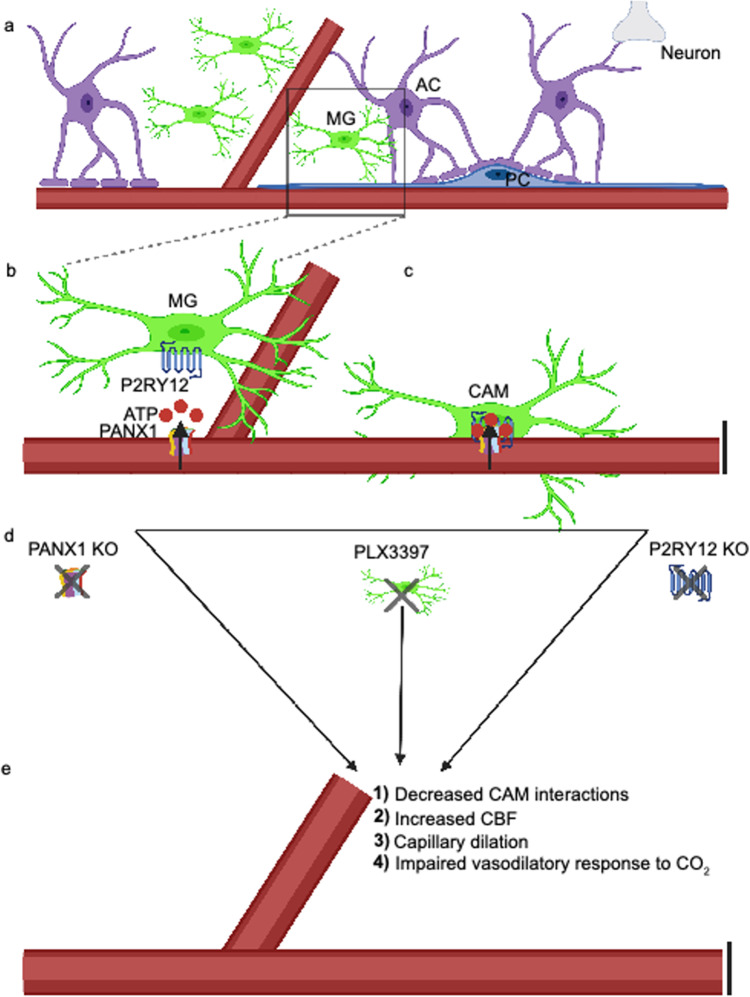
Microglia are brain-resident immune cells with a repertoire of functions in the brain. However, the extent of their interactions with the vasculature and potential regulation of vascular physiology has been insufficiently explored. Here, we document interactions between ramified CX3CR1 + myeloid cell somata and brain capillaries. We confirm that these cells are bona fide microglia by molecular, morphological and ultrastructural approaches. Then, we give a detailed spatio-temporal characterization of these capillary-associated microglia (CAMs) comparing them with parenchymal microglia (PCMs) in their morphological activities including during microglial depletion and repopulation. Molecularly, we identify P2RY12 receptors as a regulator of CAM interactions under the control of released purines from pannexin 1 (PANX1) channels. Furthermore, microglial elimination triggered capillary dilation, blood flow increase, and impaired vasodilation that were recapitulated in P2RY12-/- and PANX1-/- mice suggesting purines released through PANX1 channels play important roles in activating microglial P2RY12 receptors to regulate neurovascular structure and function.


Conflict of interest statement

The authors declare no competing interests.

Figures

Fig. 1
Fig. 1. Ramified CX3CR1+ myeloid cells associate with brain capillaries.
a–d Representative 20-µm-thick two-photon projection images from a CX3CR1GFP/+ adult brain showing myeloid cells (green) and the vasculature (rhodamine in magenta) at varying tissue depths between the brain surface and 200 µm of the cortex. Arrows identify capillary-associated ramified myeloid cells. e Representative 20-µm-thick in vivo two-photon image from a CX3CR1GFP/+ adult brain showing ramified myeloid cells (green) and the vasculature (rhodamine in magenta) in the cortex. fh Representative images from boxed regions in (e) showing somal interactions between the ramified myeloid cells and capillaries in an 8 µm tissue volume. i, j Representative 20-µm-thick two-photon projection image (i) and quantification (j) from an ALDH1L1GFP/+ P30 brain showing astrocytes (green) and the vasculature (rhodamine in magenta) in the cortex. Capillary-associated astrocytes (CAAs, arrows in i) density is compared to capillary-associated myeloid (CAM) density. n = 3 mice each. Representative images in (ah) were observed in five mice and in (i) was observed in three mice. Data are presented as mean values ± SEM. *p < 0.05. Two-sided unpaired Student’s t test.
Fig. 2
Fig. 2. Ramified CX3CR1+ capillary-associated myeloid cells are bona fide microglia.
a Electron microscopy images of capillary-associated microglia (mg) showing their cytoplasm (*), directly adjacent to blood vessels (bv) and astrocytic process (ap) in various brain regions. Microglial cell cytoplasm is psuedocolored yellow. Representative images were observed in three mice. b, c Representative projection images from a CX3CR1GFP/+ brain showing myeloid cells (green), the vasculature (lectin in magenta) and CD206+ (b) or P2RY12 (c) cells (white). d, e Quantification of CD206+ and CD206 cells (d, n = 3 mice) or P2RY12+ and P2RY12 cells (e, n = 3 mice). f Distribution of capillary-associated microglia in the cortex (CTX), thalamus (TLM), and hippocampus (HPC) as quantified from fixed brain tissues. n = 3–5 mice. g IMARIS generated 3D reconstructed image from two-photon data of microglial somata (green) associated with the vasculature (magenta). h Distribution of capillary-associated microglia (CAMs) amongst total microglia and blood vessel (BV) volume in total brain volume. n = 6 mice. Data are presented as mean values ± SEM. ****p < 0.0001. Two-sided unpaired Student’s t test in (e).
Fig. 3
Fig. 3. Comparison between capillary-associated microglia and parenchymal microglia.
a Representative images from a CX3CR1GFP/+ adult brain showing microglia (green) capillaries (magenta) and Sall1 transcripts (gray) with capillary-associated microglia (CAMs, arrows) parenchymal microglia (PCMs, arrowheads). b Quantification of microglial Sall1 expression in CAMs and PCMs. n = 10 CAM or PCM cells from each of three mice. c Representative in vivo two-photon projection images from a CX3CR1GFP/+ adult brain showing microglia (green) that are either capillary- (magenta) associated (arrows) or parenchyma-situated (arrowheads). df Quantification of microglial primary process numbers (d, n = 5 CAM or PCM cells from each of five fields of view from each of three mice), microglial cell body sizes and (e, n = 5 CAM or PCM cells from each of five fields of view from each of five mice) microglial whole-cell area between CAMs and PCMs (f, n = 5 CAM or PCM cells from each of three to five fields of view from each of four mice). g Representative in vivo two-photon projection images from a time-lapse movie collected from a CX3CR1GFP/+ mouse following a laser-induced injury. Microglial processes are directed towards the laser injury over time. hj Quantification of basal microglial motility (h, n = 3–4 CAM or PCM cells from each of three mice) number of responding processes per cell (i, n = 3–4 CAM or PCM cells each of five mice) and the percent of responding cells following the laser-induced injury between CAMs and PCMs (j). k A representative schematic showing the longitudinal imaging scheme for visualizing microglia and capillaries. lo Representative two-photon projection image from a CX3CR1GFP/+ adult brain during longitudinal imaging showing various microglial (green)–capillary (magenta) dynamics including stable interactions, which persist over the imaging period (m), crawling interactions in which the position on the capillary changes, but remains on the capillary (n) and “hop on,” in which parenchymal microglia relocate to a proximal capillary (o). p Quantification of the various types of dynamic CAMs over a 4-week imaging period. n = 3–5 fields of view from each of four mice. Data are presented as mean values ± SEM. *p < 0.05, and n.s. not significant. Two-sided unpaired Student’s t test.
Fig. 4
Fig. 4. P2RY12- and PANX1-dependent regulation of CAM interactions.
a Quantification of the blood vessel volume when compared to total brain volume in P2RY12+/+ and P2RY12−/− mice. n = 6 mice each. bd Representative 20-µm-thick two-photon projection images (p) and quantification in males (c, n = 3–5 mice each) and females (d, n = 3 mice each) from a CX3CR1GFP/+ adult brain showing capillary- (magenta) associated microglia (green, arrowheads) in P2RY12+/+ and P2RY12−/− mice (n = 3–5 mice each). e Quantification of CAM density relative to total microglial density in P2RY12+/+, P2RY12+/−, and P2RY12−/− mice (n = 4–6 mice each). f Quantification of microglial density in the in vivo cortical regions imaged in P2RY12+/+ and P2RY12−/− mice (n = 4 mice each). g Quantification of the spacing between microglia along the vasculature in P2RY12+/+ and P2RY12−/− mice (n = 3 mice each). h Quantification of CAM dynamics in P2RY12+/+ and P2RY12−/− mice (n = 4 mice each). ik Representative 20-µm-thick confocal projection images (i) and quantification of CAM density (j) and microglial cell density- (k) showing capillary- (magenta) associated microglia (green, arrowheads) in PANX1+/+ and PANX1−/− mice (n = 3 mice each). Data are presented as mean values ± SEM. *p < 0.05, **p < 0.01, and n.s. not significant. Two-sided unpaired Student’s t test in a, c, d, f, g, h, j, and k.
Fig. 5
Fig. 5. CAM interactions are not altered by increased neuronal activity.
a Representative in vivo two-photon projection images from the same field of view in a CX3CR1GFP/+ adult brain showing capillary- (magenta) associated microglia (green) before and up to 48 h after KA-induced seizures. b, c Quantification of total microglial (b) and capillary-associated microglial (c) density over time before and following seizures. d Quantification of the stable and dynamic CAMs following seizures. ef Quantification of total microglial (e) and capillary-associated microglial (f) density from fixed slices in the hippocampus following seizures. n = 3 mice each. Data are presented as mean values ± SEM. *p < 0.05. n.s. not significant. Two-sided unpaired Student’s t test in b, c, e, and f.
Fig. 6
Fig. 6. Microglia regulate capillary diameter.
a Representative 20-µm-thick in vivo two-photon projection image from a CX3CR1GFP/+ adult brain during longitudinal imaging with PLX3397 treatment (top) and withdrawal (bottom) showing microglial (green) depletion and repopulation with the preservation of the vasculature (magenta). b Quantification through the time of the depletion and repopulation scheme for all microglia and capillary-associated microglia as well as the proportion of CAMs relative to remaining microglia. n = 4 mice. cf Representative two-photon projection image from a CX3CR1GFP/+ adult brain during longitudinal imaging with a mouse fed control chow. Representative microglia (green) and blood vessels (magenta) in boxed regions in (c, e) are magnified in (d, f). Dashed lines indicate the capillary diameter. (g–j) Representative two-photon projection image from a CX3CR1GFP/+ adult brain during longitudinal imaging with a mouse fed PLX3397 chow. A representative microglia in the boxed regions in (g) is magnified in (h) and depleted in (i, j). Dashed lines indicate the capillary diameter. k Quantification of percent change in capillary size following control or PLX3397 treatment. n = 3–7 capillaries from 11 to 13 fields of view from each of three mice. Data are presented as mean values ± SEM. *p < 0.05; two-sided unpaired Student’s t test.
Fig. 7
Fig. 7. Microglia regulate vascular function through PANX1–P2RY12 coupling.
ac Representative laser speckle images (a, b) and graphical tracing (c) of cerebral blood flow in control and following PLX3397 treatment. df Quantification of basal cerebral blood flow (d), cerebral blood flow in response to CO2 response (e), and the change in cerebral blood flow with CO2 treatment (f) in control or PLX3397-treated conditions. n = 10 control and 19 PLX3397-treated mice. gl Quantification of basal cerebral blood flow (g, n = 5–7 mice each and j, n = 4–5 mice each) cerebral blood flow in response to CO2 response (h, n = 5–7 mice each and k, n = 4–5 mice each) and the change in cerebral blood flow with CO2 treatment (i, n = 5–7 mice each and l, n = 4–5 mice each) in P2RY12+/+ and P2RY12−/− mice (gi) and PANX1+/+ and PANX1−/− mice (jl) (n = 4–7 mice each). Data are presented as mean values ± SEM. *p < 0.05; **p < 0.01; ***p < 0.001; ****p < 0.0001. Two-sided unpaired Student’s t test.
Fig. 8
Fig. 8. Vessel-associated ATP released from pannexin1 (PANX1) attracts microglial cell bodies to capillaries through P2RY12 to regulate homeostatic cerebrovascular physiology.
a A cartoon depicting the neurovascular unit consisting of astrocytes (ACs), pericytes (PCs), microglial cells (MGs), neurons, and the associated vasculature. The black box indicates a zoomed-in region depicted in (b), showing microglial expression of the P2RY12 and capillary expression of the ATP permeable integral membrane protein PANX1. c P2RY12–PAN1 coupling mediate microglial interactions with the vasculature, where those microglia whose cell bodies reside on the vasculature are referred to as capillary-associated microglia (CAMs). Knockout of PANX1, microglial depletion with PLX3397, or knockout of the P2RY12 as depicted in (d) all lead to (e), reduced CAM interactions, increased capillary diameter and cerebral blood flow, and an impaired vasodilatory response to carbon dioxide (CO2).

References

    1. Magistretti PJ, Allaman I. A cellular perspective on brain energy metabolism and functional imaging. Neuron. 2015;86:883–901. doi: 10.1016/j.neuron.2015.03.035. - DOI - PubMed
    1. Belanger M, Allaman I, Magistretti PJ. Brain energy metabolism: focus on astrocyte-neuron metabolic cooperation. Cell Metab. 2011;14:724–738. doi: 10.1016/j.cmet.2011.08.016. - DOI - PubMed
    1. Aldana BI. Microglia-specific metabolic changes in neurodegeneration. J. Mol. Biol. 2019;431:1830–1842. doi: 10.1016/j.jmb.2019.03.006. - DOI - PubMed
    1. Blanchette M, Daneman R. Formation and maintenance of the BBB. Mech. Dev. 2015;138:8–16. doi: 10.1016/j.mod.2015.07.007. - DOI - PubMed
    1. Keaney J, Campbell M. The dynamic blood-brain barrier. FEBS J. 2015;282:4067–4079. doi: 10.1111/febs.13412. - DOI - PubMed

Publication types

MeSH terms

LinkOut - more resources