. 2021 Sep 6;12(1):5255.
doi: 10.1038/s41467-021-25616-1.

Brown adipose tissue monocytes support tissue expansion

Affiliations

Brown adipose tissue monocytes support tissue expansion

Alexandre Gallerand et al. Nat Commun. .

Abstract

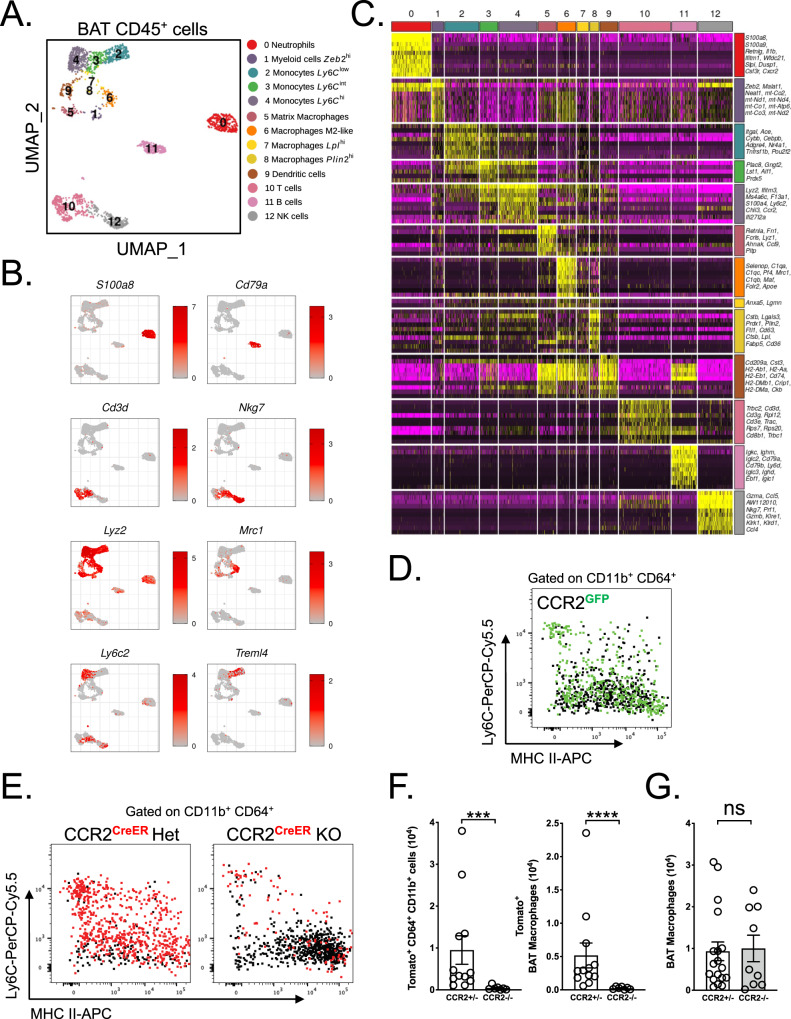
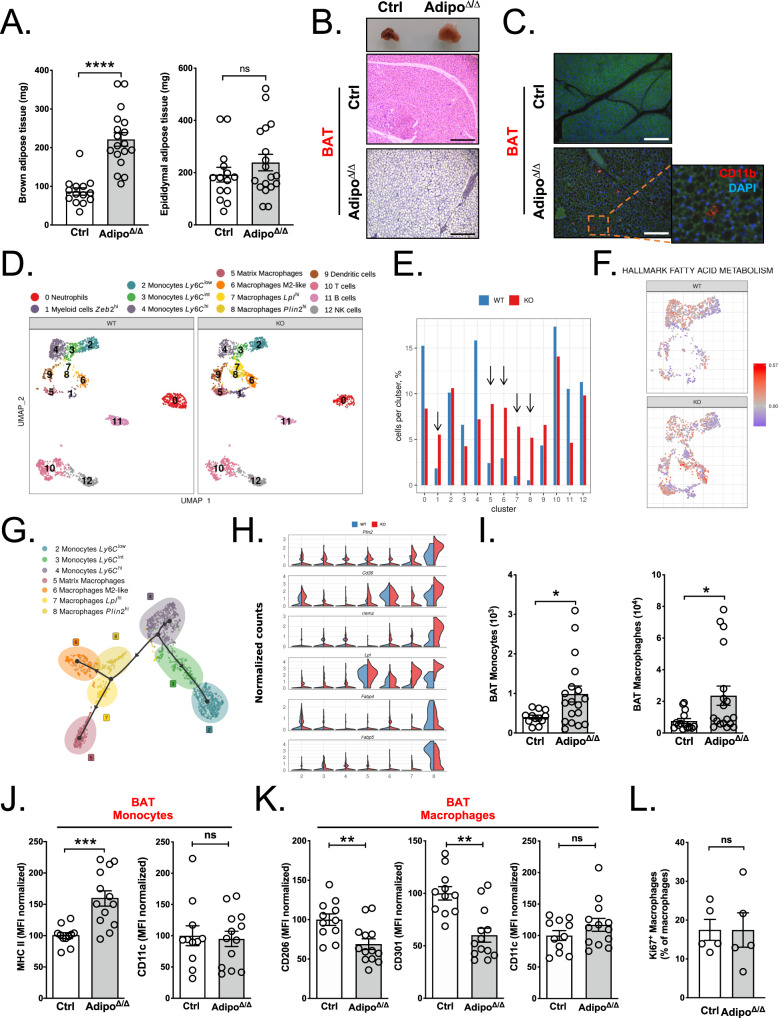
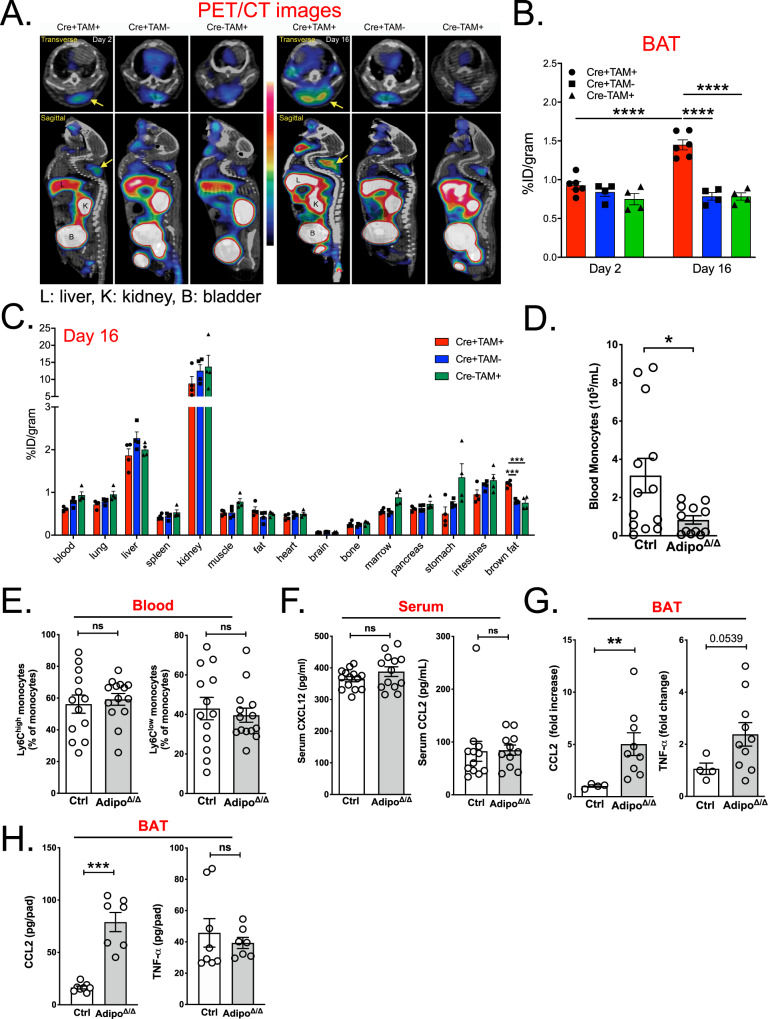
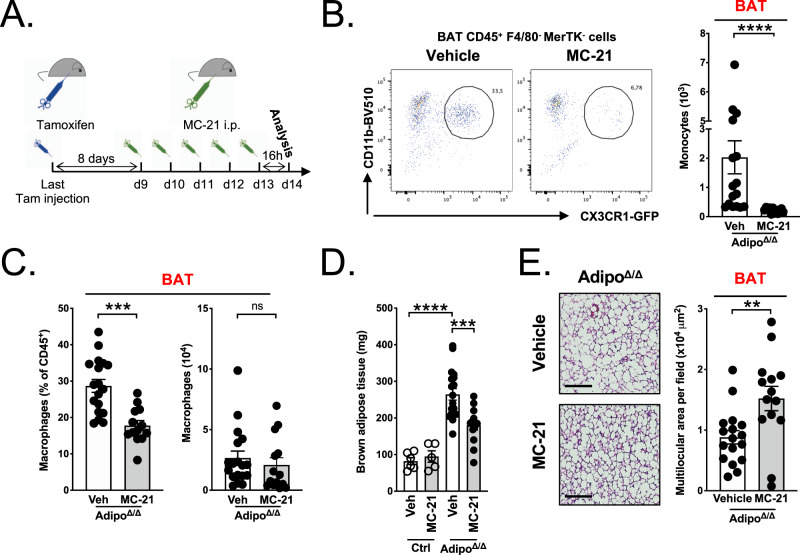
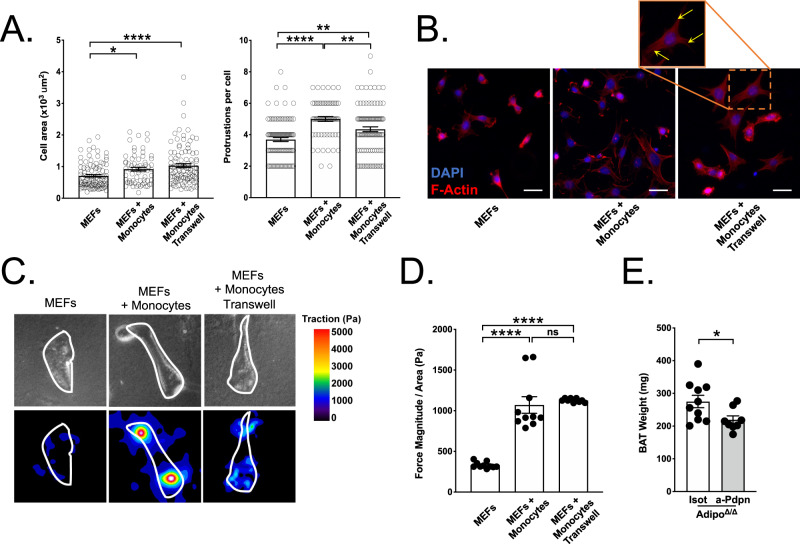
Monocytes are part of the mononuclear phagocytic system. Monocytes play a central role during inflammatory conditions and a better understanding of their dynamics might open therapeutic opportunities. In the present study, we focused on the characterization and impact of monocytes on brown adipose tissue (BAT) functions during tissue remodeling. Single-cell RNA sequencing analysis of BAT immune cells uncovered a large diversity in monocyte and macrophage populations. Fate-mapping experiments demonstrated that the BAT macrophage pool requires constant replenishment from monocytes. Using a genetic model of BAT expansion, we found that brown fat monocyte numbers were selectively increased in this scenario. This observation was confirmed using a CCR2-binding radiotracer and positron emission tomography. Importantly, in line with their tissue recruitment, blood monocyte counts were decreased while bone marrow hematopoiesis was not affected. Monocyte depletion prevented brown adipose tissue expansion and altered its architecture. Podoplanin engagement is strictly required for BAT expansion. Together, these data redefine the diversity of immune cells in the BAT and emphasize the role of monocyte recruitment for tissue remodeling.


Conflict of interest statement

The authors declare no competing interests.

Figures

Fig. 1
Fig. 1. Monocytes contribute to BAT macrophage pool at a steady state.
A Single-cell RNA-Seq analysis of BAT CD45+ cells from 7−8-week-old male mice. B UMAP representations of genes used to identify cell types among BAT CD45+ cells. C Heatmap showing normalized expression levels of marker genes helping to identify cell types present in the data. D Flow cytometry plot showing CCR2GFP expression among BAT Ly6C+/– MHCII+/– cells (gated on CD45+ CD11b+ CD64+ cells). E Flow cytometry plot showing TdTomato expression among BAT Ly6C+/– MHCII+/– cells (gated on CD45+ CD11b+ CD64+ cells) from CCR2creERT2/+ and CCR2creERT2/GFP mice 48 h after tamoxifen gavage. F Quantification of TdTomato+ cells among CD45+ CD64+ CD11b+ cells (p = 0.0002) and macrophages (CD45+ CD64+ CD11b+ Ly6C) (p < 0.0001) in the BAT of CCR2creERT2/+ (CCR2+/–, n = 12) and CCR2creERT2/GFP (CCR2–/–, n = 7) mice 48 h after tamoxifen gavage. G Quantification of macrophages in the BAT of CCR2+/– (n = 18) and CCR2–/– (n = 9) mice, p = 0.8997. Panels D, E, F, and G represent pooled data from two independent experiments. All data are represented in means ± SEM. Two-tailed Mann−Whitney tests were used to determine statistical significance. ns p > 0.05; *p < 0.05; **p < 0.01. Source data are provided as a Source Data file.
Fig. 2
Fig. 2. Monocytes and macrophages accumulate in the BAT during tissue expansion.
A BAT and EAT weight in control (n = 14) and Adipo∆/∆ (n = 18) mice. p < 0.0001 (left) and p = 0.4582 (right). B Representative images of BAT morphology and analysis using H&E staining in Adipo∆/∆ mice and controls. C CD11b staining (red) in the BAT of Adipo∆/∆ and control mice. The presence of CLS is highlighted in the magnified box. D Single-cell RNA-Seq analysis of BAT CD45+ cells from 7−8-week-old control and Adipo∆/∆ male mice. E Proportion of each cluster identified in scRNA-Seq analysis. F Single-cell RNA-Seq analysis of the “fatty acid metabolism” Hallmark gene set expression. G Differentiation model of BAT myeloid cells generated using the Slingshot tool. H Violin plots showing RNA-Seq analysis of Plin2, CD36, Trem2, Lpl, Fabp4, and Fabp5 expression by BAT macrophages and monocytes from Adipo∆/∆ and control mice. I Quantification of BAT monocyte and macrophage numbers in control (n = 12) and Adipo∆/∆ (n = 18) mice using flow cytometry. p = 0.0346 (left) and p = 0.0143 (right). J Quantification of surface MHC II and CD11c expression by BAT monocytes in control (n = 11) and Adipo∆/∆ (n = 13) mice using flow cytometry. p = 0.0004 (left) and p = 0.8646 (right). K Quantification of surface CD206, CD301, and CD11c expression by BAT macrophages in control (n = 11) and Adipo∆/∆ (n = 13) mice using flow cytometry. p = 0.0031 (left), p = 0.0012 (middle), p = 0.3607 (right). L Proportion of Ki-67-expressing macrophages in the BAT of control (n = 5) and Adipo∆/∆ (n = 5) mice analyzed by flow cytometry. p = 0,6905. Panels A, I, J, and K represent pooled data from four independent experiments. Panels B, C are representative of two independent experiments. Panel L represents data from one experiment. All data are represented in means ± SEM. Two-tailed Mann−Whitney tests were used to determine statistical significance. ns p > 0.05; *p < 0.05; **p < 0.01; ***p < 0.001; ****p < 0.0001. Source data are provided as a Source Data file.
Fig. 3
Fig. 3. Adipocyte ATGL deletion induces a specific recruitment of blood monocytes to the BAT.
A64Cu-DOTA-ECL1i PET/CT images analyzing tracer uptake in control and Adipo∆/∆ mice 2 days (left panel) and 16 days (right panel) post-tamoxifen administration (n = 4−6/group). L: liver; B: bladder; K: kidney. B Quantification of tracer uptake in the BAT of Cre tamoxifen-treated (Cre− Tam+, n = 4) and Cre+ vehicle-treated (Cre+ Tam−, n = 4) controls and Adipo∆/∆ animals (Cre+ Tam+, n = 6) 2- and 16-days post-tamoxifen administration. p < 0.0001 for each comparison. C Biodistribution of 64Cu-DOTA-ECL1i in Cre− Tam+ and Cre+ Tam-controls and Adipo∆/∆ animals 16 days post-tamoxifen administration (n = 4/group). p < 0,001 for each comparison in BAT. D Quantification of blood monocyte counts in control (n = 13) and Adipo∆/∆ (n = 12) mice using flow cytometry. p = 0.0384. E Proportions of Ly6Chigh and Ly6Clow monocytes among total blood monocytes in control (n = 13) and Adipo∆/∆ (n = 14) mice using flow cytometry. p = 0.6940 (left) and p = 0.6160 (right). F Analysis of serum CCL2 and CXCL12 in control (n = 14) and Adipo∆/∆ (n = 13) mice by ELISA. p = 0.2388 (left) and p = 0.3793 (right). G Analysis of BAT CCL2 and TNFα expression in control (n = 4) and Adipo∆/∆ (n = 9 and 10 respectively) mice by qPCR. p = 0.0028 (left) and p = 0.0539 (right). H Quantification of CCL2 and TNFa protein levels in BAT homogenates from control (n = 8) and Adipo∆/∆ (n = 7) mice by ELISA. p = 0.0003 (left) and p = 0.6126 (right). Panels D, E represent pooled data from four independent experiments. Panels F, G represent pooled data from two independent experiments. Panel H represents data from one experiment. All data are represented in means ± SEM. Ordinary one-way ANOVA with Bonferroni post-test were used to determine statistical significance in panels B, C. Two-tailed Mann−Whitney tests were used to determine statistical significance in panels DH. ns p > 0.05; *p < 0.05; **p < 0.01; ***p < 0.001; ****p < 0.0001. Source data are provided as a Source Data file.
Fig. 4
Fig. 4. Monocyte depletion prevents the expansion of lipolysis-deficient BAT.
A Schematic representation of the experimental procedure used for MC-21-mediated monocyte depletion. B Representative dot plots (left) and quantification (right) of BAT monocytes in MC-21 (n = 12) or vehicle-treated (n = 16) Adipo∆/∆ mice. p < 0.0001. C Frequency and numbers of BAT macrophages in MC-21 (n = 13) or vehicle-treated (n = 18) Adipo∆/∆ mice. p = 0.0001 (left) and p = 0.3189 (right). D Brown adipose tissue weight in MC-21 (n = 5) or vehicle-treated (n = 6) control mice, and MC-21 (n = 14) or vehicle-treated (n = 18) Adipo∆/∆ mice. p < 0.0001 (vehicle-treated control and Adipo∆/∆ mice) and p = 0,0002 (vehicle-treated and MC-21-treated Adipo∆/∆ mice). E Representative images of H&E-stained BAT and quantification of multilocular areas in MC-21 (n = 14) or vehicle-treated (n = 17) Adipo∆/∆ mice. Scale bar = 100 μm. p = 0.0053. Data were derived from three pooled independent experiments. All data are represented in means ± SEM. Two-tailed Mann−Whitney tests were used to determine statistical significance. ns p > 0.05; *p < 0.05; **p < 0,01; ***p < 0.001. Source data are provided as a Source Data file.
Fig. 5
Fig. 5. Monocyte interaction with fibroblasts through the Podoplanin axis is required for BAT expansion.
A Quantification of MEF morphological features after a 18 h co-culture experiment with monocytes placed in the same well or in a transwell insert with 0.4 μm pores. Each dot represents a cell. n = 101 (MEFs), 64 (MEFs + Monocytes) and 103 (MEFs + Monocytes Transwell) cells representative of three independent experiments. *: p = 0.0257, ****: p = <0.0001 (left). **: p < 0.01, ****: p < 0.0001(right). B Representative images of MEF morphology after a 18 h co-culture experiment with monocytes placed in the same well or in a transwell insert with 0.4 μm pores. F-actin was revealed using phalloidin staining. Yellow arrows indicate protrusions. Scale bar = 20 μm. Representative heat map (C) and quantification (D) showing contractile forces generate by MEFs plated on 8 kPa hydrogel after a 18 h co-culture experiment with monocytes placed in the same well or in a transwell insert with 0.4 μm pores. Mean of n = 10 wells per condition. ****: p < 0.0001. E Brown adipose tissue weight in anti-Podoplanin (n = 8) or isotype control-treated (n = 10) Adipo∆/∆ mice. p = 0.0363. Panels A, B are representative of three independent experiments. Panel D is representative of two independent experiments. Panel E represents pooled data from two independent experiments. All data are represented in means ± SEM. Ordinary one-way ANOVA with Bonferroni post-test were used to determine statistical significance in panels (A, D). A two-tailed Mann−Whitney test was used to determine statistical significance in panel (E). ns p > 0.05; *p < 0.05; **p < 0.01; ***p < 0.001. Source data are provided as a Source Data file.

Comment in

  • Monocytes involved in BAT expansion.
    Greenhill C. Greenhill C. Nat Rev Endocrinol. 2021 Dec;17(12):706. doi: 10.1038/s41574-021-00571-5. Nat Rev Endocrinol. 2021. PMID: 34545231 No abstract available.

References

    1. Guilliams M, et al. Dendritic cells, monocytes, and macrophages: a unified nomenclature based on ontogeny. Nat. Rev. Immunol. 2014;14:571–578. doi: 10.1038/nri3712. - DOI - PMC - PubMed
    1. Hettinger J, et al. Origin of monocytes and macrophages in a committed progenitor. Nat. Immunol. 2013;14:821–830. doi: 10.1038/ni.2638. - DOI - PubMed
    1. Yona S, et al. Fate mapping reveals origins and dynamics of monocytes and tissue macrophages under homeostasis. Immunity. 2013;38:79–91. doi: 10.1016/j.immuni.2012.12.001. - DOI - PMC - PubMed
    1. Chong SZ, et al. CXCR4 identifies transitional bone marrow premonocytes that replenish the mature monocyte pool for peripheral responses. J. Exp. Med. 2016;213:2293–2314. doi: 10.1084/jem.20160800. - DOI - PMC - PubMed
    1. Tsou CL, et al. Critical roles for CCR2 and MCP-3 in monocyte mobilization from bone marrow and recruitment to inflammatory sites. J. Clin. Invest. 2007;117:902–909. doi: 10.1172/JCI29919. - DOI - PMC - PubMed

Publication types