. 2021 Sep 6;12(1):5293.
doi: 10.1038/s41467-021-25599-z.

Spectroscopic glimpses of the transition state of ATP hydrolysis trapped in a bacterial DnaB helicase

Affiliations

Spectroscopic glimpses of the transition state of ATP hydrolysis trapped in a bacterial DnaB helicase

Alexander A Malär et al. Nat Commun. .

Abstract

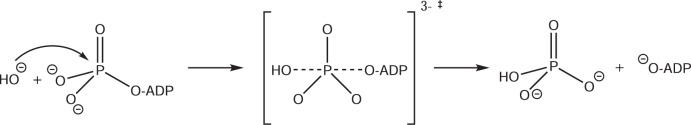
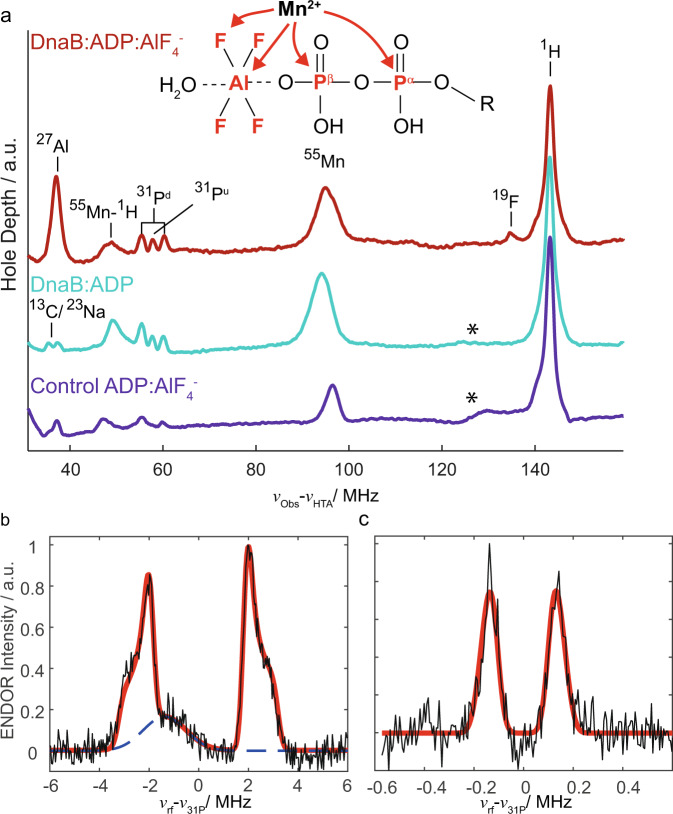
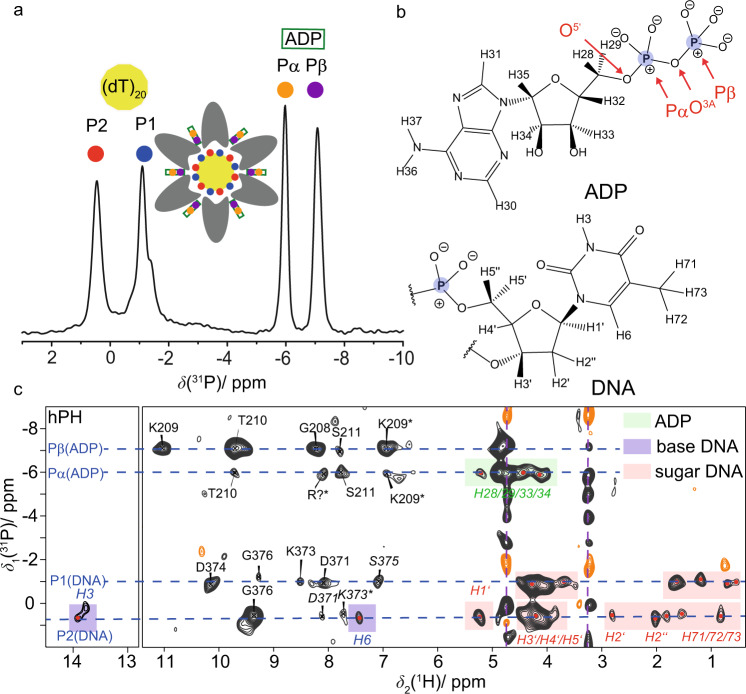
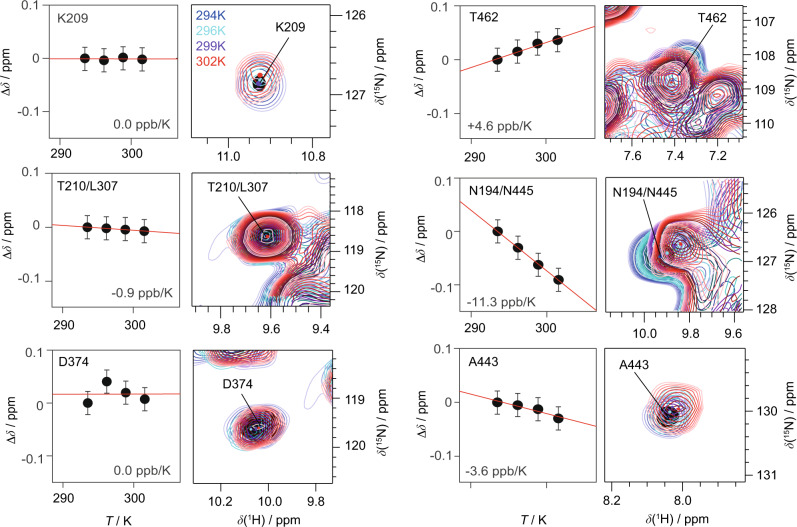
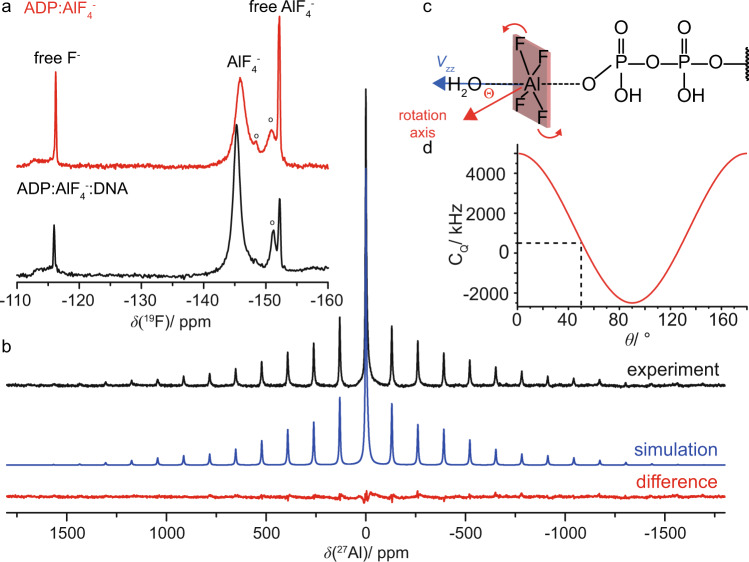
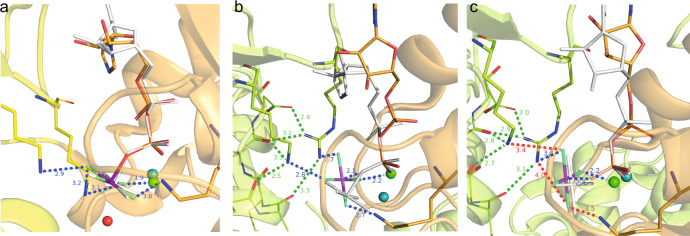
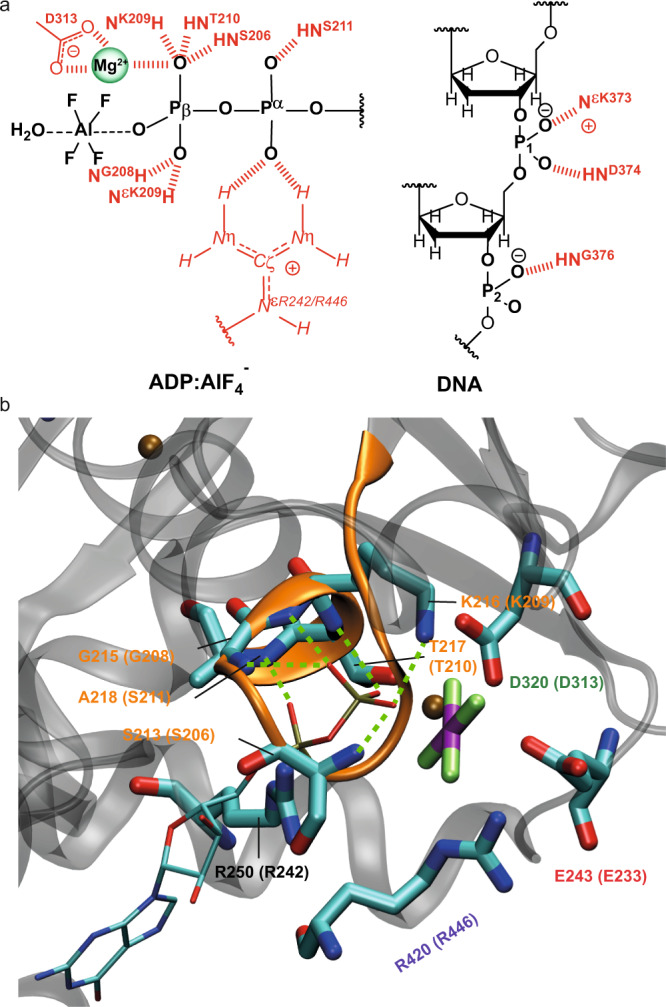
The ATP hydrolysis transition state of motor proteins is a weakly populated protein state that can be stabilized and investigated by replacing ATP with chemical mimics. We present atomic-level structural and dynamic insights on a state created by ADP aluminum fluoride binding to the bacterial DnaB helicase from Helicobacter pylori. We determined the positioning of the metal ion cofactor within the active site using electron paramagnetic resonance, and identified the protein protons coordinating to the phosphate groups of ADP and DNA using proton-detected 31P,1H solid-state nuclear magnetic resonance spectroscopy at fast magic-angle spinning > 100 kHz, as well as temperature-dependent proton chemical-shift values to prove their engagements in hydrogen bonds. 19F and 27Al MAS NMR spectra reveal a highly mobile, fast-rotating aluminum fluoride unit pointing to the capture of a late ATP hydrolysis transition state in which the phosphoryl unit is already detached from the arginine and lysine fingers.


Conflict of interest statement

The authors declare no competing interests.

Figures

Fig. 1
Fig. 1. Sketch of the associative ATP hydrolysis mechanism with a trigonal-bipyramidal transition state.
‡ indicates the transition state.
Fig. 2
Fig. 2. EPR characterizes binding of the metal ion co-factor and ADP:AlF4 to DnaB.
a EDNMR highlighting hyperfine couplings and thus proximities between the Mn2+ metal center and surrounding nuclei measured for DnaB:ADP:AlF4 (red) and DnaB:ADP (cyan), as well as for a control solution containing only Mn2+:ADP:AlF4 in the same buffer used for the protein sample (purple). The assignments of the peaks to the nuclear resonance frequencies are shown. The cyan spectrum is reproduced from ref. . Asterisks mark a broad, currently unassigned feature that is possibly due to Mn double quantum or combination lines. 31P Davies ENDOR (b) and Mims ENDOR (c) recorded on DnaB:ADP:AlF4. The red lines represent line shape simulations using EasySpin based on Aiso-values of 0.3 and 4.7 MHz (for all parameters see Supplementary Table 1). The broad background peak in (b) is most likely a third harmonic of one of the Mn2+ hyperfine lines and was removed for fitting.
Fig. 3
Fig. 3. ADP and DNA recognition in DnaB highlighted by phosphorus-proton contacts identified at fast MAS.
a1H → 31P (hP) CP-MAS spectrum of DnaB:ADP:AlF4:DNA adapted from ref. (http://creativecommons.org/licenses/by/4.0/) showing the resonance assignments of the DNA and ADP phosphate groups. The shoulder in the 31P resonance at ~−1.4 ppm possibly results from rigidified DNA nucleotides, which are, however, not coordinating to DnaB. b Chemical structures of ADP and DNA (thymidine) molecules including the numbering of proton atoms following the convention of the BMRB database (DNA) and the recent IUPAC recommendations for nucleoside phosphates. Phosphorus atoms are highlighted in blue. c CP-based hPH correlation spectrum (CP contact time 3 ms) recorded on DnaB in complex with ADP:AlF4 and DNA at 20.0 T external magnetic field and 105 kHz MAS. The protein resonance assignment is taken from ref. (BMRB accession code 27879). Regular-printed residue labels: Chemical-shift deviation to reported proton shifts <0.05 ppm. Italic-printed residue labels: Chemical-shift deviation to assigned proton shifts ≥0.05 ppm. All proton shifts are assigned to amide backbones, except the ones indicated by an asterisk, which are associated to sidechain atoms. Correlations between the phosphate groups and ADP or DNA are highlighted in green and light red/purple, respectively. The assignments of the DNA proton resonances are based on average chemical-shift values reported in the BMRB database (www.bmrb.wisc.edu). The pink dashed lines highlight signals from insufficiently suppressed DNA in solution.
Fig. 4
Fig. 4. Temperature-dependent proton chemical-shift values as indicators for hydrogen-bond formation.
Residue-specific temperature coefficients and corresponding temperature-dependent hNH spectra (based on two 1H,15N CP steps) recorded at 20.0 T with a spinning frequency of 100 kHz for deuterated and 100% back-exchanged DnaB complexed with ADP:AlF4 and DNA. Temperature-dependent chemical-shift deviations (black circles) are referenced to the corresponding value at 294 K sample temperature. Chemical-shift values were extracted from n = 1 experiments and are represented as δ ± 0.05 ppm, where the shown error bar represents an estimate of the expected uncertainty within such experiments.
Fig. 5
Fig. 5. The AlF4 species bound to DnaB is rotating.
a19F MAS-NMR spectra recorded at 14.0 T with a MAS frequency of 17.0 kHz and with the EASY background suppression scheme. Spectra were acquired on DnaB:ADP:AlF4 in the presence and absence of DNA; “o” indicates precipitated AlFx(OH)6-x species. b 27Al MAS-NMR spectrum of DnaB:ADP:AlF4:DNA recorded at 11.74 T with a spinning frequency of 17.0 kHz (black) and corresponding line shape simulation using DMFIT (version 2019) assuming CQ(27Al) = 570 kHz, ηQ(27Al) = 0.98, Δσ(27Al) = −186 ppm and ησ(27Al) = 0.64. The central resonance is fitted with two additional Lorentzian lines possibly originating from aluminum hydroxyl fluorides in solution. The difference spectrum is shown in red. c Schematic illustration of the rotation of the AlF4 molecule. θ describes the angle between the rotation axis and the principal component (Vzz) of the 27Al electric field gradient pointing along the OAlO axis. d Calculation of the effective 27Al quadrupolar coupling constant according to CQ=CQ(static)123cos2θ1, assuming a static CQ value of 5 MHz (AlF4O2 species in AlFx(OH)3-x ·H2O as taken from reference ). Fast rotation of the AlF4 unit on the NMR time scale is assumed in this calculation.
Fig. 6
Fig. 6. The transition-state analogue AlF4 can adopt different orientations in diverse P-loop ATPases of the ASCE division.
a AlF4 binding in RecA from E. coli (PDB accession code 3CMW). The P-loop domain (NBD domain) is shown in orange, the NBD domain of the adjacent activating subunit that provides the stimulating “fingers” is colored yellow. The magnesium ion is shown as a green sphere. To show the catalytic water molecule H2Ocat, the ADP:AlF4 complex is superimposed with the structure of the ADP:AlF4:H2Ocat complex from the ABC ATPase of the maltose transporter MalK (see PDB accession code 3PUW). The ADP molecule and AlF4 of MalK are shown in white, H2Ocat as a red sphere, Mg2+ as a teal sphere. ADP moieties were superimposed using atoms O3A, PB and O3B (see Fig. 3b for the atom notation used for ADP) in Pymol. b Coordination of AlF4 in the BstDnaB structure (see Supplementary Fig. 10, PDB ID 4ESV and ref. ). The orange, nucleotide-binding chain and the green activating chain correspond to the chains C and B of the 4ESV. To show the displacement of AlF4, the GDP:AlF4 complex is superimposed, as described for panel a, with ADP:AlF4 bound to the RecA protein (PDB ID 3CMW, see panel a). The H-bonds formed by AlF4 are shown in blue, the additional interactions that stabilize the position of stimulating sidechains of K418 and R420 are shown in green. The AlF4 moiety is twisted in comparison to the transition-state-mimicking complex shown on panel a. c Coordination of AlF4 in the structure of BstDnaB (see Supplementary Fig. 10, PDB ID 4ESV). The orange, nucleotide-binding chain and the green activating chain correspond to the chains F and E of the 4ESV PDB structure. To show the further displacement of AlF4, the GDP:AlF4 complex of subunit F is superimposed, as described for panel a, with the same complex bound to subunit C of the 4ESV PDB structure, which is white coloured (see panel b). Bonding interactions that are observed for the GDP:AlF4 complex trapped at the B/C interface (see panel b), but not in this complex trapped at the E/F interface are shown as red dashed lines.
Fig. 7
Fig. 7. Comprehensive model for molecular recognition events involved in ADP and DNA binding to DnaB as obtained from the herein presented EPR/NMR results.
a Sketch of hydrogen-bond formation and spatial proximities as revealed by the hPH and chemical-shift temperature-dependence experiments for ADP and DNA coordination to HpDnaB. The Mg2+ co-factor has been placed in spatial proximity to the AlF4 unit supported by the results from the EDNMR spectra (the coordinating aspartate located in the Walker B motif is shown additionally). b Zoom into the nucleotide-binding domain for BstDnaB:GDP:AlF4:DNA (PDB accession code 4ESV). Residues given in brackets correspond to those in HpDnaB. Green lines represent hydrogen bonds or spatial proximities as identified from the hPH correlation experiments.

References

    1. Anatoly BK. Motor proteins and molecular motors: how to operate machines at the nanoscale. J. Phys. Condens. Matter. 2013;25:463101. doi: 10.1088/0953-8984/25/46/463101. - DOI - PMC - PubMed
    1. Spies, M. DNA Helicases and DNA Motor Proteins (Springer, 2012).
    1. Bagshaw CR. ATP analogues at a glance. J. Cell Sci. 2001;114:459–460. doi: 10.1242/jcs.114.3.459. - DOI - PubMed
    1. Wiegand T. A solid-state NMR tool box for the investigation of ATP-fueled protein engines. Prog. Nucl. Magn. Reson. Spectrosc. 2020;117:1–32. doi: 10.1016/j.pnmrs.2020.02.001. - DOI - PubMed
    1. Ma W, Schulten K. Mechanism of substrate translocation by a ring-shaped ATPase motor at millisecond resolution. J. Am. Chem. Soc. 2015;137:3031–3040. doi: 10.1021/ja512605w. - DOI - PMC - PubMed

Publication types

MeSH terms