. 2021 Sep 6;12(1):5307.
doi: 10.1038/s41467-021-25624-1.

Single-cell ATAC and RNA sequencing reveal pre-existing and persistent cells associated with prostate cancer relapse

Affiliations

Single-cell ATAC and RNA sequencing reveal pre-existing and persistent cells associated with prostate cancer relapse

S Taavitsainen et al. Nat Commun. .

Abstract

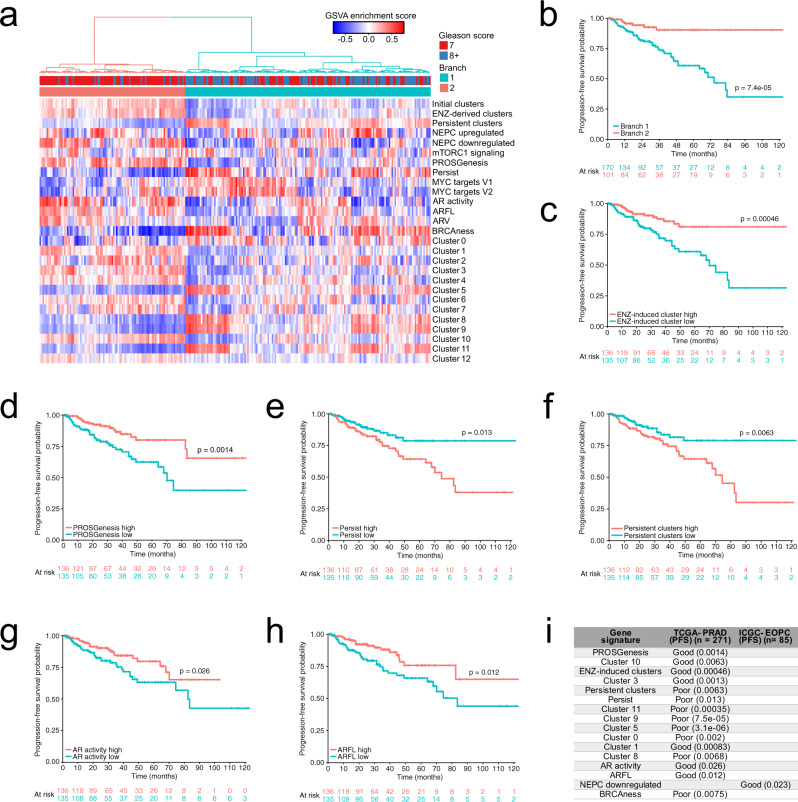
Prostate cancer is heterogeneous and patients would benefit from methods that stratify those who are likely to respond to systemic therapy. Here, we employ single-cell assays for transposase-accessible chromatin (ATAC) and RNA sequencing in models of early treatment response and resistance to enzalutamide. In doing so, we identify pre-existing and treatment-persistent cell subpopulations that possess regenerative potential when subjected to treatment. We find distinct chromatin landscapes associated with enzalutamide treatment and resistance that are linked to alternative transcriptional programs. Transcriptional profiles characteristic of persistent cells are able to stratify the treatment response of patients. Ultimately, we show that defining changes in chromatin and gene expression in single-cell populations from pre-clinical models can reveal as yet unrecognized molecular predictors of treatment response. This suggests that the application of single-cell methods with high analytical resolution in pre-clinical models may powerfully inform clinical decision-making.


Conflict of interest statement

GA receives a reward from the Institute of Cancer Research for his role as an inventor of abiraterone. GA has received honoraria, consulting fees, or travel support from Janssen, Astellas, Pfizer, Novartis, Bayer, Amgen, AstraZeneca, Sanofi, and Sapience, grant support from Janssen and Astellas, and is a principal investigator for clinical trials sponsored by Janssen, Pfizer, and Astellas. TM receives consultant fees from Astellas, Janssen, and Bayer; lecture fees from Novartis, Janssen, and Sanofi. He is a stockholder of Arocell ab. The remaining authors declare no competing interests.

Figures

Fig. 1
Fig. 1. Chromatin reprogramming in enzalutamide resistance.
a Overview of the cell-line models, assays, and treatments included in the study. Boxes with sample names are colored according to the data types generated from the sample (single-cell (sc) assay for transposase-accessible chromatin (ATAC)-, scRNA-, bulk RNA- and/or formaldehyde-assisted isolation of regulatory element (FAIRE) sequencing). b Smoothed line plots of LNCaP parental, LNCaP–ENZ48, RES-A, and RES-B scATAC-seq enrichment scores in a 2-kb window around the transcription-start sites (TSS) of 5000 randomly selected genes, housekeeping genes, androgen response genes (MSigDB), and MYC target genes (MSigDB). Enrichment scores at each TSS (position 0 in the plot marked with a black dashed line) were used as the enrichment values and compared between pairs of samples. Sample comparisons are indicated using colored dots and the two-sided Wilcoxon rank-sum p-values are shown within the plots. c Venn diagram of shared and unique chromatin regions in LNCaP parental, LNCaP-ENZ48, RES-A, and RES-B based on a bulk analysis of scATAC-seq. d Uniform manifold approximation and projection (UMAP) scATAC-seq clustering visualization of LNCaP parental, LNCaP–ENZ48, RES-A, and RES-B. e Proportions of cells in the scATAC-seq clusters. Clusters are colored according to cluster type: initial (most prevalent in LNCaP parental and LNCaP–ENZ48), ENZ-induced (most prevalent in RES-A or RES-B), or persistent (present at similar proportions in all samples). ENZ = enzalutamide, DHT = dihydrotestosterone, BIC = bicalutamide, CRPC = castration-resistant prostate cancer. See also Supplementary Fig. 1.
Fig. 2
Fig. 2. Contribution of enzalutamide treatment-mediated chromatin reprogramming to transcription factor DNA motif footprint.
a, b Normalized average formaldehyde-assisted isolation of regulatory element (FAIRE)-seq read distribution in androgen-deprived conditions within a 2-kb interval around a MYC-binding sites and b AR-binding sites in LNCaP cells. Sample comparisons of enrichment values at the middle of the distribution are indicated using colored dots within the plots and the two-sided t-test p-value is shown. c Prostate cancer-associated transcription factor (TF) motif enrichment in open differentially accessible regions (DARs) for each single-cell ATAC-seq sample. Enrichments with a Benjamini–Hochberg method-adjusted hypergeometric test p-value < 0.05 are shown in colors, while nonsignificant (ns) enrichments are shown in white. The barplots above the matrices indicate the number of open DARs found for each cluster in each sample. d TF motif enrichments in open DARs observed comparing the indicated conditions. Enrichments with a Benjamini–Hochberg method-adjusted hypergeometric test p-value < 0.05 are shown in colors, while nonsignificant (ns) enrichments are shown in white. See also Supplementary Fig. 2.
Fig. 3
Fig. 3. Chromatin states of enzalutamide resistance can result in multiple transcriptional programs.
a Uniform manifold approximation and projection (UMAP) clustering visualization of single-cell RNA sequencing (scRNA-seq) of LNCaP parental, LNCaP–ENZ48, RES-A, and RES-B. b Proportions of cells in clusters identified from scRNA-seq. Clusters are colored according to cluster type: initial (most prevalent in LNCaP parental and LNCaP–ENZ48), ENZ-induced (most prevalent in RES-A or RES-B), or persistent (present in similar proportions in all samples). c Cluster-label transfer from the integrated clustering of the LNCaP scRNA-seq data to VCaP parental (left) and VCaP treated with enzalutamide for 48 h (right), confirming the presence of these cell states in the alternate model. In the UMAP, each cell is colored according to the LNCaP scRNA-seq cluster that it is predicted to belong to. The barplot shows the proportion of the projected cluster labels for each scRNA-seq cluster. d Proportion of differentially expressed genes (DEGs) in each LNCaP scRNA-seq cluster for the indicated sample comparisons that is composed of enriched transcription-factor (TF) target genes. The contributions of enriched TFs identified in the scATAC-seq are shown as a stacked barplot. e Identification of matching cell clusters between the scRNA- and scATAC-seq data from LNCaP visualized as heatmap. The heatmap shows the proportions of cells from each scATAC-seq cluster across all sample conditions assigned to each scRNA-seq cluster as part of the label-transfer process. The proportions were calculated for each scATAC-seq cluster, with the total as the number of cells from the scATAC-seq that could be confidently assigned to a scRNA-seq cluster (confidence score > 0.3). ENZ = enzalutamide. See also Supplementary Fig. 3.
Fig. 4
Fig. 4. Transcriptional states in enzalutamide resistance.
a Average expression of cell cycle-related genes (S- and G2/M phases) in cells from the single-cell (sc) RNA-seq data. b, c Dot plot of average gene expression of the b indicated genes and of the c genes within the Persist signature in each scRNA-seq cluster. The size of the dot reflects the percentage of cells in the cluster that express each gene. d Uniform manifold approximation and projection (UMAP) visualization showing the average expression score of each cell for the genes in the PROSGenesis gene signature derived from Karthaus et al.. e Cells in VCaP and VCaP–ENZ48 (enzalutamide treated for 48 h) scored for their expression of Persist and PROSGenesis gene signatures. f Boxplots of predicted cluster-differentiation states in the four LNCaP scRNA-seq samples based on cytoTRACE. Each cell is visualized as a point within its scRNA-seq cluster. Clusters are ordered from left to right in order of decreasing predicted differentiation potential. The scRNA-seq clusters are labeled with numbers. The boxplots show the 25th percentile, median, and 75th percentile, with the whiskers indicating the minimum and maximum values within the 1.5x interquartile range. The two-sided Wilcoxon rank sum test was used to assess for differences in average cluster cytoTRACE scores and p-values are shown within the figure (n = 111, 106, 122, and 126 for cluster-11 cells in LNCaP, LNCaP-ENZ48, RES-A, and RES-B; n = 127, 160, 379, and 226 for cluster-9 cells in LNCaP, LNCaP-ENZ48, RES-A, and RES-B; and n = 135, 451 for cluster-8 cells in LNCaP–ENZ48 and RES-A). g RNA velocities based on scRNA-seq depicted as streamlines. Clusters are shown in different colors and are numbered. ENZ = enzalutamide. See also Supplementary Fig. 4.
Fig. 5
Fig. 5. Gene signatures derived from single-cell RNA sequencing capture important features of prostate cancer models and stratify patients with advanced disease.
a Heatmap of single-cell gene signature gene set variation analysis (GSVA) enrichment scores in bulk RNA-sequencing of LNCaP treated with dihydrotestosterone (DHT) or enzalutamide (ENZ), and either sensitive or resistant to ENZ. b Heatmap of gene signature GSVA enrichment scores in bulk RNA sequencing from VCaP subline derivatives VCaP-T (long-term cultured with 10 µM testosterone), VCaP-CT (VCaP-T long term cultured with 0.1 nM testosterone), VCaP-CT-ET (VCaP-CT cultured long-term with 10 µM ENZ), VCaP-CT-BR (VCaP-CT cultured long term with bicalutamide), and VCaP-CT-BR-ER (VCaP-CT-BR long-term treated with ENZ upon reaching bicalutamide insensitivity). c Kaplan–Meier progression-free survival curves for Alumkal et al. patients stratified into two groups based on median GSVA score for the Persist gene signature. The two-sided log-rank p-value is shown above the curves. d Kaplan–Meier progression-free survival curves for Alumkal et al. patients stratified into two groups based on median GSVA score for the NEPC-upregulated gene signature. The two-sided log-rank p-value is shown above the curves. e Kaplan–Meier overall survival curve for abiraterone (ABI)- and ENZ-naive patients from the Stand Up 2 Cancer (SU2C) CRPC cohort stratified into two groups based on median GSVA score for the Persist gene signature. The two-sided log-rank p-value is shown above the curve. f Summary table of gene signature GSVA score associations with progression-free survival (PFS) or overall survival (OS) in the clinical datasets. Only gene signatures significantly associated with PFS or OS in one or more datasets are shown. Good indicates that a higher score for the signature (a score higher than the median) is associated with better survival outcome, while poor indicates that a higher signature score is associated with worse survival outcome. Two-sided log-rank p-values are shown in parentheses. For each dataset, the header indicates the number of samples included, along with other qualifying information of the dataset. We used ABI/ENZ-naive patients from the capture-based SU2C CRPC RNA-seq dataset. See also Supplementary Fig. 5.
Fig. 6
Fig. 6. Transcriptional signal enrichment analysis identifies treatment-persistent cells in prostate cancer.
at-Distributed stochastic neighbor embedding (tSNE) visualization of cell types from 13 treatment-naive prostate tumors from Chen et al.. b Gene set variation analysis (GSVA) enrichment scores for gene signatures in luminal, basal/intermediate, and fibroblast cells from Chen et al. GSVA enrichment scores were generated from the average expression profile of each cell type. c-d tSNE plot of prostate tumor cells from Chen et al. colored according to their average expression of the genes in c the Persist signature and d the PROSGenesis signature. The adjacent histograms show the distribution of average expression scores in the cells, with a red dashed line marking the 90th percentile of scores. e Percentage of cells scoring at or above the 90th percentile for the Persist and PROSGenesis signatures belonging to each prostate tumor from Chen et al. fh Spatial transcriptomics (ST) from a prostate cancer tissue section, Prostate A. f The left panel shows the hematoxylin and eosin (H&E) staining of the tissue section. In the middle, the uniform manifold approximation and projection (UMAP) visualization shows the clusters of spots on the ST slide. Each cluster is labeled according to its histological tissue type, with BE referring to benign epithelium. The right panel shows the UMAP clusters of spots overlaid on the H&E slide. g Sensitivity analysis of Persist and PROSGenesis signatures scores in ST against the score distributions of control housekeeping gene signatures (see “Methods”). h The leftmost panel shows the ST UMAP clusters of spots overlaid on the H&E slide. Each spot was scored according to its expression of genes in the Persist, PROSGenesis, and cluster-10 signatures. For each signature, spots scoring at or above the 90th percentile (high) are colored in red, while spots scoring below the 90th percentile (low) are colored in yellow. The barplots indicate the percentage of spots in each cluster scoring high or low for each signature. The bars are labeled with the cluster histology and the cluster number in parentheses, with BE referring to benign epithelium. Differences in proportions of high-scoring spots between clusters were tested with the chi-square test. See also Supplementary Fig. 6.
Fig. 7
Fig. 7. Transcriptional signals from persistent prostate cancer cells can be used to stratify untreated patients.
a Heatmap of gene set variation analysis (GSVA) enrichment scores for all single-cell (sc)-derived gene signatures in the TCGA-PRAD cohort, including the marker gene sets for each scRNA-seq cluster. Hierarchical clustering of the GSVA scores was used to separate the samples into two groups, labeled Branch 1 and Branch 2. b Kaplan–Meier survival curve for TCGA–PRAD patients stratified into two groups as indicated in panel a. The two-sided log-rank p-value is shown within the plot. ch Kaplan–Meier survival curves for TCGA–PRAD patients stratified into two groups based on median GSVA score for ENZ-induced cluster, PROSGenesis, Persist, persistent cluster, AR activity, and ARFL gene signatures. In each plot, the two-sided log-rank p-value is indicated above the plotted curves. i Summary table of gene signature GSVA score associations with progression-free survival (PFS) in the TCGA–PRAD and ICGC–EOPC datasets. Only gene signatures significantly associated with PFS in one or both datasets are shown. Good indicates that a higher score for the signature (a score higher than the median) is associated with better survival outcome, while poor indicates that a higher signature score is associated with worse survival outcome. Two-sided log-rank p-values are shown in parentheses. For each dataset, the header indicates the number of samples included. ENZ = enzalutamide, NEPC = neuroendocrine prostate cancer. See also Supplementary Fig. 7.

References

    1. Beltran H, et al. Divergent clonal evolution of castration-resistant neuroendocrine prostate cancer. Nat. Med. 2016;22:298–305. doi: 10.1038/nm.4045. - DOI - PMC - PubMed
    1. Alumkal JJ, et al. Transcriptional profiling identifies an androgen receptor activity-low, stemness program associated with enzalutamide resistance. Proc. Natl Acad. Sci. USA. 2020;117:12315–12323. doi: 10.1073/pnas.1922207117. - DOI - PMC - PubMed
    1. He Y, et al. Androgen receptor splice variants bind to constitutively open chromatin and promote abiraterone-resistant growth of prostate cancer. Nucleic Acids Res. 2018;46:1895–1911. doi: 10.1093/nar/gkx1306. - DOI - PMC - PubMed
    1. Devlies, W. et al. Clinical actionability of the genomic landscape of metastatic castration resistant prostate cancer. Cells9, 2494 (2020). - PMC - PubMed
    1. Abida W, et al. Genomic correlates of clinical outcome in advanced prostate cancer. Proc. Natl Acad. Sci. USA. 2019;116:11428–11436. doi: 10.1073/pnas.1902651116. - DOI - PMC - PubMed

Publication types

MeSH terms