. 2021 Sep 6;12(1):5253.
doi: 10.1038/s41467-021-25614-3.

A functional genomics pipeline identifies pleiotropy and cross-tissue effects within obesity-associated GWAS loci

Affiliations

A functional genomics pipeline identifies pleiotropy and cross-tissue effects within obesity-associated GWAS loci

Amelia C Joslin et al. Nat Commun. .

Abstract

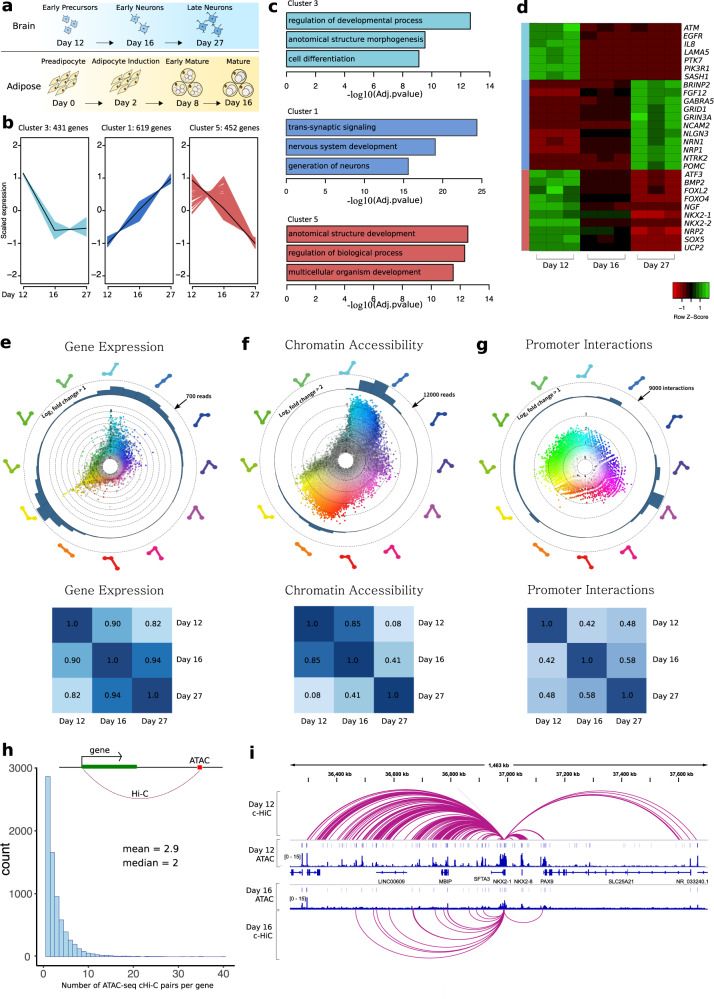
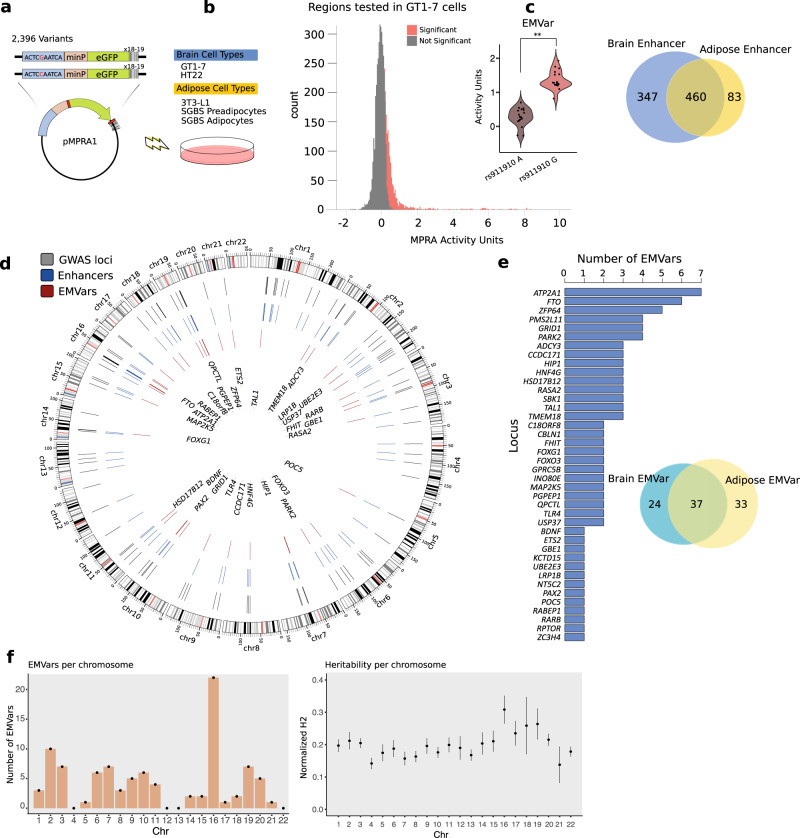
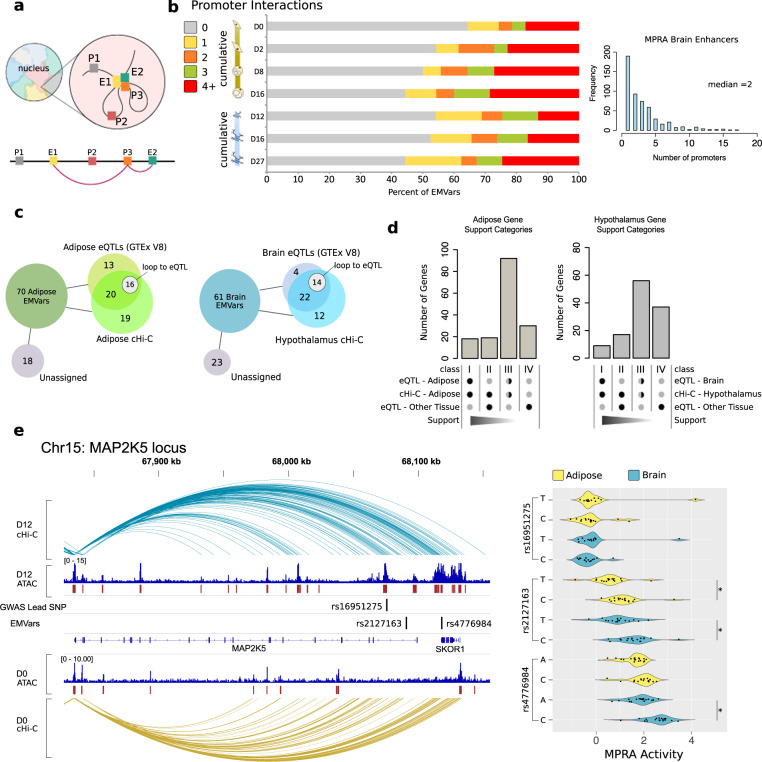
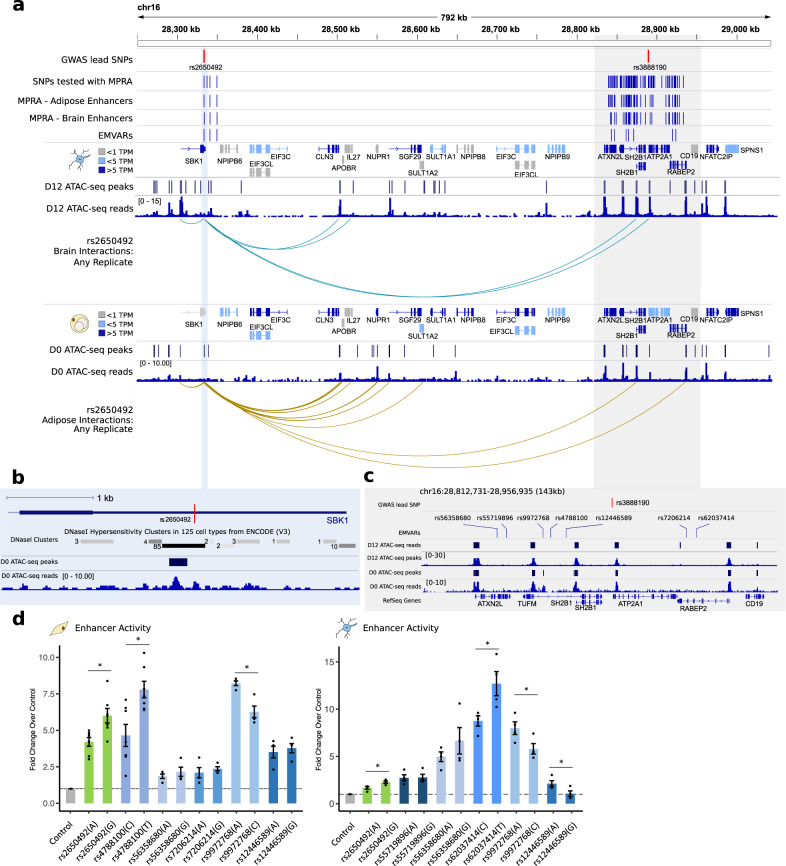
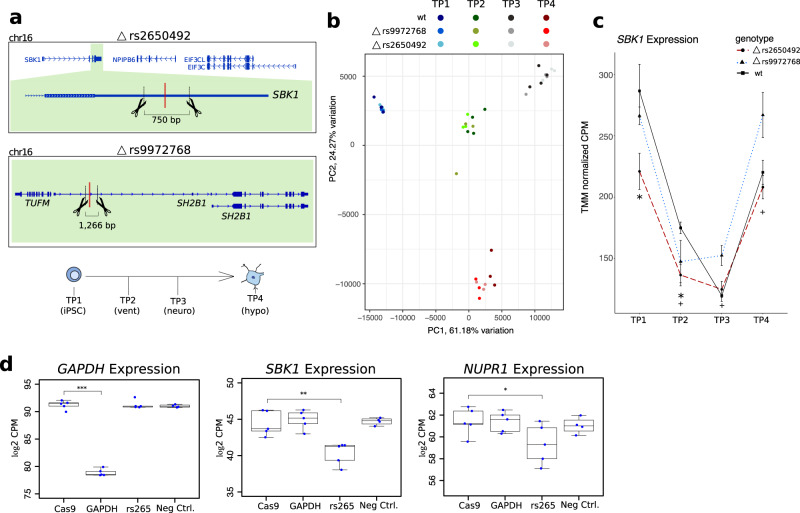
Genome-wide association studies (GWAS) have identified many disease-associated variants, yet mechanisms underlying these associations remain unclear. To understand obesity-associated variants, we generate gene regulatory annotations in adipocytes and hypothalamic neurons across cellular differentiation stages. We then test variants in 97 obesity-associated loci using a massively parallel reporter assay and identify putatively causal variants that display cell type specific or cross-tissue enhancer-modulating properties. Integrating these variants with gene regulatory information suggests genes that underlie obesity GWAS associations. We also investigate a complex genomic interval on 16p11.2 where two independent loci exhibit megabase-range, cross-locus chromatin interactions. We demonstrate that variants within these two loci regulate a shared gene set. Together, our data support a model where GWAS loci contain variants that alter enhancer activity across tissues, potentially with temporally restricted effects, to impact the expression of multiple genes. This complex model has broad implications for ongoing efforts to understand GWAS.


Conflict of interest statement

A.C.J. is an employee of Maze Therapeutics. The remaining authors declare no competing interests.

Figures

Fig. 1
Fig. 1. Characterizing hypothalamic differentiation using genomic annotations.
a Time points for data collection. b Hypothalamic DEGs were grouped via fuzzy-c clustering and the top three clusters with the highest membership are illustrated. The number of genes in each cluster and scaled expression across the four differentiation time points are shown on each graph. c Significant Gene Ontology (GO) terms for the top three clusters. (Fisher’s Exact Test; FDR adjusted p values are presented). d A heatmap of gene expression depicting genes from each of the top three clusters that are members of the enriched GO terms. The leftmost colored bar indicates cluster membership and the columns are RNA-seq replicates. eg HSV transformation of gene expression dynamics, ATAC-seq accessibility, and cHi–C interactions across differentiation. Each significant data point is categorized and colored based on the temporal pattern it displays shown by the guides on the periphery of each plot. The three nodes of each pattern represent day 12, day 16, and day 27 of neuronal differentiation. The distance of each point from the center of the circle represents maximum log2 fold change, and color transparency represents the relative number of reads for that data point. Below, heatmaps of Pearson’s r correlation coefficients estimate the overall similarity between time points. h On average, a promoter interacts with 2–3 ATAC-seq peaks via a c-HiC interaction across time (interactions and ATAC peaks were not required to be significant at the same time point) n = 7382 data points included. i View of significant cHi–C interactions emanating from the promoter of the NKX2-1 gene, which is downregulated between differentiation days 12–16. ATAC-seq reads and significant ATAC-seq peaks at day 12 and day 16 are also shown.
Fig. 2
Fig. 2. MPRA identifies enhancers and functional variants in obesity GWAS loci.
a Variants were synthesized adjacent to 18–19 unique 10 bp DNA barcodes and cloned into the pMPRA1 vector. Constructs were transfected into five cell lines from the adipose and brain lineages (see Methods). b Average MPRA activity across the five replicates is shown for all tested regions in GT1–7 libraries. Significant GT1–7 enhancers (q< 0.05; one-sided Mann–Whitney U test) are colored red. An SNP was considered an EMVar if the variant significantly affected MPRA enhancer activity levels (**q = 4.2e−08; two-sided Mann–Whitney U test. c Venn diagram of MPRA enhancers significant in either cell type. d Circos plot of MPRA results. Grey lines within the circle represent the locations of GWAS associations, blue lines represent the locations of MPRA identified enhancers, and the red lines represent identified MPRA EMVars. Locus gene names (closest gene) are shown in the center. e Bar chart of significant EMVars per locus, along with a Venn diagram of EMVars called in either brain or adipose cell lines. f (left) Total number of significant EMVars identified per chromosome (n = 1 value per chromosome). (right) s-LDSC estimates from n = 1 BMI GWAS summary statistics of the heritability explained per chromosome normalized to the proportion of variants tested; data shown are percent heritability explained ± SEM (LD score regression with a block jackknife approach) (also see Supplementary Fig. 5).
Fig. 3
Fig. 3. Integration of functional variants with genomic annotations prioritizes target genes.
a cHi–C allows for the identification of physical connections between enhancers (E) and promoters (P) in nuclear space and are shown as arcs on the linear genome (depicted here in pink). b (left) Cumulative distribution of promoter interactions per EMVar across time in adipose and brain cells. (right) Bar plot showing the number of promoters that each Brain MPRA enhancer interacts with across all cHi–C replicates (does not include enhancers that do not interact with a promoter). c Diagram of EMVars that are either in cHi–C interactions and/or are GTEx eQTLs, and not assigned to a target gene with either method. d Genes were binned into classes based on strength of the evidence supporting them as a GWAS target gene (see Methods). A half shaded circle = eQTL or cHi–C support e MAP2K5, a class I gene, is shown here with the brain and adipose cHi–C interactions from its promoter. Average activity units for each EMVar barcode and lead SNP from this locus are shown in a violin plot in HT22 (blue) and 3T3-L1 cells (yellow). * Reached q< 0.05 in at least three out of five independent MPRA experiments; two-sided Mann–Whitney U test. Additional data are shown in Supplementary Data 6.
Fig. 4
Fig. 4. Two independent GWAS loci physically converge in nuclear space.
a The locations of two lead GWAS variants separated by >0.5 Mb are depicted. cHi–C promoter interactions that encompass rs2650492 in the brain (blue) and adipose (yellow). b Location of rs2650492 within the 3′UTR of SBK1, along with significant DNAseI hypersensitivity clusters in 125 cell types from ENCODE. ATAC-seq peaks and read pileup from day 0 SGBS preadipocytes are also shown. c Location of all EMVars within the ATP2A1 locus along with ATAC-seq peaks and read pileup from day 0 SGBS preadipocytes and day 12 early neuronal precursors. d Allele-specific luciferase assay results for EMVars in the HT22 neuronal cell line or SGBS preadipocytes. Fold change is calculated relative to the control sequence. (n = 4 independent HT22 experiments, n = 3 independent SGBS experiments for all variants with the exception of rs478100 and rs2650492 which had n = 7 independent experiments). *SGBS: rs2650492 p = 0.009; rs9972768 p = 0.03; rs4788100 p = 0.006; *HT22: rs2650492 p = 0.01; rs9972768 p = 0.04; rs62037414 p = 0.02; rs12446589 p = 0.04; two-tailed Student’s t test, data are presented as mean ± SEM.
Fig. 5
Fig. 5. Functional variants in GWAS loci regulate multiple local genes in cis.
a Genomic regions targeted by CRISPR–cas9 editing machinery in iPSCs. (top) A 750 bp region within the 3′UTR of SBK1 containing rs2650492 was targeted for deletion, and (middle) a second 1.3 kb region in between TUFM and SH2B1 surrounding rs9972768 was deleted in an independent line. (bottom) iPSCs were differentiated to the hypothalamic lineage and collected at four-time points for RNA-seq. b PCA plot showing all genotypes and time points collected for RNA-seq during differentiation to hypothalamic neuronal precursors. c Plot of TMM normalized counts per million (CPM) for SBK1 across time points. * rs2650992 deletion lines TP1 q = 0.001, TP2 q = 0.004, +rs9972768 deletion lines TP2 q = 0.04, TP3 q = 0.002, TP4: q = 0.016; data are shown as mean ± SD (n = 3 clones rs2650492 deletion lines; rs9972768 deletion lines; WT lines TP4 and n = 4 clones WT lines TP1–3). d CRISPRi of enhancer containing rs2650492 in HEK293t cells. The expression after removal of batch effects for significantly differentially expressed cis-genes identified in RNA-seq analysis across CRISPRi conditions in HEK293t cells. left panel ***p = 5.1e−33, middle panel **p = 1.0e−4, right panel *p = 3.1e−3 (n = 5 independent experiments Cas9; GAPDH; rs265 and n = 4 independent experiments Neg Ctrl). boxplot center line, median; box limits, upper and lower quartiles; whiskers, 1.5× interquartile range.

References

    1. Hormozdiari F, et al. Widespread allelic heterogeneity in complex traits. Am. J. Hum. Genet. 2017;100:789–802. doi: 10.1016/j.ajhg.2017.04.005. - DOI - PMC - PubMed
    1. Consortium T. Gte. The GTEx Consortium atlas of genetic regulatory effects across human tissues. Science. 2020;369:1318–1330. doi: 10.1126/science.aaz1776. - DOI - PMC - PubMed
    1. Strober BJ, et al. Dynamic genetic regulation of gene expression during cellular differentiation. Science. 2019;364:1287–1290. doi: 10.1126/science.aaw0040. - DOI - PMC - PubMed
    1. Claussnitzer M, et al. FTO Obesity Variant Circuitry and Adipocyte Browning in Humans. N. Engl. J. Med. 2015;373:895–907. doi: 10.1056/NEJMoa1502214. - DOI - PMC - PubMed
    1. Beagan JA, et al. Three-dimensional genome restructuring across timescales of activity-induced neuronal gene expression. Nat. Neurosci. 2020;23:707–717. doi: 10.1038/s41593-020-0634-6. - DOI - PMC - PubMed

Publication types

MeSH terms

Substances

Supplementary concepts