. 2021 Sep 6;8(1):235.
doi: 10.1038/s41597-021-01019-1.

The short-term mortality fluctuation data series, monitoring mortality shocks across time and space

Affiliations

The short-term mortality fluctuation data series, monitoring mortality shocks across time and space

Dmitri A Jdanov et al. Sci Data. .

Abstract

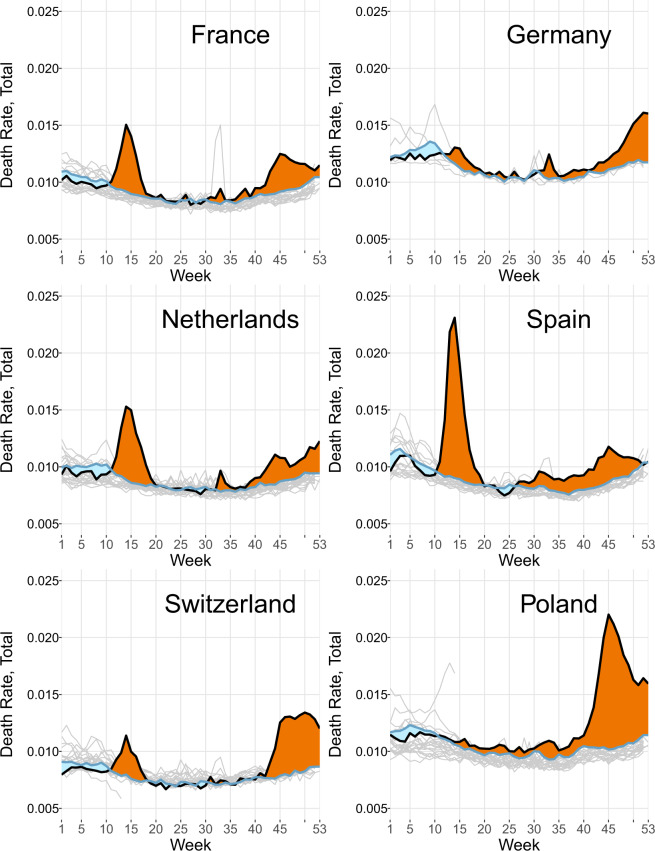
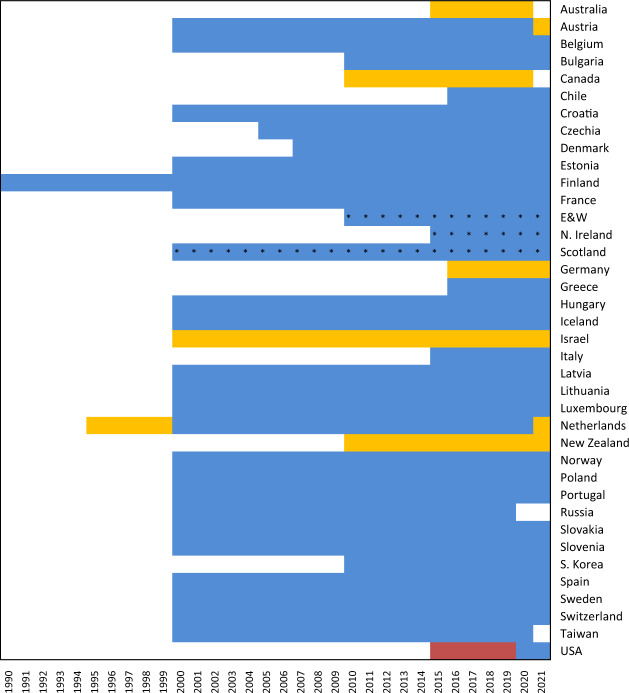
The COVID-19 pandemic has revealed substantial coverage and quality gaps in existing international and national statistical monitoring systems. It is striking that obtaining timely, accurate, and comparable across countries data in order to adequately respond to unexpected epidemiological threats is very challenging. The most robust and reliable approach to quantify the mortality burden due to short-term risk factors is based on estimating weekly excess deaths. This approach is more reliable than monitoring deaths with COVID-19 diagnosis or calculating incidence or fatality rates affected by numerous problems such as testing coverage and comparability of diagnostic approaches. In response to the emerging data challenges, a new data resource on weekly mortality has been established. The Short-term Mortality Fluctuations (STMF, available at www.mortality.org ) data series is the first international database providing open-access harmonized, uniform, and fully documented data on weekly all-cause mortality. The STMF online vizualisation tool provides an opportunity to perform a quick assessment of the excess weekly mortality in one or several countries by means of an interactive graphical interface.


Conflict of interest statement

The authors declare no competing interests.

Figures

Fig. 1
Fig. 1
Weekly death rates and excess mortality in six European countries for both sexes and all ages combined. Death rates per person in excess (positive numbers, orange areas on the graph) or deficit (negative numbers, blue areas) mortality are defined by difference between the weekly death rates observed in 2020 and the expected weekly death rates equal to the average weekly death rates over 2015–19 for the same weeks. Note: The figure was constructed using the STMF Visualization Toolkit located at https://mpidr.shinyapps.io/stmortality/.
Fig. 2
Fig. 2
Data availability in the STMF. Colored rectangles indicate availability of weekly-specific data for the corresponding years. Nevertheless, for the first year in the data series, a few first weeks might be missed while, for the last year, data collection might still be in progress and the last weeks might be missed. A blue color indicates that the original data are provided by sex and for age groups detailed enough to create STMF age groups without additional adjustments. A yellow color indicates that at least some of the original data for that year are provided by broad age group and sex. The red squares point to original data available only by broad age groups, i.e. STMF data were split by age and sex. A star (*) indicates that data is available only by date of registration instead of date of occurrence.

References

    1. Leon DA, et al. COVID-19: a need for real-time monitoring of weekly excess deaths. The Lancet. 2020;395:e81. doi: 10.1016/S0140-6736(20)30933-8. - DOI - PMC - PubMed
    1. Nielsen J, et al. European all-cause excess and influenza-attributable mortality in the 2017/18 season: should the burden of influenza B be reconsidered? Clin. Microbiol. Infect. 2019;25:1266–1276. doi: 10.1016/j.cmi.2019.02.011. - DOI - PubMed
    1. Németh L, Jdanov DA, Shkolnikov VM. An open-sourced, web-based application to analyze weekly excess mortality based on the Short-term Mortality Fluctuations data series. PLOS ONE. 2021;16:e0246663. doi: 10.1371/journal.pone.0246663. - DOI - PMC - PubMed
    1. Rizzi, S. & Vaupel, J. W. Short-term forecasts of expected deaths. Proc. Natl. Acad. Sci. 118, (2021). - PMC - PubMed
    1. EUROSTAT. Weekly deaths – special data collection (demomwk). https://ec.europa.eu/eurostat/cache/metadata/en/demomwk_esms.htm (2020).