. 2021 Sep 6;12(1):5296.
doi: 10.1038/s41467-021-25673-6.

Endothelium-specific depletion of LRP1 improves glucose homeostasis through inducing osteocalcin

Affiliations

Endothelium-specific depletion of LRP1 improves glucose homeostasis through inducing osteocalcin

Hua Mao et al. Nat Commun. .

Abstract

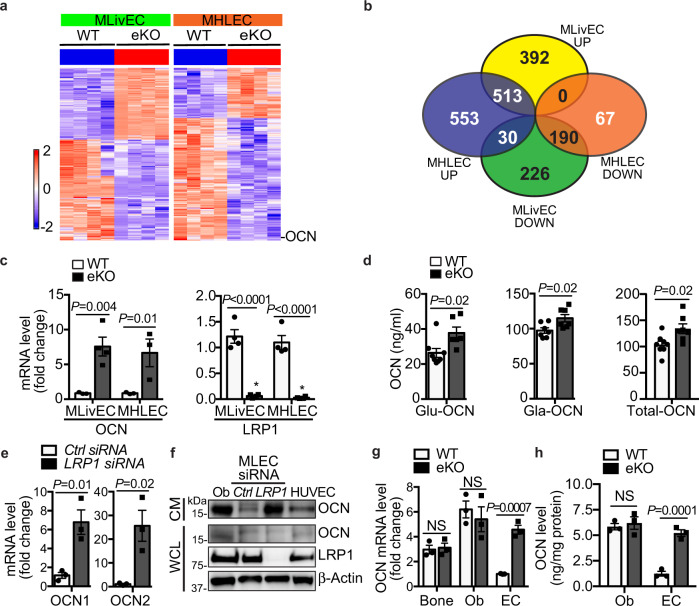
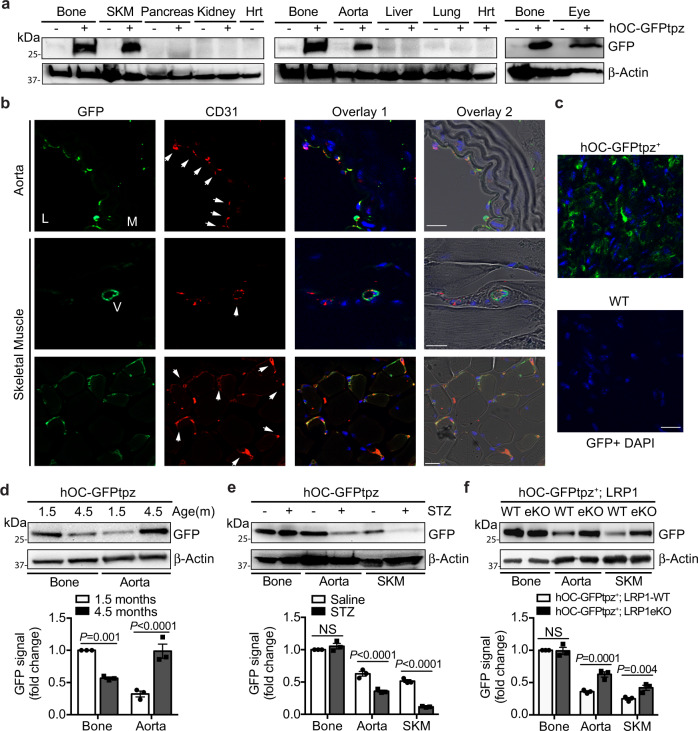
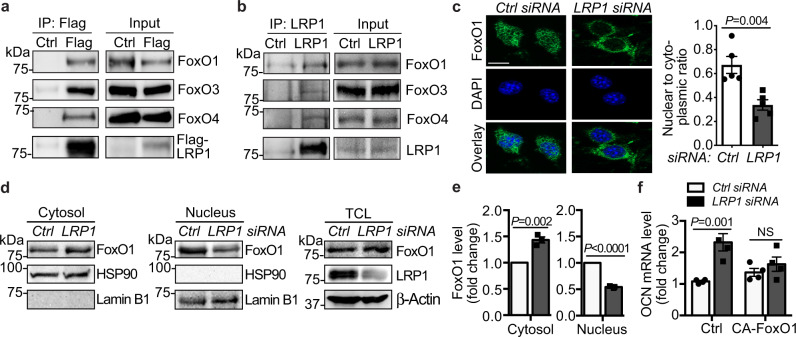
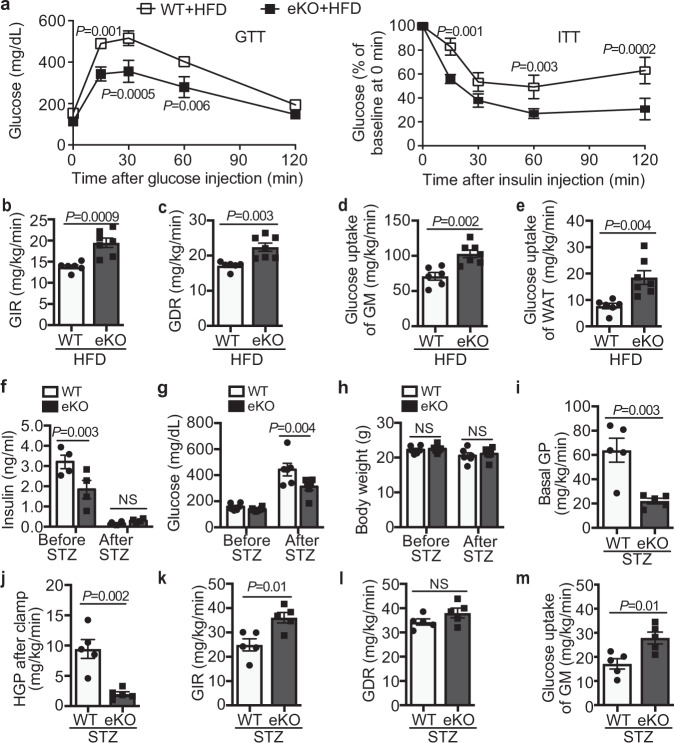
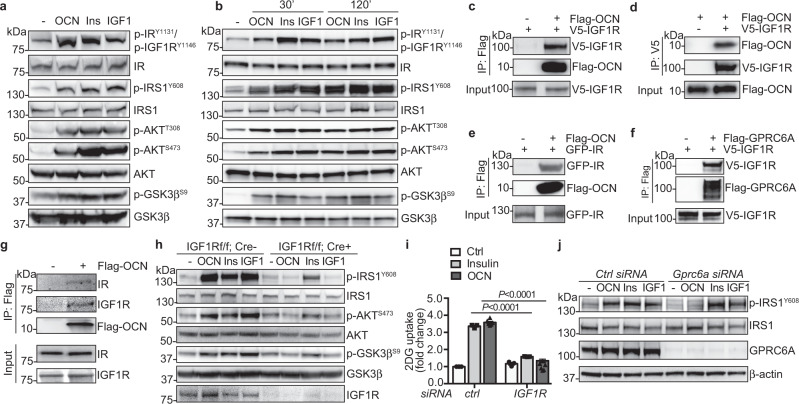
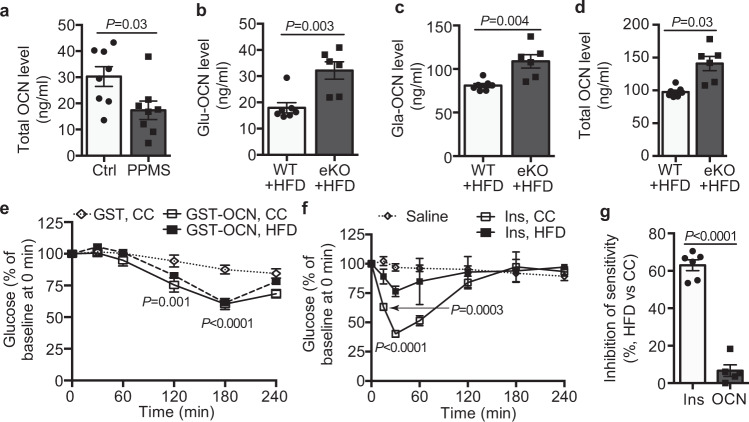
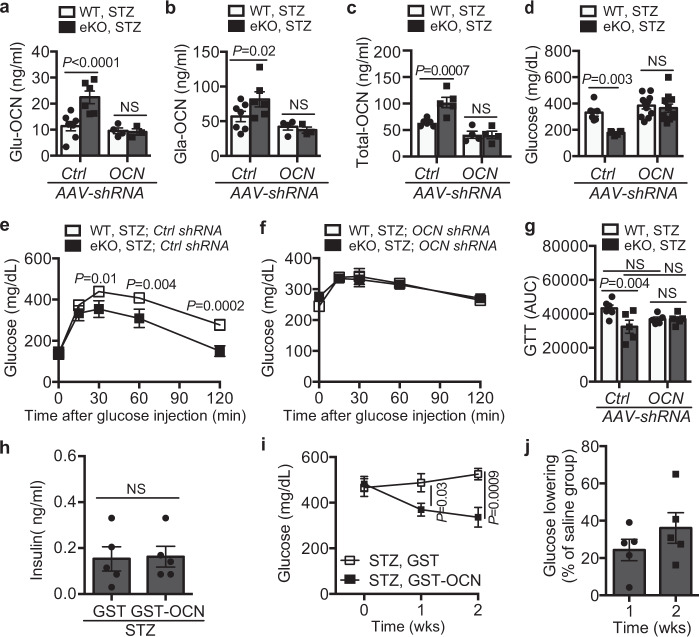
The vascular endothelium is present within metabolic organs and actively regulates energy metabolism. Here we show osteocalcin, recognized as a bone-secreted metabolic hormone, is expressed in mouse primary endothelial cells isolated from heart, lung and liver. In human osteocalcin promoter-driven green fluorescent protein transgenic mice, green fluorescent protein signals are enriched in endothelial cells lining aorta, small vessels and capillaries and abundant in aorta, skeletal muscle and eye of adult mice. The depletion of lipoprotein receptor-related protein 1 induces osteocalcin through a Forkhead box O -dependent pathway in endothelial cells. Whereas depletion of osteocalcin abolishes the glucose-lowering effect of low-density lipoprotein receptor-related protein 1 depletion, osteocalcin treatment normalizes hyperglycemia in multiple mouse models. Mechanistically, osteocalcin receptor-G protein-coupled receptor family C group 6 member A and insulin-like-growth-factor-1 receptor are in the same complex with osteocalcin and required for osteocalcin-promoted insulin signaling pathway. Therefore, our results reveal an endocrine/paracrine role of endothelial cells in regulating insulin sensitivity, which may have therapeutic implications in treating diabetes and insulin resistance through manipulating vascular endothelium.


Conflict of interest statement

The authors declare no competing interests.

Figures

Fig. 1
Fig. 1. Osteocalcin is induced in LRP1-depleted ECs.
a Heatmaps of mRNA-seq data demonstrate changes in gene expression profiles of liver ECs (MLivECs) and heart and lung ECs (MHLECs) isolated from LRP1 (eKO, LRP1f/f; Cdh5-CreER+/-) or their littermate control (WT, LRP1f/f; Cdh5-CreER-/-) mice. b A Venn diagram shows upregulated (UP) or downregulated (DOWN) gene numbers in LRP1-depleted MLivECs and MHLECs. c Expression changes of OCN and LRP1 were confirmed by real-time PCR. d Blood levels of Glu-, Gla- and total-OCN. e OCN1 and OCN2 mRNA levels in mouse lung ECs (MLECs) following transfection of LRP1 or control siRNAs. f OCN levels in conditioned media (CM) and whole-cell lysates (WCL) of osteoblasts (Ob) and different ECs. HUVEC, human umbilical vein endothelial cell. g OCN mRNA levels in marrow-flushed bone, osteoblasts (Ob) and ECs isolated from wildtype (WT) or LRP1 eKO mice. h OCN levels in CM of Obs and ECs isolated from WT or LRP1 eKO mice. n = 3 (c WT; c eKO, MHLEC), 4 (c eKO, MLivEC), 8 (d WT, Glu/Total-OCN), 7 (d Gla-OCN; eKO, Total-OCN), 6 (d eKO, Glu-OCN), 3 (e, g, h). NS, not significant. Data are presented as mean ± SEM. Analysis was two-way ANOVA followed by Fisher’s LSD multiple comparison test (c, g, h) or unpaired two-tailed Student’s t-test (d, e).
Fig. 2
Fig. 2. The ocn promoter-driven GFP expression in ECs.
ac The ocn promoter-driven GFP expression was detected in aorta and other tissues of hOC-GFPtpz mice, determine by Western blotting (a), cross-section staining with aorta and skeletal muscle (b) and en face staining with aorta (c). SKM, skeletal muscle. Hrt, heart. Arrows indicate GFP-positive ECs. L, lumen. M, media. V, vessel. Negative control images with tissues of non-transgenic mice are shown in Supplementary Figure 2j. d GFP levels in bone and aorta isolated from hOC-GFPtpz mice at indicated age. e GFP levels in bone, aorta and skeletal muscle isolated from streptozotocin (STZ)-induced diabetic or control hOC-GFPtpz mice. f GFP levels in bone, aorta and skeletal muscle isolated from LRP1 eKO; hOC-GFPtpz or WT; hOC-GFPtpz mice. Scale bar, 20 μm. n = 3 (df). NS, not significant. Data are presented as mean ± SEM. Analysis was two-way ANOVA followed by Fisher’s LSD multiple comparison test (df).
Fig. 3
Fig. 3. LRP1 depletion induces OCN through increasing FoxO nuclear export in ECs.
a, b LRP1 was associated with FoxOs. Lysates of HEK 293 cells containing stably expressed Flag-LRP1β (a) or MLECs (b) were immunoprecipitated with anti-Flag or anti-LRP1 resin and blotted for FoxOs. ce LRP1 depletion in MLECs led to FoxO1 nuclear export. MLECs were transfected with LRP1 or control siRNAs and subjected for immunofluorescence imaging (b) or subcellular fractionation assays (d, e). MLECs were stained for FoxO1 (green) and the nucleus (DAPI, blue, b) and the intensity ratio of FoxO1 signals in the nucleus compared to that in cytosol was quantified. Scale bar, 10 μm. TCL, total cell lysates. f Constitutively active FoxO1 (CA-FoxO1) inhibited LRP1 depletion-induced OCN, analyzed with real-time PCR. n = 5 (c), 3 (e), and 4 (f). NS, not significant. Data are presented as mean ± SEM. Analysis was two-way ANOVA followed by Fisher’s LSD multiple comparison test (f) or unpaired two-tailed Student’s t-test (c, e).
Fig. 4
Fig. 4. LRP1 eKO mice display improved glucose response in diabetic mice.
Glucose studies were performed with HFD-fed (ae) or STZ-injected (fm) LRP1 eKO and WT mice. a Glucose and insulin tolerance tests (GTTs, ITTs). be Hyperinsulinemic-euglycemic glucose clamp studies were performed in HFD-fed WT and LRP1 eKO mice for measurements of (b) GIR, (c) GDR, glucose uptake in gastrocnemius muscle (GM, d) and white adipose tissue (WAT, e). Results for control chow-fed mice are included in Supplementary Fig. 4. fh Blood levels of insulin (f), glucose (g) and body weight (h). im Hyperinsulinemic-euglycemic glucose clamp studies were performed in WT and LRP1 eKO mice after STZ-induced diabetes for measurements of basal glucose production (GP, i), hepatic GP after clamp (HGP, j), GIR (k), GDR (l), and glucose uptake of GM (m). n = 7 (a; be, eKO), 6 (be, WT; f, WT, after STZ; gh), 4 (f, WT, before STZ; f, eKO), 5 (im). NS, not significant. Data are presented as mean ± SEM. Analysis was two-way ANOVA followed by Fisher’s LSD multiple comparison test (a, fh) or unpaired two-tailed Student’s t-test (be, im).
Fig. 5
Fig. 5. OCN requires GPRC6A and IGF1R for the activation of the downstream insulin signaling pathway.
a, b OCN promoted insulin signaling in skeletal muscle (a) and liver (b). Ins, insulin. cf OCN was associated with IGF1R (c, d) and IR (e), and GPRC6A was associated with IGF1R (f) in HEK 293 cells. g OCN was in the complex with endogenous IR and IGF1R in primary hepatocytes. h IGF1R was required for OCN-induced phosphorylation of insulin signaling mediators in primary hepatocytes. i IGF1R knockdown inhibited OCN-promoted 2DG uptake. C2C12 cells were transfected with IGF1R siRNAs and then treated with OCN or insulin for 2 h. n = 3 for three independent repeats of each experiment. j GPRC6A knockdown inhibited OCN-induced phosphorylation of insulin signaling mediators in primary hepatocytes. n = 3 (i, ctrl, Insulin), 6 (i, OCN). Data are presented as mean ± SEM. Analysis was two-way ANOVA followed by Fisher’s LSD multiple comparison test (i).
Fig. 6
Fig. 6. OCN, induced by LRP1 depletion in HFD-fed mice, promotes blood glucose clearance.
a Blood OCN levels in human metabolic syndrome patients (MS) and normal lean controls (Ctrl). bd Blood Glu-, Gla- and total OCN levels in HFD-fed WT and eKO mice. Results for control chow (CC)-fed mice are included in Fig. 1d. eg OCN and insulin tolerance tests in CC and HFD mice (OTTs in e, ITT in f). The inhibition of maximal sensitivity for insulin and OCN in HFD-fed mice compared to CC-fed ones is presented in g. n = 11 (a), 7 (bd, WT), 6 (bd, eKO), 5 (e; f, saline; g, OCN), 4 (f, insulin, CC), 6 (f, insulin, HFD; g, insulin). Data are presented as mean ± SEM. Analysis was unpaired two-tailed Student’s t-test (ad, g) or two-way ANOVA followed by Fisher’s LSD multiple comparison test (e, f).
Fig. 7
Fig. 7. OCN silencing in vivo inhibits endothelial LRP1 depletion-improved glucose responses.
ad Blood levels of Glu- (a), Gla- (b) and total OCN (c), and non-fasting glucose (d) after AAV-OCN-shRNA or AAV-Ctrl-shRNA injection in mice after STZ treatment. The data for control mice are shown in Fig. 1d. eg Glucose tolerance tests in AAV-Ctrl-shRNA (e) and AAV-OCN-shRNA (f) injected mice after STZ-induced diabetes. g Areas under the curve (AUCs) for GTTs. h Blood levels of insulin in saline (containing GST-OCN or GST)-injected STZ mice. The data for non-STZ control mice are shown in Supplementary Fig. 5b. i–j OCN administration alleviates hyperglycemic response in STZ-induced type 1 diabetic mice. The percentage of glucose-lowering in GST-OCN-injected STZ mice compared to GST-injected mice is presented in j. n = 6 (ac, WT; d, Ctrl-shRNA; eg, WT; h), 5(ac, eKO, Ctrl-shRNA; eg, eKO; i, j), 4 (ac, eKO, OCN-shRNA), 11 (d, OCN-shRNA). NS, not significant. Data are presented as mean ± SEM. Analysis was two-way ANOVA followed by Fisher’s LSD multiple comparison test (ag, i) or unpaired two-tailed Student’s t-test (h, j).

References

    1. Caspard H, et al. Recent trends in the prevalence of type 2 diabetes and the association with abdominal obesity lead to growing health disparities in the USA: An analysis of the NHANES surveys from 1999 to 2014. Diabetes Obes. Metab. 2018;20:667–671. doi: 10.1111/dom.13143. - DOI - PMC - PubMed
    1. Cersosimo E, Johnson EL, Chovanes C, Skolnik N. Initiating therapy in patients newly diagnosed with type 2 diabetes: Combination therapy vs a stepwise approach. Diabetes Obes. Metab. 2018;20:497–507. doi: 10.1111/dom.13108. - DOI - PubMed
    1. Saltiel AR, Kahn CR. Insulin signalling and the regulation of glucose and lipid metabolism. Nature. 2001;414:799–806. - PubMed
    1. Lillis AP, Van Duyn LB, Murphy-Ullrich JE, Strickland DK. LDL receptor-related protein 1: unique tissue-specific functions revealed by selective gene knockout studies. Physiol. Rev. 2008;88:887–918. doi: 10.1152/physrev.00033.2007. - DOI - PMC - PubMed
    1. Basford JE, et al. Hepatic deficiency of low density lipoprotein receptor-related protein-1 reduces high density lipoprotein secretion and plasma levels in mice. J. Biol. Chem. 2011;286:13079–13087. doi: 10.1074/jbc.M111.229369. - DOI - PMC - PubMed

Publication types

MeSH terms