. 2022 Jan;40(1):74-85.
doi: 10.1038/s41587-021-01006-2. Epub 2021 Sep 6.

Integration of spatial and single-cell transcriptomic data elucidates mouse organogenesis

Affiliations

Integration of spatial and single-cell transcriptomic data elucidates mouse organogenesis

T Lohoff et al. Nat Biotechnol. 2022 Jan.

Abstract

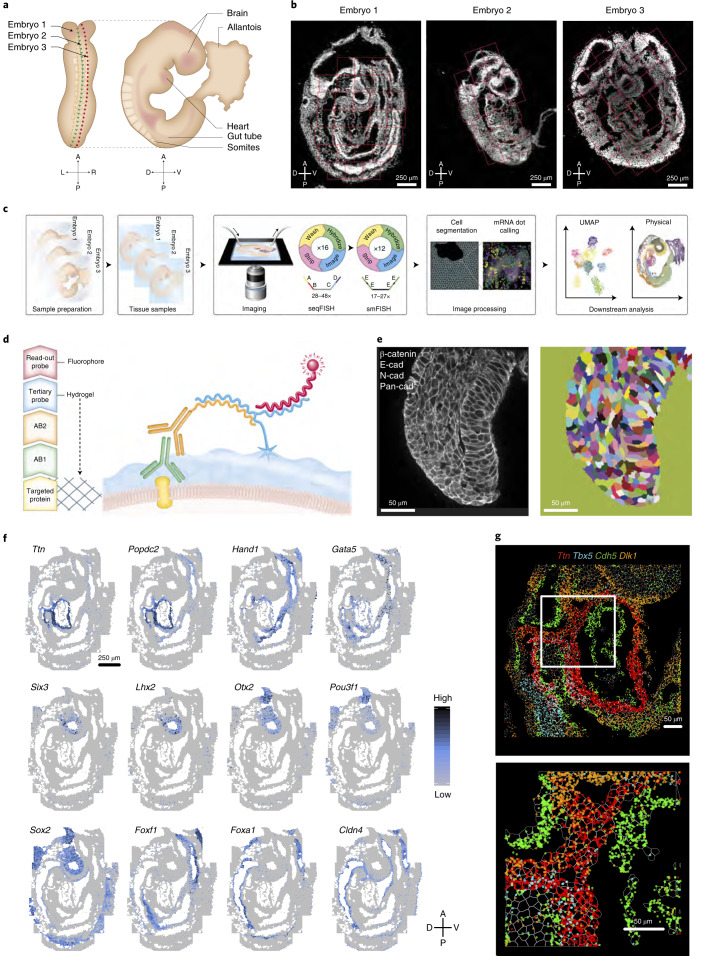
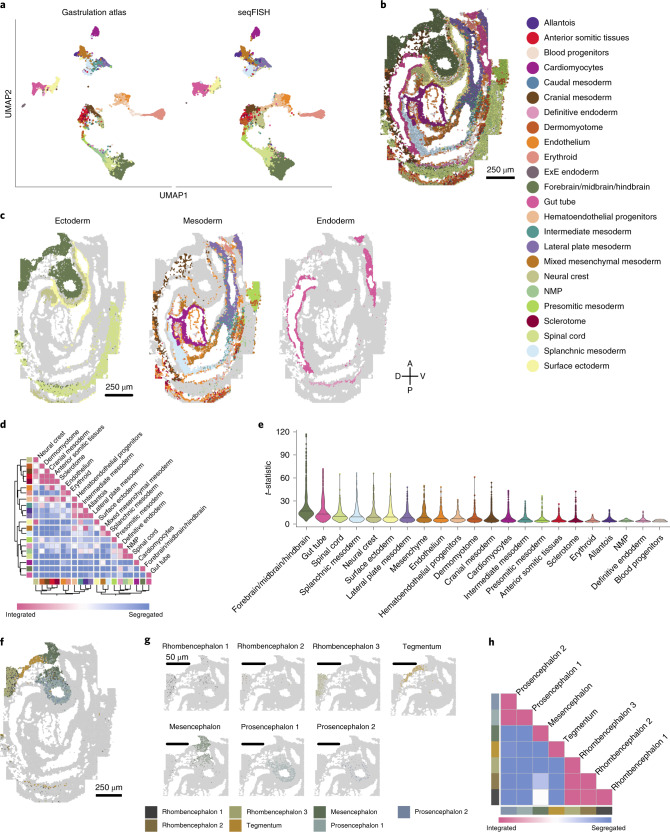
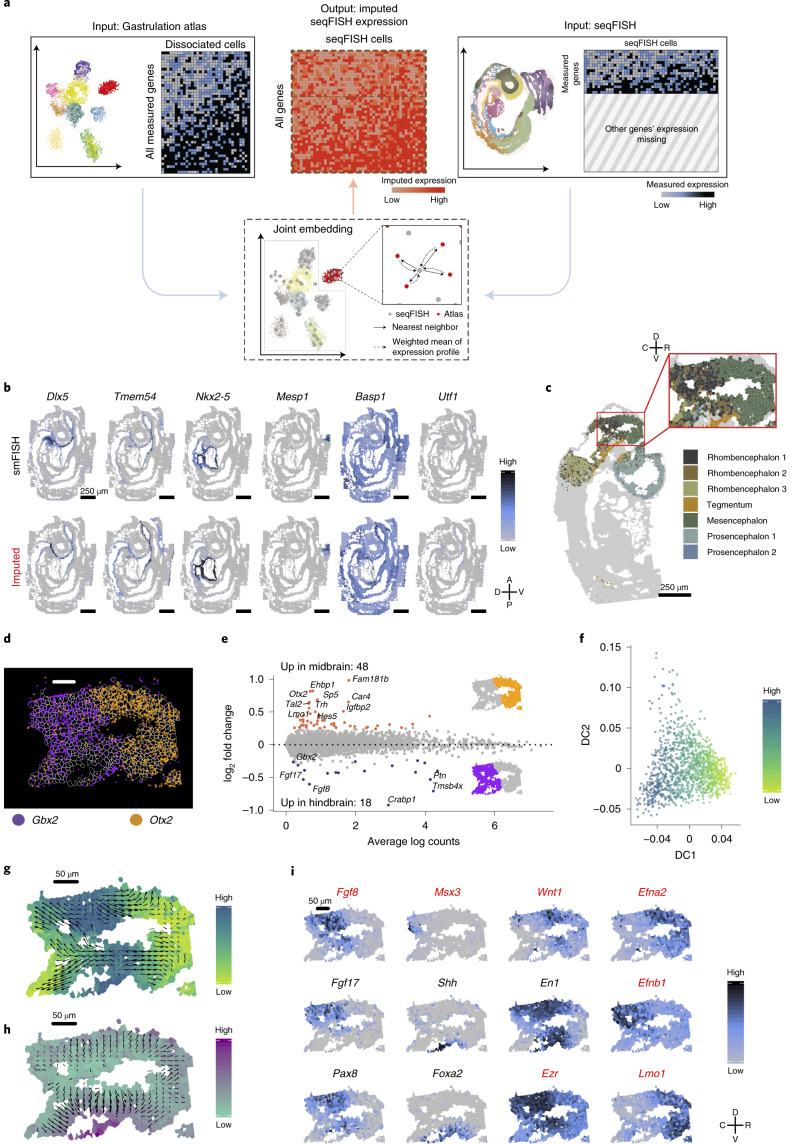
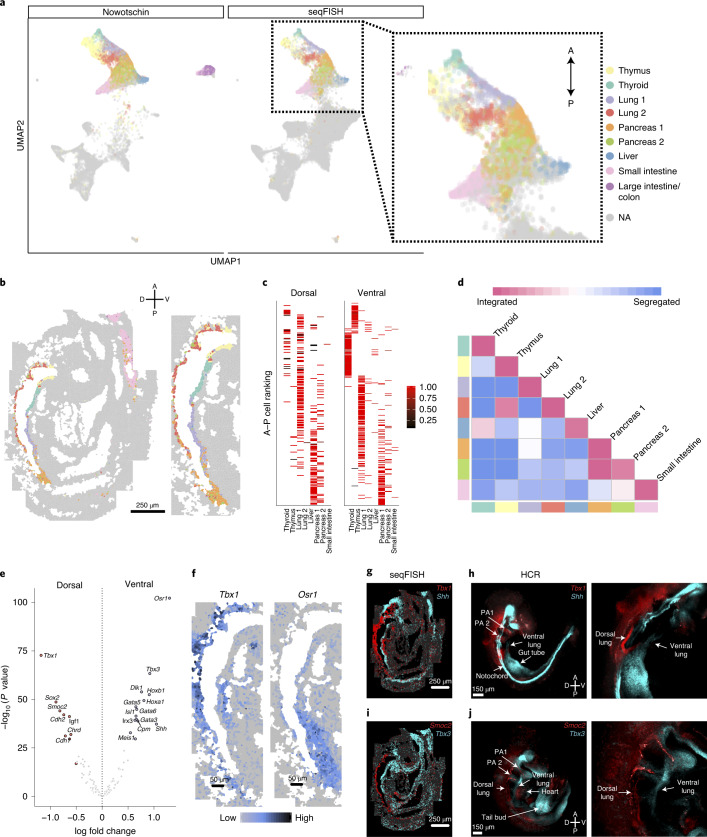
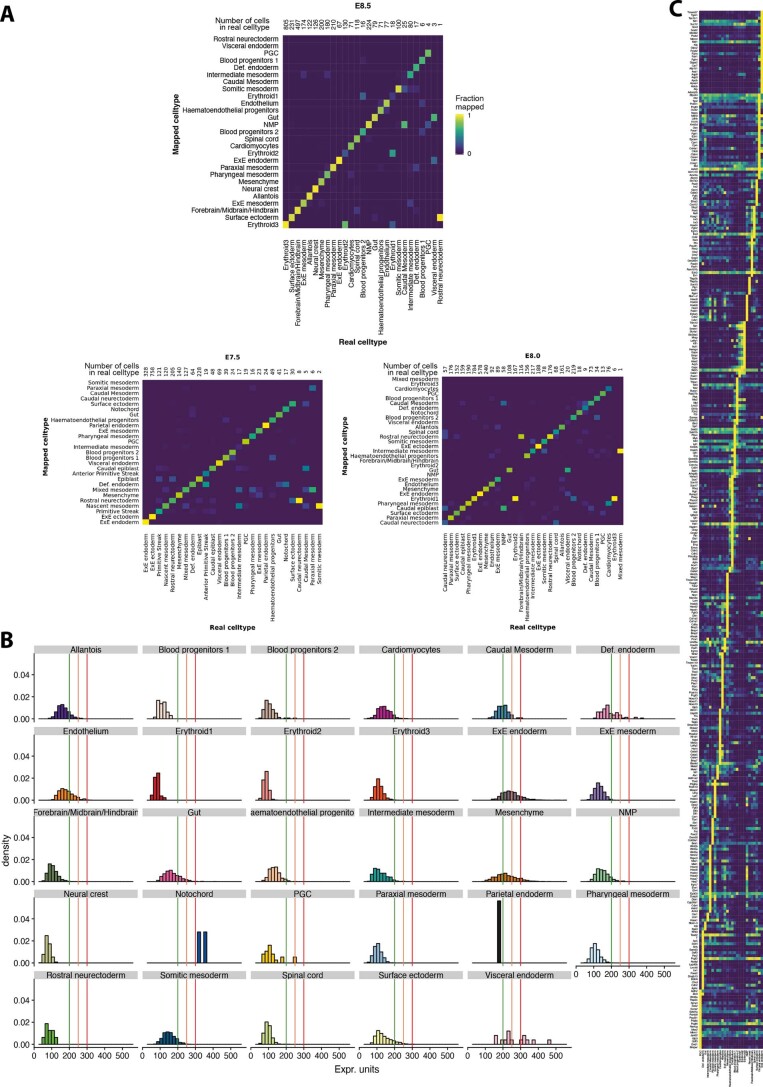
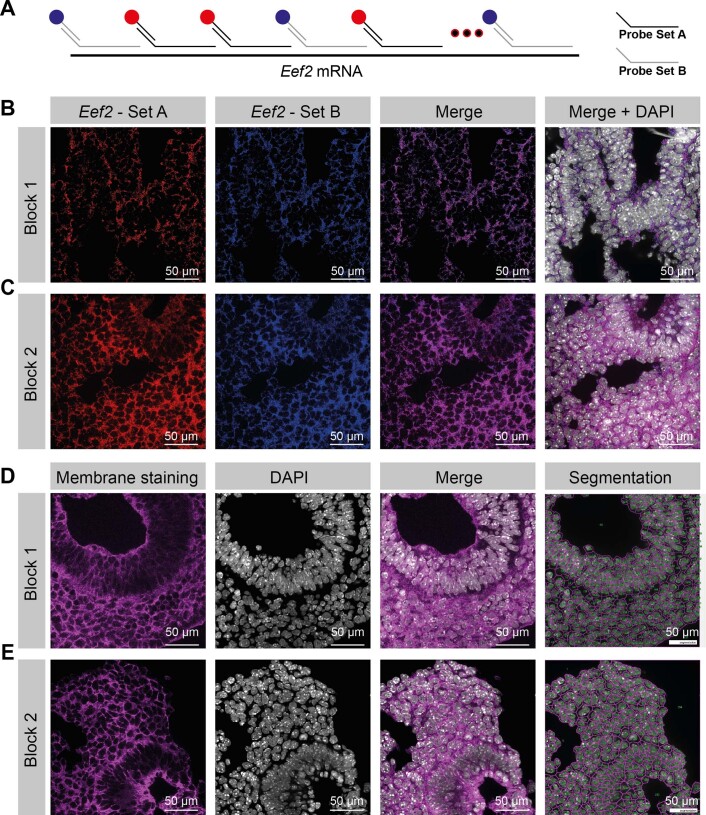
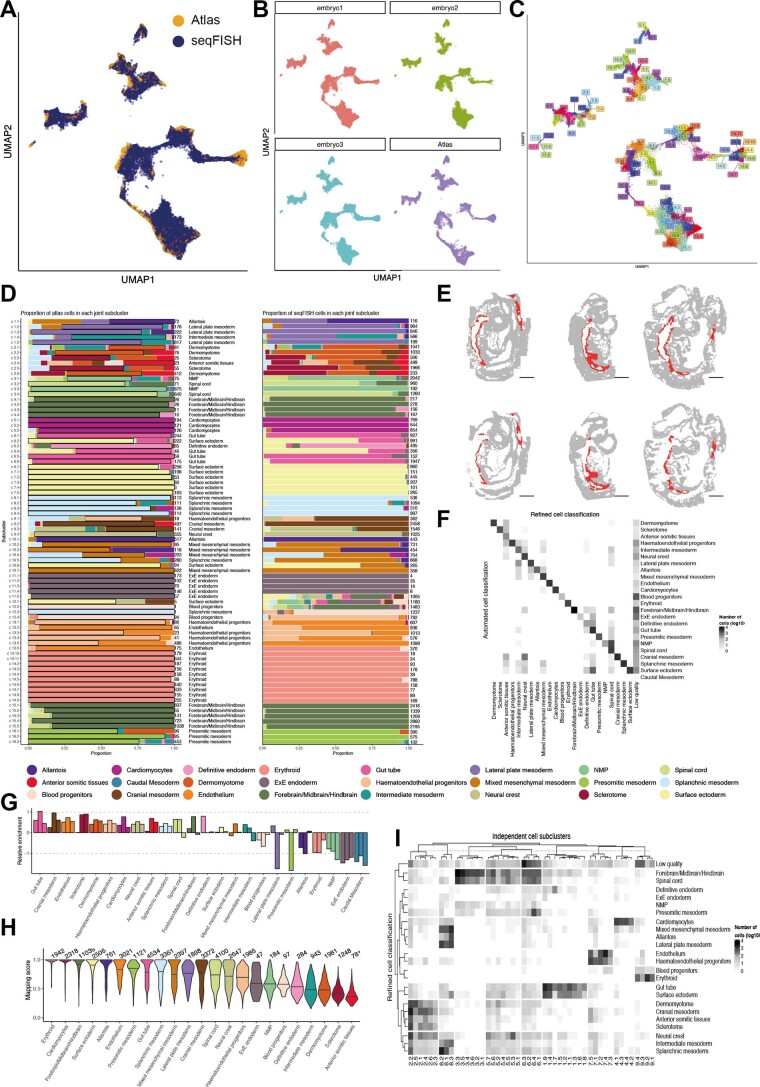
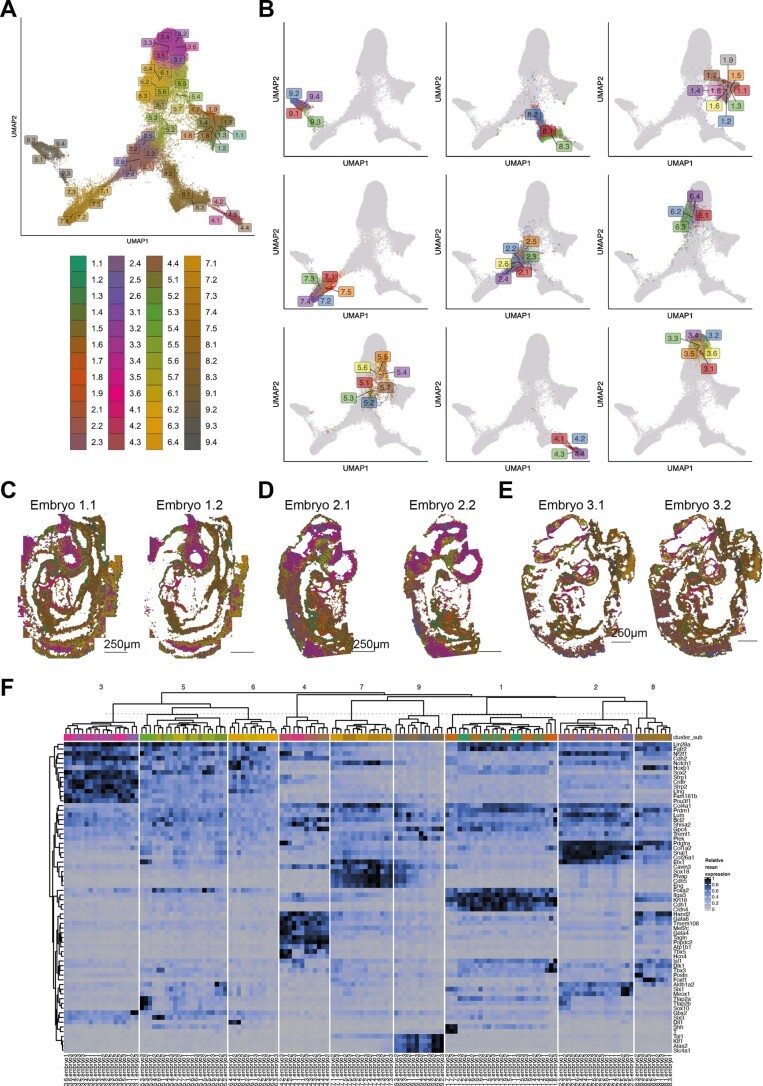
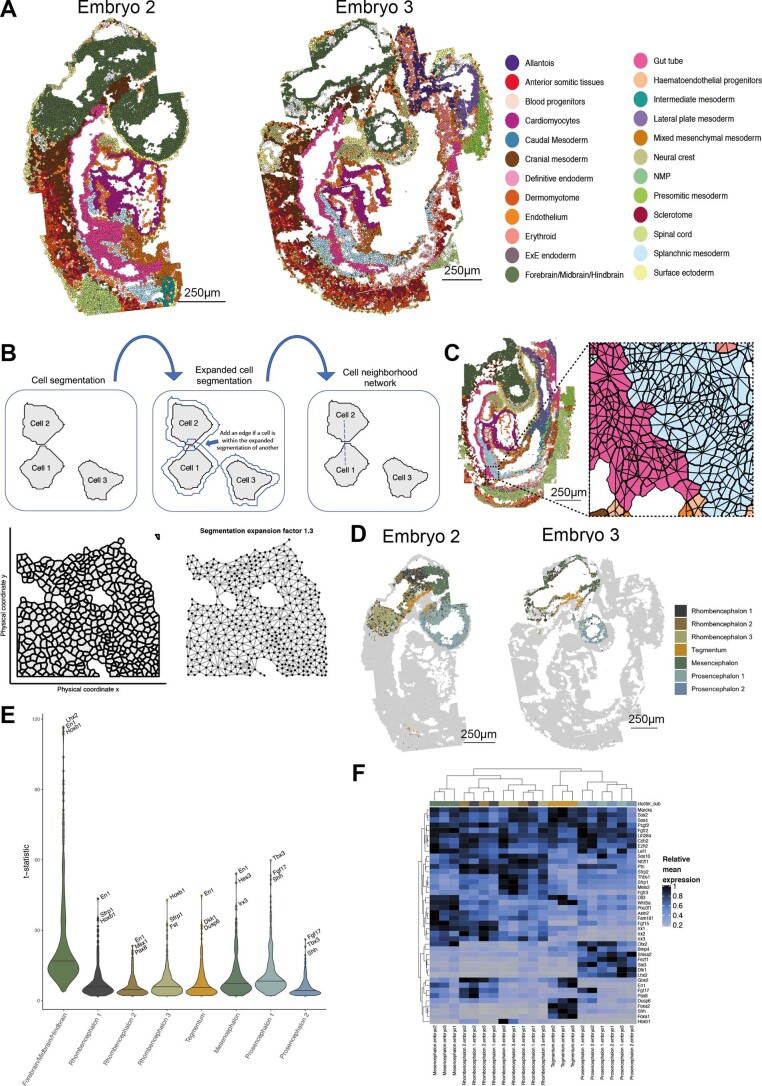
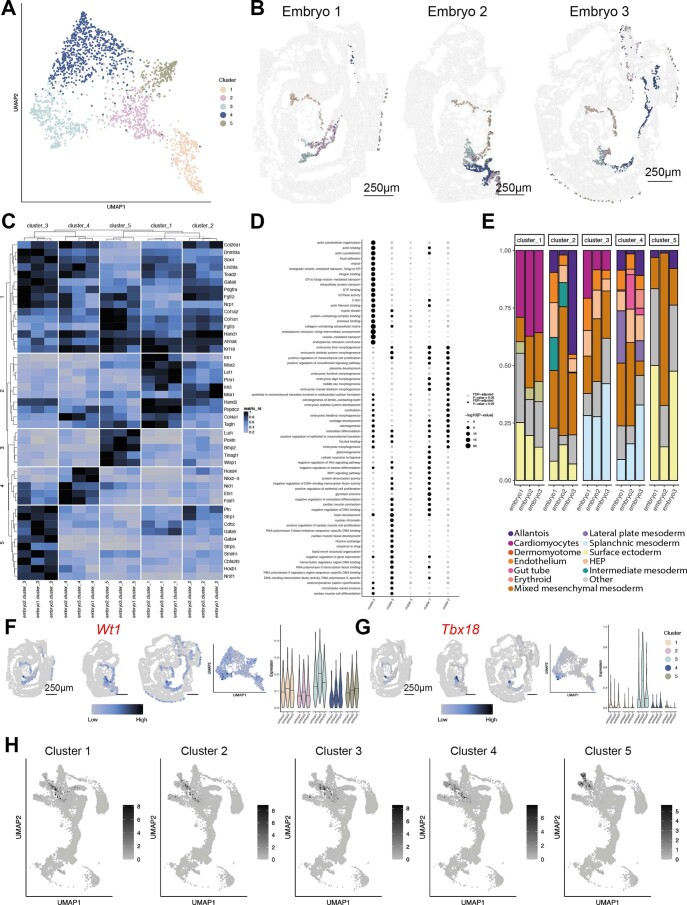
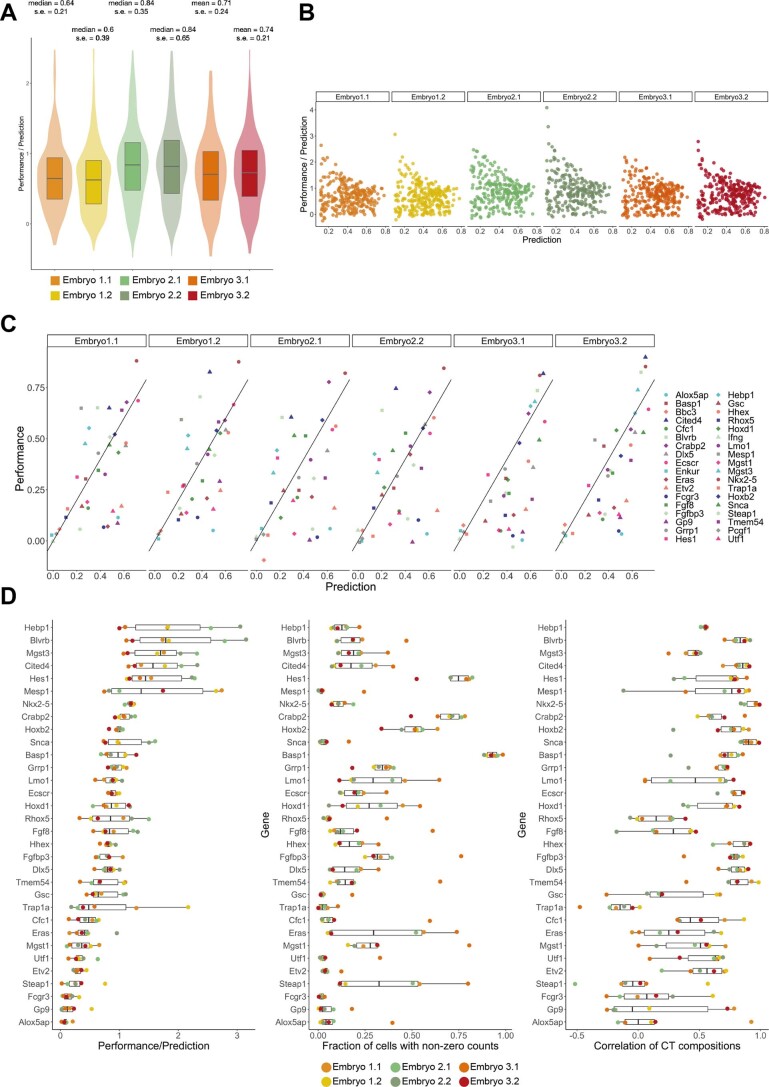
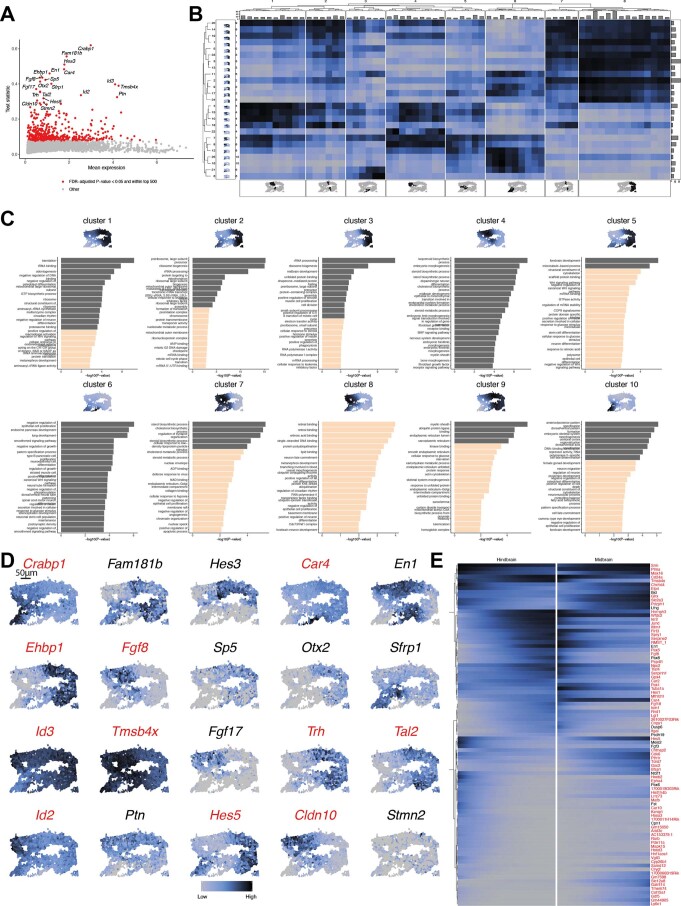
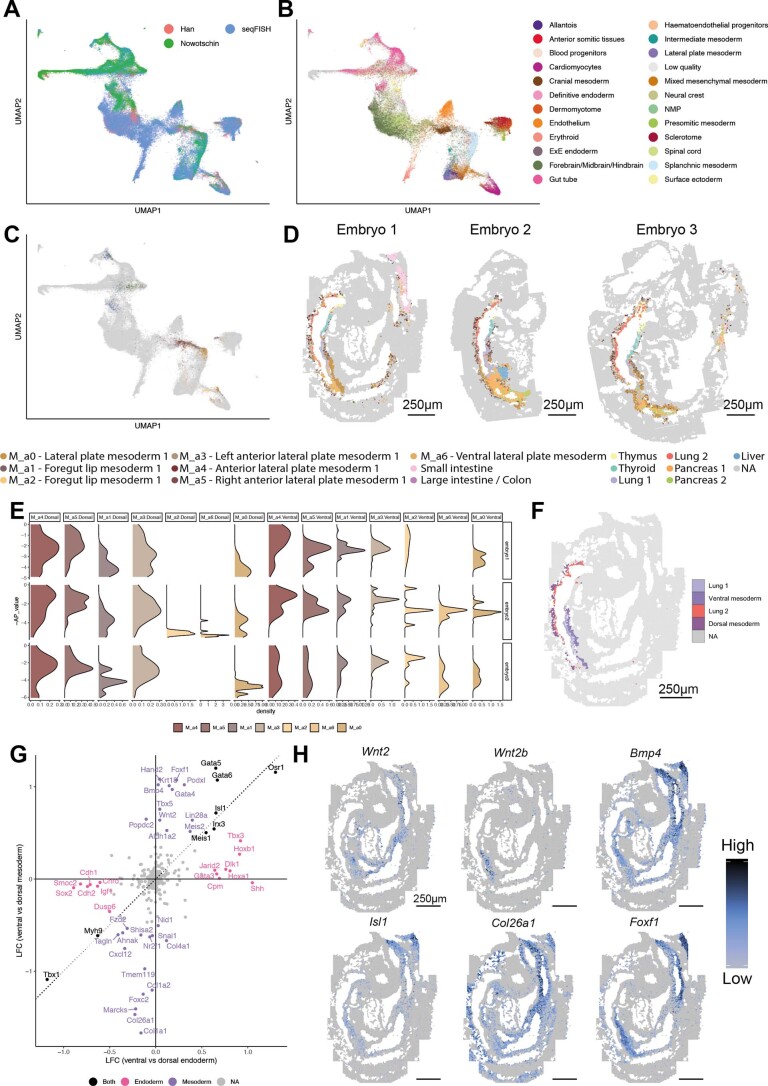
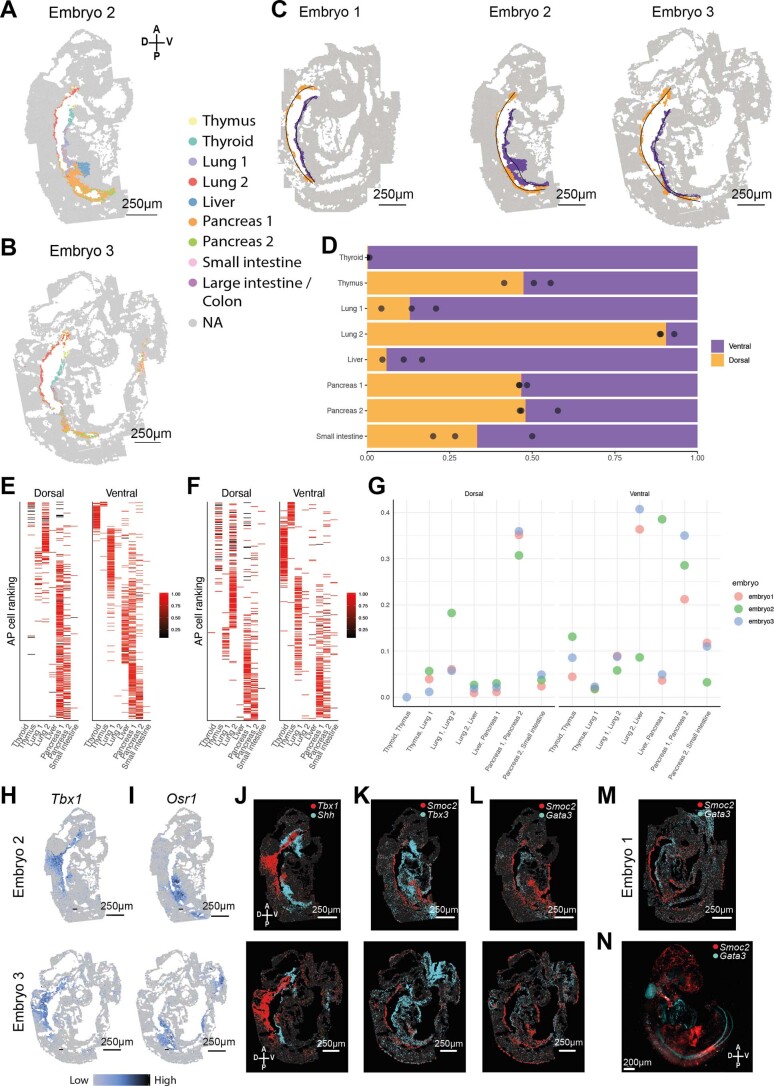
Molecular profiling of single cells has advanced our knowledge of the molecular basis of development. However, current approaches mostly rely on dissociating cells from tissues, thereby losing the crucial spatial context of regulatory processes. Here, we apply an image-based single-cell transcriptomics method, sequential fluorescence in situ hybridization (seqFISH), to detect mRNAs for 387 target genes in tissue sections of mouse embryos at the 8-12 somite stage. By integrating spatial context and multiplexed transcriptional measurements with two single-cell transcriptome atlases, we characterize cell types across the embryo and demonstrate that spatially resolved expression of genes not profiled by seqFISH can be imputed. We use this high-resolution spatial map to characterize fundamental steps in the patterning of the midbrain-hindbrain boundary (MHB) and the developing gut tube. We uncover axes of cell differentiation that are not apparent from single-cell RNA-sequencing (scRNA-seq) data, such as early dorsal-ventral separation of esophageal and tracheal progenitor populations in the gut tube. Our method provides an approach for studying cell fate decisions in complex tissues and development.


Conflict of interest statement

W.R. is a consultant and shareholder of Cambridge Epigenetix. L.C. is the cofounder of Spatial Genomics Inc. and holds patents on seqFISH. The remaining authors declare no competing interests.

Figures

Fig. 1
Fig. 1. Single-cell spatial transcriptomics map of mouse organogenesis using seqFISH.
a, Illustration of 8–12 ss mouse embryo. Dotted lines indicate the estimated position of the sagittal tissue section shown in b; D, dorsal; V, ventral; R, right; L, left; A, anterior; P, posterior. b, Tile scan of a 20-µm sagittal section of three independently sampled 8–12 ss embryos stained with nuclear dye DAPI (white). Red boxes indicate the selected field of view (FOV) imaged using seqFISH. c, Illustration of the experimental overview for spatial transcriptomics using seqFISH for 351 selected genes in 16 sequential rounds of hybridization and 12 non-barcoded sequential smFISH hybridization rounds for 36 genes. For each targeted gene, 17–48 unique probes were used to capture the mRNA; UMAP, uniform manifold approximation and projection. d, Cell segmentation strategy using a combination of E-cadherin (E-cad), N-cadherin (N-cad), pan-cadherin (Pan-cad) and β-catenin antibody (AB; green) staining detected by an oligo-conjugated anti-mouse IgG secondary antibody (orange) that gets recognized by a tertiary probe sequence. The acrydite group (blue star) of the tertiary probe (blue) gets crosslinked into a hydrogel scaffold and stays in place even after protein removal during tissue clearing. The cell segmentation labeling can be read by a fluorophore-conjugated readout probe (red); AB1, antibody 1; AB2, antibody 2. e, Cell segmentation staining of a 10-µm thick transverse section of an E8.5 mouse embryo using the strategy introduced in d. Cell segmentation signal was used to generate a cell segmentation mask using Ilastik (right). This was repeated independently for all N = 3 embryos with similar results. f, Representative visualization of normalized log expression counts of 12 selected genes measured by seqFISH to validate performance. This experiment was repeated independently for all N = 3 embryos with similar results. g, Highly resolved ‘digital in situ of the cardiomyocyte marker titin (Ttn), Tbx5, Cdh5 and Dlk1, colored in red, cyan, green and orange, respectively. Dots represent individually detected mRNA spots, and the box represents an area that was magnified for better visualization. This experiment was repeated independently for all N = 3 embryos with similar results.
Fig. 2
Fig. 2. Cell-type annotation and neighborhood characterization.
a, Projection of seqFISH spatial and Gastrulation atlas cells in joint reduced dimensional space to annotate seqFISH cells based on their nearest neighbors in the mouse Gastrulation atlas. b, Real position of annotated seqFISH cells in an embryo tissue section. Colors represent refined cell-type classification; ExE endoderm, extraembryonic endoderm; NMP, neuromesodermal progenitor. c, Cell-type maps separated by the three germ layers (ectoderm, mesoderm and endoderm). d, Cell–cell contact map displaying the relative enrichment toward integration and segregation of pairs of cell types in space. Cell types are clustered by their relative integration with others. e, Violin plots showing the t-statistic for each gene and cell type corresponding to a measure of the degree of residual transcriptional heterogeneity explained by space. f, Reclustering of forebrain/midbrain/hindbrain cell types into seven spatially distinct clusters. g, Zoom in of the brain region to visualize four major brain regions and seven subclusters identified in f. h, Cell–cell contact map of brain subclusters in space, ordered roughly anatomically from hindbrain to forebrain.
Fig. 3
Fig. 3. Creating and using a 10,000-plex spatial map.
a, Schematic representation of the imputation strategy. b, Independent validation of imputation performance by comparing normalized gene expression profiles of selected genes measured by smFISH with the corresponding imputed gene expression profiles. c, Visualization of brain subclusters in embryo 2 and virtual dissection of the MHB, highlighted by the red rectangle and inset zoom; C, caudal; R, rostral; D, dorsal; V, ventral. d, ‘Digital in situ’ showing detected mRNA molecules of a mesencephalon and prosencephalon marker Otx2 (orange dots) and a rhombencephalon marker Gbx2 (purple dots) to identify the MHB; scale bar, 50 µm. e, MA (log ratio and mean average) plot showing differential gene expression analysis using a two-sample t-test between the virtually dissected hindbrain region (orange; 48 genes significantly upregulated; absolute LFC > 0.2, FDR-adjusted P value of <0.05) and virtually dissected midbrain region (purple; 18 genes significantly upregulated; absolute LFC > 0.2, FDR-adjusted P value of <0.05) using the imputed transcriptome. f, Diffusion pseudotime analysis of the virtually dissected region to understand the dynamics of gene expression at the MHB. The scatter plot of diffusion-based embedding of virtually dissected cells displays diffusion components (DC) 1 and 2. Cell colors correspond to inferred diffusion pseudotime. g, Spatial graph showing virtually dissected cells colored by inferred diffusion pseudotime dominated by DC1. Arrow sizes correspond to the magnitude of change of the pseudotime value within the region in the direction from large to small pseudotime values. The highest pseudotime values are observed along the MHB region, smoothly diffusing outward to the midbrain and hindbrain regions. h, Spatial graph showing virtually dissected cells colored by DC2. Arrow sizes correspond to the magnitude of change of the DC2 value within the region. The most extreme DC2 values are observed perpendicular to the MHB region, smoothly diffusing outward to the floor plate and roof plate regions. i, Visualization of normalized log expression counts of important regulators of midbrain/hindbrain formation. Gene names shown in red font indicate imputed expression, while gene names shown in black font indicate measured expression.
Fig. 4
Fig. 4. Spatial characterization of gut tube organogenesis.
a, Joint embedding of seqFISH data and Nowotschin et al. cells corresponding to the developing gut tube with seqFISH cells annotated by their predicted gut tube subtype. Colors represent gut tube subtypes. The zoomed-in region shows anterior–posterior patterning of the gut endoderm cluster in the UMAP space, indicated by an arrow; NA, not annotated cell. b, Position of gut tube cell types in the embryo tissue section. Colors represent cell-type classification. A zoom-in image into the region of the gut tube is shown on the right for better visualization. c, Anterior–posterior (A–P) ranking of cells corresponding to each gut tube subtype split into dorsal and ventral regions. The bar color corresponds to the mapping score associated with classification into the subtype. d, Cell–cell contact map that displays the relative enrichment toward integration and segregation of pairs of gut tube subtypes in space, ordered along the inferred A–P ordering in Nowotschin et al.. e, Volcano plot showing a comparison of gene expression between the (ventral) lung 1 and (dorsal) lung 2 subtypes using seqFISH data. Significantly differentially expressed genes (two-sample t-test with an absolute LFC > 0.5 and an FDR-adjusted P value of <0.05) are highlighted, and corresponding gene names are indicated. f, Visualization of Tbx1 expression (enriched in the dorsal lung 2 cluster) and Osr1 expression (enriched in the ventral lung 1 cluster). g, ‘Digital in situ’ showing detected mRNA molecules for Tbx1 (red) and Shh (cyan) across the entire embryo tissue section. h, Multiplexed mRNA imaging of whole-mount E8.75 mouse embryo using HCR of Tbx1 (red) and Shh (cyan). The zoom in shows region-specific expression in the developing lung region; PA, pharyngeal arch. i, ‘Digital in situ’ showing detected mRNA molecules for Smoc2 (red) and Tbx3 (cyan) across the entire embryo tissue section. j, Multiplexed mRNA imaging of whole-mount E8.75 mouse embryo using HCR of Smoc2 (red) and Tbx3 (cyan). The zoom in shows region-specific expression in the developing lung region. Images are representative and were repeated independently on N = 2 embryos with similar results.
Extended Data Fig. 1
Extended Data Fig. 1. seqFISH probe library design.
(a) Predicting Gastrulation atlas cell types using the seqFISH probe library for embryonic timepoints E7.5, E8.0, and E8.5. The x-axis is the true cell type of each cell, and the y-axis the mapped cell type. Shading indicates the fraction of cells of each true cell type mapped to each possible cell type. Numbers for each column correspond to the number of cells in each true cell type. (b) Histogram, showing the seqFISH library feasibility. Histograms of expression units of the seqFISH probe library genes for each cell type in the E8.5 Gastrulation atlas. Green, orange, and red lines correspond to 200, 250, and 300 normalized expression units respectively, reflecting the guided expression to avoid oversaturation. (c) Heatmap showing the mean expression of all selected seqFISH library genes (rows) for each cell type (columns) in the E8.5 Gastrulation atlas.
Extended Data Fig. 2
Extended Data Fig. 2. Validation of RNA quality and cell segmentation.
Images are representative and were repeated independently for all N = 3 embryos with similar results. (a) Schematic overview of the hybridization of two interspersed Eef2 probe sets to test for RNA integrity. (b) Image showing the expression of Eef2 probe set A (Alexa Fluor 647 - red) and Eef2 probe set B (Cy3B - blue) for experimental block 1. Color merge of these two images indicates a high degree of overlap between red and blue probes. Merge and DAPI (grey) show overlap of Eef2 signal surrounding regions where cell nuclei are present. (c) Expression profile of Eef2 probe set A and B, as described in (B) for experimental block 2. (d) Image of cell membrane labeling (purple) using a combination of E-cadherin, N-cadherin, Pan-cadherin and β-catenin primary antibody staining, following an optimized cell segmentation protocol (Methods) and nuclear staining using DAPI (grey) for the first tissue section, containing embryo 1 and 2. Signal membrane labeling was used for cell segmentation using Ilastik. (e) Cell membrane labeling (purple) and cell segmentation, as described in (D) for experimental block 2.
Extended Data Fig. 3
Extended Data Fig. 3. Optimizing cell type annotation.
(a) Joint UMAP of Gastrulation atlas and seqFISH expression data, with cells colored by data modality. (b) Joint UMAP of Gastrulation atlas and seqFISH expression data, with panels corresponding to each embryo and the Gastrulation atlas dataset. (c) Joint UMAP of Gastrulation atlas and seqFISH expression data, colored by joint subclustering with labels corresponding to centroid in UMAP coordinates. (d) Barplots of the proportion of cell types from the Gastrulation atlas cells present in each subcluster (left), and automated cell type classification for seqFISH data (right). Numbers beside each bar correspond to the number of cells, and labels beside the left barplot correspond to the majority cell type of the Gastrulation atlas cells for each joint subcluster. (e) Spatial map of virtual dissection of cells to be classed as developing gut tube, for each embryo (columns) and z-slice (rows). Scale bar 250 µm. (f) Heatmap of contingency table of automated cell type label for seqFISH cells (rows) and refined cell type classification (columns). (g) Barplot of relative enrichment in abundance of seqFISH cells compared to Gastrulation atlas cells, each bar corresponds to embryo 1, 2, and 3, from left to right. (h) Violin plots of automated cell type mapping score for each seqFISH cell, with bar corresponding to median. Numbers above correspond to the number of cells classed into each cell type. (i) Heatmap of contingency table of cell type label for seqFISH cells (rows) and independent unsupervised cell subclusters (columns).
Extended Data Fig. 4
Extended Data Fig. 4. Unsupervised clustering of seqFISH data.
(a) UMAP of seqFISH expression data, with cells colored by unsupervised subclusters, with labels corresponding to centroid in UMAP coordinates. (b) Multiple panels displaying UMAP of seqFISH expression data, with cells for each separate cluster colored by the associated subcluster, with labels corresponding to centroid in UMAP coordinates. (c) Spatial map of embryo 1 cells colored by unsupervised subclusters (colors matching panel A) for each z-slice. Scale bar 250 µm. (d) as in C with embryo 2. (e) as in C with embryo 3. (f) Heatmap of relative mean expression of seqFISH cells grouped by embryo and unsupervised subcluster (columns) for genes selected as appearing in the top three significant marker genes (rows) for any of the subclusters. Colors along the top correspond to unsupervised subclusters with legend matching panel A.
Extended Data Fig. 5
Extended Data Fig. 5. Cell annotation and constructing the cell-contact map.
(a) Spatial map of embryos 2 and 3, colored by refined cell type. Scale bar 250 µm. (b) Schematic of construction of cell neighborhood network, where cell segmentation polygons are expanded and a network edge drawn if another cell is within the expanded polygon region. Below is the resulting network for a selected field of view (Position 0, Embryo 1). (c) Visualization of cell neighborhood network using spatial map of embryo 1 with zoom in to reveal cell neighborhood network edges among cells. Scale bar 250 µm. (d) Spatial maps of embryos 2 and 3, with cells colored by brain subtypes, and other cells in grey. Scale bar 250 µm. (e) Violin plot showing t-statistic corresponding to spatial heterogeneity test for each gene within brain subtype. The top three genes are labeled for each violin, and the bar corresponds to the median. (f) Heatmap of relative mean expression of each embryo and brain subcluster for significant (one-sided two-sample t-test FDR-adjusted P-value < 0.05, absolute LFC > 0.2) marker genes.
Extended Data Fig. 6
Extended Data Fig. 6. Characterization of mixed mesenchymal mesoderm cluster.
(a) UMAP embedding of mixed mesenchymal mesoderm seqFISH cells, colored by unsupervised clusters. (b) Spatial plots with cells colored by mixed mesenchymal mesoderm unsupervised clusters. (c) Heatmap of mean expression of each embryo and mixed mesenchymal mesoderm cluster for significant (FDR-adjusted P-value < 0.05, absolute LFC > 0.2) marker genes. (d) Dotplot of significantly enriched gene ontology terms for each mixed mesenchymal mesoderm cluster (Fisher’s Exact Test, FDR-adjusted P-value < 0.05). (e) Proportional bar plot showing the corresponding cell types for spatial neighbors of each embryo and mixed mesenchymal mesoderm cluster, with cell types with a small percentage grouped into Other cell types. Abbreviation used: HEP = hematoendothelial progenitors. (f) Spatial plots of inferred Wt1 expression among mixed mesenchymal mesoderm clusters, UMAP embedding of cells colored by Wt1 expression, and violin plot of Wt1 expression for each embryo and mixed mesenchymal mesoderm cluster. (g) As for (f) for inferred expression of Tbx18. (h) Scatterplot of UMAP embedding of E8.5 Gastrulation atlas cells, colored by proportion of selection within nearest neighbor set for each mixed mesenchymal mesoderm cluster.
Extended Data Fig. 7
Extended Data Fig. 7. Imputation strategy.
(a) Normalized performance as a validation of imputation. Violin plots show distributions (across measured genes) of normalized performance for each embryo and z-slice. Median and standard error appear above each violin. (b) Scatterplots of prediction scores (x-axis) and normalized performance scores (y-axis). Genes with prediction score lower than 0.1 show stochastic deviations in normalized performance and were filtered. (c) Scatterplots of performance and prediction scores for genes probed by smFISH, with each panel corresponding to one embryo and z-slice, and points corresponding to genes. Genes exhibiting strong field of view effect (FOV: 39, 40, 44) were discarded from quantification of performance and prediction scores. (d) Assessment of quality of imputation for smFISH genes. Genes are ordered according to the median Performance/Prediction ratio across all embryos and z-slices. Left panel: Boxplots representing Performance/prediction (x-axis) for genes profiled in smFISH across all embryos and z-slices. Middle panel: Boxplots representing fraction of cells with non-zero smFISH counts for the corresponding genes. Right panel: Boxplots representing correlation (across cell types) between fraction of cells (out of all cells for the corresponding cell type) with non-zero smFISH counts for the corresponding genes and fraction of cells with non-zero logcounts in the Gastrulation Atlas. Individual data points are overlaid on each boxplot. N = 6 technical samples across 3 biologically independent embryos. Boxes display 25th, 50th, and 75th percentiles, and whiskers extend to closest observation within outlier range, defined as not more than 1.5 times the interquartile range.
Extended Data Fig. 8
Extended Data Fig. 8. Statistical interrogation of the Midbrain-Hindbrain Region.
(a) Scatterplot of all imputed genes, showing mean expression (x-axis) and scHOT weighted mean test statistic (y-axis). Significant (scHOT permutation test, FDR-adjusted P-value < 0.05) and top 500-ranked genes are colored red, and the top 20 genes are labeled. (b) Heatmap of expression of clustered MHB genes and cells, split along columns by clustered cell regions, and along rows by mean expression profiles. Top barplots display the number of cells within each group, right barplots display the number of genes withing each group, bottom spatial graphs display cells belonging to each split cluster, and left spatial graphs show the mean spatial expression for genes that characterize each split cluster. (c) Spatial graph of the MHB with cells colored by mean expression of the genes belonging to each cluster, and barplots displaying the top 20 enriched gene ontology terms with bar length corresponding to -log10(unadjusted P-value), dark grey bars correspond to FDR-adjusted P-value < 0.05. Fisher’s Exact Test was used for gene ontology testing. (d) Spatial graphs of the MHB for the top 20 ranked scHOT weighted mean genes, with red titles corresponding to inferred gene expression. (e) Smoothed heatmap of cells (columns), ordered along DPT split by anatomical midbrain and hindbrain regions, for genes strongly correlated with DPT (rows). Cells are ordered from low to high DPT from left to right for the hindbrain region, and ordered from high to low DPT from left to right for the midbrain region. Gene names in red correspond to inferred gene expression.
Extended Data Fig. 9
Extended Data Fig. 9. Surrounding mesoderm of the developing gut tube.
(a) Joint UMAP of Nowotschin et al., Han et al. and seqFISH expression data, with cells colored by dataset. (b) as in (A) with cells colored by corresponding Gastrulation atlas cell type (automatically inferred for cells not coming from the seqFISH dataset). (c) as in (A) with cells colored by mesodermal and endodermal subtype for the Han et al. dataset, and all other cells colored in grey. (d) Spatial graphs of gut tube and surrounding mesodermal cells, colored by inferred gut tube subtype and mesodermal subtypes respectively. (e) Density graphs of seqFISH mesodermal cells ordered along physical anterior to posterior axis, split by embryo (rows), and mesoderm cluster and position along dorsal-ventral axis (columns). (f) Spatial graph of cells corresponding to gut tube subtypes Lung 1 and Lung 2, as well as surrounding mesodermal cells. (g) Scatterplot of log-fold changes corresponding to tests for differential expression between ventral (Lung 1) and dorsal (Lung 2) endodermal cells (x-axis), and ventral and dorsal mesodermal cells (y-axis) for all seqFISH genes. Significant (two-sample t-test, FDR-adjusted P-value < 0.05 and absolute LFC > 0.2) genes are labeled, and colored according to the comparison in which they are selected. (h) Spatial graphs of expression of selected genes among those differentially expressed between dorsal and ventral subgroups.
Extended Data Fig. 10
Extended Data Fig. 10. Comparison between dorsal and ventral side of developing gut tube.
(a) Spatial map of cells corresponding to the developing gut tube for embryo 2. Scale bar 250 µm. (b) as in A, for embryo 3. (c) Spatial map of anatomical foregut cells for embryos 1, 2, and 3, virtually dissected to correspond to the dorsal (orange) and ventral (purple) regions of the developing gut tube. Black lines correspond to the fitted principal curve model for each embryo and developing gut tube region, where cells are ordered from anterior to posterior using these models. Scale bars 250 µm. (d) Barplot showing relative proportion of cells in ventral or dorsal anatomical region of the developing hindgut, split by classification of developing gut tube subtype. Black points correspond to relative proportions for each individual embryo. (e) Anterior-posterior ranking of embryo 2 cells, corresponding to each gut tube subtype, split into dorsal and ventral regions. Bar color corresponds to the mapping score associated with classification into the subtype. (f) as in E for embryo 3. (g) Scatterplot of anterior-posterior logistic regression prediction error rate (y-axis) for each contiguous pair of developing gut tube subtypes (x-axis), split into dorsal and ventral anatomical regions, for each embryo. A higher prediction error rate corresponds to a higher level of relative mixing of subtypes along the anterior-posterior axis, while a lower prediction error rate corresponds to more distinct and separate arrangement of subtypes along the anterior-posterior axis. (h) Spatial expression of Tbx1 only in the developing gut tube for embryos 2 (top) and 3 (bottom). Scale bar 250 µm. (i) as in H for gene Osr1. (j) ‘Digital in situ’ showing detected mRNA molecules for Tbx1 (red) and Shh (cyan) for embryos 2 (top) and 3 (bottom). Scale bar 250 µm. (k) as in J for genes Smoc2 (red) and Tbx3 (cyan). (l) as in J for genes Smoc2 (red) and Gata3 (cyan). (m) ‘Digital in situ’ showing detected mRNA molecules for Smoc2 (red) and Gata3 (cyan) for embryo 1. Scale bar 250 µm. (n) Multiplexed mRNA imaging of whole-mount E8.75 mouse embryo using hybridization chain reaction (HCR) of Smoc2 (red) and Gata3 (cyan). Image is representative and were repeated independently on N = 2 embryos with similar results.

References

    1. Argelaguet R, et al. Multi-omics profiling of mouse gastrulation at single-cell resolution. Nature. 2019;576:487–491. - PMC - PubMed
    1. Nowotschin S, et al. The emergent landscape of the mouse gut endoderm at single-cell resolution. Nature. 2019;569:361–367. - PMC - PubMed
    1. Han L, et al. Single cell transcriptomics identifies a signaling network coordinating endoderm and mesoderm diversification during foregut organogenesis. Nat. Commun. 2020;11:4158. - PMC - PubMed
    1. Arnold SJ, Robertson EJ. Making a commitment: cell lineage allocation and axis patterning in the early mouse embryo. Nat. Rev. Mol. Cell Biol. 2009;10:91–103. - PubMed
    1. Tam PPL, Behringer RR. Mouse gastrulation: the formation of a mammalian body plan. Mech. Dev. 1997;68:3–25. - PubMed

Publication types