. 2021 Aug 19:13:707950.
doi: 10.3389/fnagi.2021.707950. eCollection 2021.

Oxidative Phosphorylation Is Dysregulated Within the Basocortical Circuit in a 6-month old Mouse Model of Down Syndrome and Alzheimer's Disease

Affiliations

Oxidative Phosphorylation Is Dysregulated Within the Basocortical Circuit in a 6-month old Mouse Model of Down Syndrome and Alzheimer's Disease

Melissa J Alldred et al. Front Aging Neurosci. .

Abstract

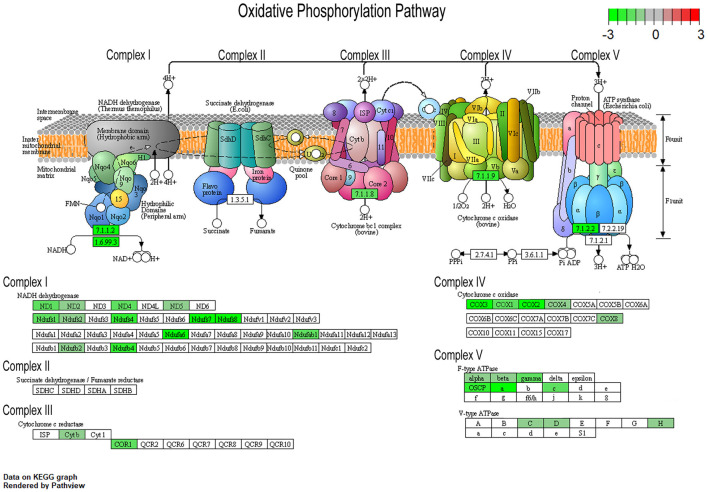
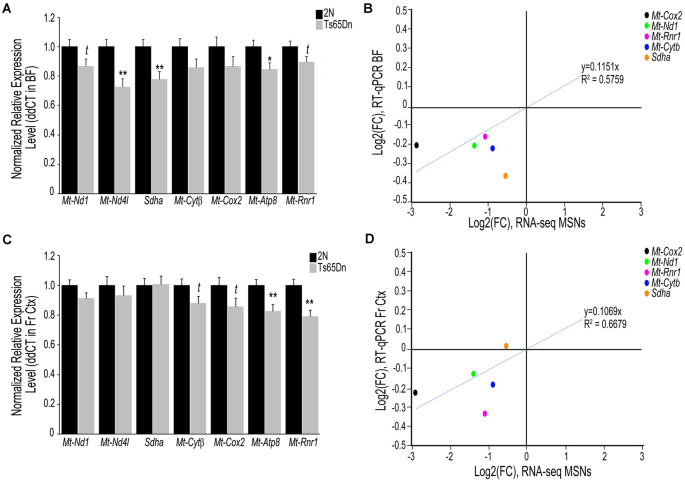
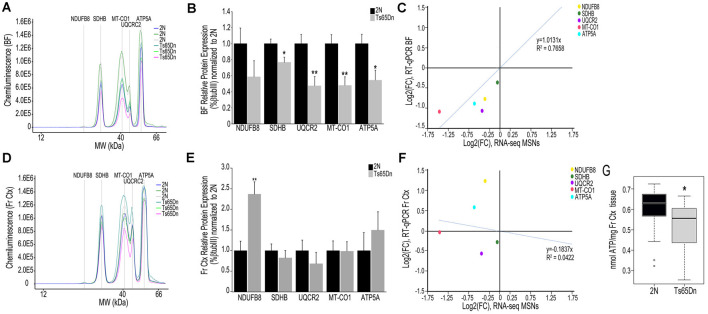
Down syndrome (DS) is the primary genetic cause of intellectual disability (ID), which is due to the triplication of human chromosome 21 (HSA21). In addition to ID, HSA21 trisomy results in a number of neurological and physiological pathologies in individuals with DS, including progressive cognitive dysfunction and learning and memory deficits which worsen with age. Further exacerbating neurological dysfunction associated with DS is the concomitant basal forebrain cholinergic neuron (BFCN) degeneration and onset of Alzheimer's disease (AD) pathology in early mid-life. Recent single population RNA sequencing (RNA-seq) analysis in the Ts65Dn mouse model of DS, specifically the medial septal cholinergic neurons of the basal forebrain (BF), revealed the mitochondrial oxidative phosphorylation pathway was significantly impacted, with a large subset of genes within this pathway being downregulated. We further queried oxidative phosphorylation pathway dysregulation in Ts65Dn mice by examining genes and encoded proteins within brain regions comprising the basocortical system at the start of BFCN degeneration (6 months of age). In select Ts65Dn mice we demonstrate significant deficits in gene and/or encoded protein levels of Complex I-V of the mitochondrial oxidative phosphorylation pathway in the BF. In the frontal cortex (Fr Ctx) these complexes had concomitant alterations in select gene expression but not of the proteins queried from Complex I-V, suggesting that defects at this time point in the BF are more severe and occur prior to cortical dysfunction within the basocortical circuit. We propose dysregulation within mitochondrial oxidative phosphorylation complexes is an early marker of cognitive decline onset and specifically linked to BFCN degeneration that may propagate pathology throughout cortical memory and executive function circuits in DS and AD.

Keywords: Alzheimer’s disease; Down syndrome; basal forebrain; oxidative phosphorylation; selective vulnerability.


Conflict of interest statement

The authors declare that the research was conducted in the absence of any commercial or financial relationships that could be construed as a potential conflict of interest.

Figures

Figure 1
Figure 1
Pronounced downregulation of members of the oxidative phosphorylation pathway in trisomic basal forebrain cholinergic neurons (BFCNs). The Kyoto Encyclopedia of Genes and Genomes (KEGG) derived oxidative phosphorylation pathway is rendered by Pathview, with significantly dysregulated genes highlighted for each complex from the medial septal nucleus (MSN) BFCNs as assayed by single population RNA-seq (Alldred et al., 2021). Downregulation is shown as color coded log fold change difference (LFC) with green depicting downregulation and red depicting upregulation. Note no genes within the oxidative phosphorylation pathway were upregulated.
Figure 2
Figure 2
Interrogation of oxidative phosphorylation Complex I-V subunit gene expression within the trisomic basocortical circuit. RT-qPCR was performed to determine gene expression levels using regional dissections of the basal forebrain (BF; A,B) and Fr Ctx (C,D) from Ts65Dn and 2N littermates at ~6 MO for six genes. (A) Bar graph represents ddCT of each gene normalized to 2N levels in the BF. Significant downregulation was found for Mt-Nd4l, Sdha, and Mt-Atp8 and trend-level downregulation was found for Mt-Nd1, Mt-Cytβ, and Mt-Rnr1. (B) Correlation plot association between MSN BFCN RNA-seq LFC (x-axis) and BF RT-qPCR LFC (y-axis). (C) Bar graph represents ddCT of each gene normalized to 2N levels in the Fr Ctx. Significant downregulation was found for Mt-Atp8 and Mt-Rnr1 and trend-level downregulation was found for Mt-Cytβ and Mt-Cox2. (D) Correlation plot association between MSN BFCN RNA-seq LFC (x-axis) and Fr Ctx RT-qPCR LFC (y-axis). While most genes were not significantly downregulated by RT-qPCR, they trended in the same direction (downregulation). Sdha was the only gene that did not correlate with RNA-seq results. Black bars represent relative 2N expression and gray bars indicate Ts65Dn expression normalized to 2N for each gene (standard error of mean (SEM) is indicated by error bars). Key: *p < 0.05, **p < 0.01; t, trend.
Figure 3
Figure 3
Interrogation of oxidative phosphorylation Complex I-V subunit protein expression within the trisomic basocortical circuit. (A) Representative digital signatures of each assayed protein raw expression levels (y-axis) and molecular weight (x-axis) from Ts65Dn and 2N BF tissue homogenates. (B) Bar graph represents relative protein levels (normalized to beta-tubulin (βTubIII) as a percentage of 2N expression in BF tissue homogenates. Black bars represent 2N and gray bars indicate Ts65Dn (SEM indicated by error bars). (C) Correlation plot association between MSN BFCN RNA-seq LFC (x-axis) and BF protein level LFC (y-axis) indicating a high correlation. (D) Representative digital signatures of each assayed protein raw expression levels (y-axis) and molecular weight (x-axis) from Ts65Dn and 2N Fr Ctx tissue homogenates. (E) Bar graph represents relative protein levels (normalized to βTubIII) as a percentage of 2N expression in Fr Ctx tissue homogenates (SEM indicated by error bars). (F) Correlation plot association between MSN BFCN RNA-seq LFC (x-axis) and Fr Ctx protein level LFC (y-axis) indicating no significant correlation. (G) Box and whisker plots highlight downregulation of ATP levels in trisomic Fr Ctx. Key: *p < 0.05, **p < 0.01.

References

    1. ABI (2004). “Guide to performing relative quantitation of gene expression using real-time quantitative PCR,” in Applied Biosystems Product Guide, 1–60.
    1. Ahmed M. M., Block A., Tong S., Davisson M. M., Gardiner K. J. (2017). Age exacerbates abnormal protein expression in a mouse model of down syndrome. Neurobiol. Aging 57, 120–132. 10.1016/j.neurobiolaging.2017.05.002 - DOI - PubMed
    1. Alldred M. J., Chao H. M., Lee S. H., Beilin J., Powers B. E., Petkova E., et al. . (2018). CA1 pyramidal neuron gene expression mosaics in the Ts65Dn murine model of down syndrome and Alzheimer’s disease following maternal choline supplementation. Hippocampus 28, 251–268. 10.1002/hipo.22832 - DOI - PMC - PubMed
    1. Alldred M. J., Chao H. M., Lee S. H., Beilin J., Powers B. E., Petkova E., et al. . (2019). Long-term effects of maternal choline supplementation on CA1 pyramidal neuron gene expression in the Ts65Dn mouse model of down syndrome and Alzheimer’s disease. FASEB J. 33, 9871–9884. 10.1096/fj.201802669RR - DOI - PMC - PubMed
    1. Alldred M. J., Che S., Ginsberg S. D. (2008). Terminal continuation (TC) RNA amplification enables expression profiling using minute RNA input obtained from mouse brain. Int. J. Mol. Sci. 9, 2091–2104. 10.3390/ijms9112091 - DOI - PMC - PubMed

LinkOut - more resources