. 2021 Aug 13:12:701227.
doi: 10.3389/fimmu.2021.701227. eCollection 2021.

Neutrophil Myeloperoxidase Derived Chlorolipid Production During Bacteria Exposure

Affiliations

Neutrophil Myeloperoxidase Derived Chlorolipid Production During Bacteria Exposure

Kaushalya Amunugama et al. Front Immunol. .

Abstract

Neutrophils are the most abundant white blood cells recruited to the sites of infection and inflammation. During neutrophil activation, myeloperoxidase (MPO) is released and converts hydrogen peroxide to hypochlorous acid (HOCl). HOCl reacts with plasmalogen phospholipids to liberate 2-chlorofatty aldehyde (2-ClFALD), which is metabolized to 2-chlorofatty acid (2-ClFA). 2-ClFA and 2-ClFALD are linked with inflammatory diseases and induce endothelial dysfunction, neutrophil extracellular trap formation (NETosis) and neutrophil chemotaxis. Here we examine the neutrophil-derived chlorolipid production in the presence of pathogenic E. coli strain CFT073 and non-pathogenic E. coli strain JM109. Neutrophils cocultured with CFT073 E. coli strain and JM109 E. coli strain resulted in 2-ClFALD production. 2-ClFA was elevated only in CFT073 coculture. NETosis is more prevalent in CFT073 cocultures with neutrophils compared to JM109 cocultures. 2-ClFA and 2-ClFALD were both shown to have significant bactericidal activity, which is more severe in JM109 E. coli. 2-ClFALD metabolic capacity was 1000-fold greater in neutrophils compared to either strain of E. coli. MPO inhibition reduced chlorolipid production as well as bacterial killing capacity. These findings indicate the chlorolipid profile is different in response to these two different strains of E. coli bacteria.

Keywords: 2-chlorofatty acid; 2-chlorofatty aldehyde; E. coli; inflammation; myeloperoxidase; neutrophils; plasmalogen.


Conflict of interest statement

The authors declare that the research was conducted in the absence of any commercial or financial relationships that could be construed as a potential conflict of interest.

Figures

Figure 1
Figure 1
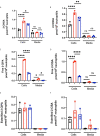
2-ClFALD and 2-ClFA production in cocultures of neutrophils with CFT073 and JM109 E. coli strains. 2x10⁶/ml neutrophils were incubated with either no bacteria (control, black), or, CFT073 (red) or JM109 (blue) strains of E. coli at a neutrophil: E. coli ratio of 1:10 for 30 min at 37°C. 2-ClFALD (A) as well as free and esterified 2-ClFA (B) were quantified as described in “Materials and Methods”. Data are from three neutrophil donors (biological replicates, 1 female, 2 males). 2-ClHDA, 2-ClODA, 2-ClPA, and 2-ClSA are 2-chlorohexadecanal, 2-chlorooctadecanal, 2-chloropalmitic acid and 2-chlorostearic acid, respectively. Multiple comparisons were performed using one-way ANOVA with Dunnett’s multiple comparison test. Error bars represent ± SD, p-value: ** < 0.01; * < 0.05.
Figure 2
Figure 2
Chlorolipids are cell-associated in neutrophils cocultured with E. coli. 2x10⁶/ml neutrophils were incubated with either no bacteria (control, black), or, CFT073 (red) or JM109 (blue) strains of E. coli at a neutrophil: E. coli ratio of 1:10 for 30 min at 37°C. Cells were pelleted, and 2-ClFALD molecular species (A, B) and 2-ClFA molecular species (C–F) were quantified as described in “Material and Methods”. 2-ClHDA, 2-ClODA, 2-ClPA, and 2-ClSA are 2-chlorohexadecanal, 2-chlorooctadecanal, 2-chloropalmitic acid and 2-chlorostearic acid, respectively. Multiple comparisons were performed using one-way ANOVA with Tukey’s multiple comparison test. Data represent n=3, error bars for ± SD, p-value: ****< 0.0001; **< 0.01; * < 0.05. ns indicates not significant.
Figure 3
Figure 3
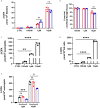
Neutrophil killing mechanisms of E. coli. (A) 2x10⁶/ml of neutrophils were cocultured with either CFT073 (red) or JM109 (blue) at a ratio of neutrophil: E.coli 1:10 for 30min at 37°C. Some coculture experiments were performed with neutrophils pretreated with 10mM ATZ for 5min or 10µg/ml cyD for 15 min. Bacteria survival % was calculated compared to control bacteria. p-value: ****< 0.0001, comparison between each treatment versus 100% survival control. p-value: ††<0.01, comparison between neutrophil coculture JM109 and coculture CFT073 cells. (B) Neutrophils were cocultured with pH sensitive pHrodo deep red labeled CFT073 or JM109 at neutrophil: E. coli ratio of 1:10 as well as in the presence of cyD. Phagocytic response is graphed as % max RFU as described in “Material and methods”. cyD treated CFT073 (red open squares) and JM (blue open squares) data overlap in the graph. (C) ecDNA % was measured in the co-cultures and control neutrophils (black) in experiments with two different neutrophil donors by the Sytox green assay as described in “Materials and Methods” (mean ± SD, n=3). (D) 1x10⁶ cells of either CFT073 or JM109 strains were incubated for 30 min with isolated 50ng/ml of NETs or NETs pretreated with 100U/ml DNase as indicated. Treatment condition with NETs was further incubated with 100U/ml DNase for 10 min prior to plating on LB plates. Bacterial survival (%) was calculated from CFU/ml relative to control bacteria not exposed to NETs. Values represent the mean ± SD for n=3. Statistics were performed using one-way ANOVA with Tukey’s multiple comparison test (A, C, D) and unpaired t-test for neutrophil coculture CFT073 versus JM109 in (B) p-value; ****< 0.0001; ***< 0.001; **< 0.01; * < 0.05.
Figure 4
Figure 4
Coculture conditions induce NETosis. 2x10⁶/ml of neutrophils were seeded on coverslips and co-incubated with 20x106/ml CFT073 or JM109 or without bacteria for the indicated time durations at 37°C. Following incubation cells were fixed, permeabilized and stained with immunofluorescence for DNA with DAPI (blue), MPO (red) and E. coli (green) as mentioned in materials and methods. (A) Large field representation with 15 panels in gray scale using blue channel to show the extent of the NET formation. Scale bar is 50µm. (B) 3D representations of confocal data of fifteen 100x tiles of CFT073 cocultures at 30 min. Scale bar 20 µm. (C) A zoomed in area on a net (B). The overlap between DAPI (which is made slightly transparent to visualize internal co-localization) and bacteria are seen as a teal color. Overlap between MPO and DAPI appears purple.
Figure 5
Figure 5
Bactericidal activity of chlorolipids. 50x106/ml of CFT073 (red) and JM109 (blue) cells were incubated with indicated concentrations of either 2-chlorohexadecanal (clear bars, A), hexadecanal (hatched bars, A), 2-chloropalmitic acid (clear bars, B), or palmitic acid (hatched bars, B) for 1hr at 37°C. Bacterial survival (%) was determined by calculating CFU/ml over vehicle control bacteria. Values represent the mean ± SD for n=3. Statistics were performed ANOVA within each concentration tested. p-value: ****< 0.0001; ***< 0.001; **< 0.01; *< 0.05 for comparisons for each lipid compared to control (no lipid addition). ††††< 0.0001; †††< 0.001; ††< 0.01 for comparisons at each concentration for each lipid between treatments of JM109 and CFT073 cells. ‡‡‡‡< 0.0001; ‡‡‡< 0.001; ‡‡< 0.01 for comparisons at each concentration between chlorolipid and non-chlorolipid treatments.
Figure 6
Figure 6
2-ClFALD metabolism in host cells and bacteria. (A) Indicated concentrations of the 2-ClFALD molecular species, 2-chlorohexadecanal, in 0.1% EtOH in HBSS media were exogenously provided to 50 x106/ml CFT073 (red) and JM109 (blue) cells for 1h at 37°C. Metabolized free 2-chloropalmitic acid (2-ClPA) was measured as described in “Material and Methods”. (B) Following indicated 2-chlorohexadecanal treatments for 1h, CFT073 and JM109 viability was measured using Live/Dead Baclight Bacterial viability kit as described in “Material and Methods”. Percent survival was calculated relative to the control bacteria. (C) Neutrophils (1x10⁶/ml) or (D) EA hy296 cells (EA) were incubated with indicated concentrations 2-chlorohexadecanal for 1h at 37°C to determine conversion to 2-ClPA. (E) Neutrophils were cocultured with either CFT073 (red) or JM109 (blue) with exogenously provided 2-chlorohexadecanal for 30 min and 2-ClPA was measured. Control neutrophils are in black. Statistics were done using unpaired t-test (A, B) and one-way ANOVA with Tukey’s multiple comparison test (C–E). Error bars represents ± SD, n=3, p-value: ****< 0.0001; ***< 0.001; **< 0.01; * < 0.05. ns indicates not significant.
Figure 7
Figure 7
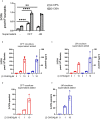
Coculture supernatants amplify 2-ClFA production. 2x10⁶/ml neutrophils were cocultured with 20x106/ml CFT073 or JM109 for 30 min at 37°C and the cells were pelleted. (A) The supernatants of CFT073 coculture or JM109 coculture were added to 1x10⁶/ml neutrophils for 1hr at 37°C and free 2-chloropalmitic acid (2-ClPA) and 2-chlorostearic acid (2-ClSA) were measured. (B, C) CFT073 coculture supernatant or JM109 coculture supernatant was added to 50x106/ml of CFT073 (red) or JM109 (blue) and incubated with exogenous 2-chlorohexadecanal (2-ClHDA) for 1hr at 37°C and 2-ClPA was measured. (D, E) CFT073 or JM109 coculture supernatants were incubated with exogenous 2-ClHDA (0.1% EtOH) for 1 hour at 37°C without bacteria and 2-ClPA was measured. Each condition was performed with n=3 replicates. Statistics were done using one-way ANOVA with Tukey’s multiple comparison test. Error bars represents ± SD, p-value: ****< 0.0001; **< 0.01.
Figure 8
Figure 8
Coculture 2-ClFALD and 2-ClFA production can be inhibited by blocking MPO. 2x10⁶/ml neutrophils were pretreated with 10mM ATZ for 5min and incubated with either no bacteria (control, black), or, CFT073 (red) or JM109 (blue) strains of E. coli at a neutrophil: E. coli ratio of 1:10 for 30 min at 37°C. 2-Chlorohexadecanal (2-ClHDA, A) and 2-chloropalmitic acid (2-ClPA, B) were quantified as described in “Material and Methods. Multiple comparisons were performed using one-way ANOVA with Tukey’s multiple comparison test. Data represents n=3, error bars for ± SD, p-value: ****< 0.0001; **< 0.01; *< 0.05.

References

    1. Papayannopoulos V. Neutrophil Extracellular Traps in Immunity and Disease. Nat Rev Immunol (2018) 18(2):134–47. 10.1038/nri.2017.105 - DOI - PubMed
    1. Harrison JE, Schultz J. Studies on the Chlorinating Activity of Myeloperoxidase. J Biol Chem (1976) 251(5):1371–4. 10.1016/S0021-9258(17)33749-3 - DOI - PubMed
    1. Hazen SL, Hsu FF, Duffin K, Heinecke JW. Molecular Chlorine Generated by the Myeloperoxidase-Hydrogen Peroxide-Chloride System of Phagocytes Converts Low Density Lipoprotein Cholesterol Into a Family of Chlorinated Sterols. J Biol Chem (1996) 271(38):23080–8. 10.1074/jbc.271.38.23080 - DOI - PubMed
    1. Pattison DI, Davies MJ. Reactions of Myeloperoxidase-Derived Oxidants With Biological Substrates: Gaining Chemical Insight Into Human Inflammatory Diseases. Curr Med Chem (2006) 13(27):3271–90. 10.2174/092986706778773095 - DOI - PubMed
    1. Pattison DI, Hawkins CL, Davies MJ. What Are the Plasma Targets of the Oxidant Hypochlorous Acid? A Kinetic Modeling Approach. Chem Res Toxicol (2009) 22(5):807–17. 10.1021/tx800372d - DOI - PubMed

Publication types