. 2021 Aug 19:12:696698.
doi: 10.3389/fpls.2021.696698. eCollection 2021.

Genome-Wide Characterization and Expression Analysis Provide Basis to the Biological Function of Cotton FBA Genes

Affiliations

Genome-Wide Characterization and Expression Analysis Provide Basis to the Biological Function of Cotton FBA Genes

Zhong-Qing Li et al. Front Plant Sci. .

Abstract

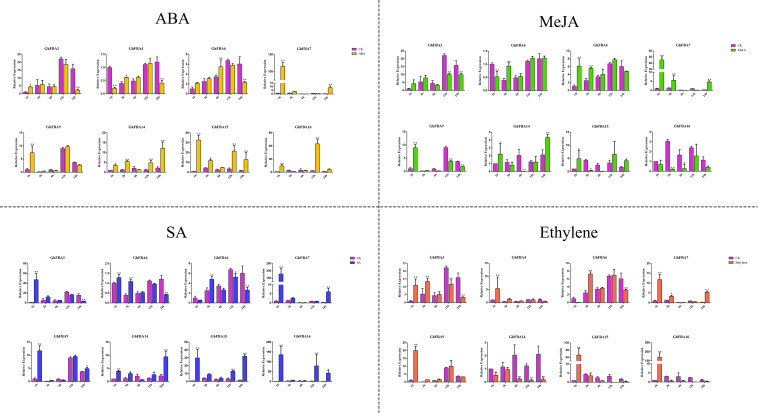
Fructose-1,6-biphosphate aldolase (FBA) is a multifunctional enzyme in plants, which participates in the process of Calvin-Benson cycle, glycolysis and gluconeogenesis. Despite the importance of FBA genes in regulating plant growth, development and abiotic stress responses, little is known about their roles in cotton. In the present study, we performed a genome-wide identification and characterization of FBAs in Gossypium hirsutum. Totally seventeen GhFBA genes were identified. According to the analysis of functional domain, phylogenetic relationship, and gene structure, GhFBA genes were classified into two subgroups. Furthermore, nine GhFBAs were predicted to be in chloroplast and eight were located in cytoplasm. Moreover, the promoter prediction showed a variety of abiotic stresses and phytohormone related cis-acting elements exist in the 2k up-stream region of GhFBA. And the evolutionary characteristics of cotton FBA genes were clearly presented by synteny analysis. Moreover, the results of transcriptome and qRT-PCR analysis showed that the expression of GhFBAs were related to the tissue distribution, and further analysis suggested that GhFBAs could respond to various abiotic stress and phytohormonal treatments. Overall, our systematic analysis of GhFBA genes would not only provide a basis for the understanding of the evolution of GhFBAs, but also found a foundation for the further function analysis of GhFBAs to improve cotton yield and environmental adaptability.

Keywords: Calvin-Benson cycle; FBA; cotton; evolution; expression profiles.


Conflict of interest statement

The authors declare that the research was conducted in the absence of any commercial or financial relationships that could be construed as a potential conflict of interest.

Figures

FIGURE 1
FIGURE 1
Subcellular location of GhFBAs in tobacco epidermal cells. GhFBAs-eGFP and empty control vector (35S-eGFP) were transiently expressed in tobacco epidermal cells. And the fluorescent signal was collected by confocal microscope.
FIGURE 2
FIGURE 2
An unrooted phylogenetic tree representing relationships among FBA proteins from G. hirsutum (Gh), G. arboreum (Ga), G. raimondii (Gr), A. thaliana (At), T. aestivum (Ta), O. sativa (Os) and S. lycopersicum (Sl). The different colors arcs indicate different classes or subclasses. Clustal W was used to align the sequences, MEGA7.0 was used to construct phylogenetic trees with neighbor-joining method.
FIGURE 3
FIGURE 3
Phylogenetic relationships, gene structure and architecture of conserved protein motifs in FBA genes from G. hirsutum (Gh), G. arboreum (Ga) and G. raimondii (Gr). (A) The phylogenetic tree of all identified cotton FBA genes. Full-length protein sequences of FBA genes were used to generate the phylogenetic tree, and the different color squares represent phylogenetic subclasses. (B) Gene structure features of cotton FBA genes. Green boxes indicate exons, black lines indicate introns and yellow boxes indicate 3′ and 5′ untranslated regions. (C) The motif architecture of cotton FBA proteins.
FIGURE 4
FIGURE 4
Analysis of the responsive cis-acting elements in GhFBA genes promoter regions. The 2-kb sequences of GhFBA gene promoter regions were extracted and analyzed, and different cis-acting elements were color-coded in specific colors.
FIGURE 5
FIGURE 5
Chromosomal distribution and collinear correlations of FBA members of G. hirsutum (Gh), G. arboreum (Ga) and G. raimondii (Gr). The chromosome number is indicated by the alphanumeric codes within the circle, UN1 and UN2 represent the scaffold that contain FBA genes in G. arboreum and G. hirsutum, respectively. The blue lines indicate the duplicated FBA gene pairs within A subgenome and D subgenome of G. hirsutum, the orange lines represent the syntenic FBA gene pairs between G. hirsutum and other species, the green lines represent the syntenic FBA gene pairs between G. arboreum and G. raimondii.
FIGURE 6
FIGURE 6
Expression profiles of the GhFBA genes in various tissues. (A) Hierachical clustering of expression profiles of GhFBA genes in various tissues. The TPM values were perform treatment of log2(TPM + 1), then the results were used to visualize the heatmap. (B) Expression analysis of eight representative GhFBA genes in different tissues by qRT-PCR, and GhHIS gene was used as a reference gene, vertical bars indicate standard deviation.
FIGURE 7
FIGURE 7
Expression profiles of GhFBA genes under different stresses. (A) The log2(TPM + 1) values of TPM were used to create the heatmap, and z-score method was used to normalize the results by line. The transcript abundances were represented by color scales ranging from blue (low) to red (high). (B) Verification of the transcriptome data by qRT-PCR, GhHIS gene was used as reference gene, and asterisks indicate the significant differences between treatment groups and control groups (*P < 0.05, **P < 0.01, Student’s t-test).
FIGURE 8
FIGURE 8
Expression patterns of 8 selected GhFBA genes in response to phytohormone treatments. qRT-PCR was performed to analyze the relative expression levels, and GhHIS was used as a reference gene. Asterisks indicate the significant differences between treatment groups and control groups (*P < 0.05, **P < 0.01, Student’s t-test).
FIGURE 9
FIGURE 9
Pairwise correlation and co-regulatory networks of GhFBA genes. (A) Correlation analysis of GhFBA genes. The correlations were based on the PCC values and represented by the size and color of the circles. The squares with different colors were used to represent different subclasses. (B) Co-regulatory networks of GhFBA gene pairs with | PCC| > 0.5 and p-value <0.05. The edge lines with different colors represent the correlation levels of GhFBA gene pairs and the nodes with different colors indicate the information of different subclasses.

References

    1. Anderson L. E., Wang X., Gibbons J. T. (1995). Three enzymes of carbon metabolism or their antigenic analogs in pea leaf nuclei. Plant Physiol. 108 659–667. 10.1104/pp.108.2.659 - DOI - PMC - PubMed
    1. Bracher A., Whitney S., Hartl F., Hayer-Hartl M. (2017). Biogenesis and Metabolic Maintenance of Rubisco. Annu. Rev. Plant Biol. 68 29–60. 10.1146/annurev-arplant-043015-111633 - DOI - PubMed
    1. Bukowiecki A. C., Anderson L. E. (1974). Multiple forms of aldolase and triose phosphate isomerase in diverse plant species. Plant Sci. Lett. 3 381–386. 10.1016/0304-4211(74)90019-4 - DOI
    1. Cai B. (2017). Expression Pattern and Regulation of Fructose 1,6-Diphosphate Aldolase Gene on Photosynthesis in Tomato. Ph. D. Thesis. Shandong: Shandong Agricultural University.
    1. Cai B., Li Q., Liu F., Bi H., Ai X. (2018). Decreasing fructose-1,6-bisphosphate aldolase activity reduces plant growth and tolerance to chilling stress in tomato seedlings. Physiol. Plant 163 247–258. 10.1111/ppl.12682 - DOI - PubMed

LinkOut - more resources