. 2021 Aug 19:12:707904.
doi: 10.3389/fpls.2021.707904. eCollection 2021.

Arabidopsis-Based Dual-Layered Biological Network Analysis Elucidates Fully Modulated Pathways Related to Sugarcane Resistance on Biotrophic Pathogen Infection

Affiliations

Arabidopsis-Based Dual-Layered Biological Network Analysis Elucidates Fully Modulated Pathways Related to Sugarcane Resistance on Biotrophic Pathogen Infection

Hugo V S Rody et al. Front Plant Sci. .

Abstract

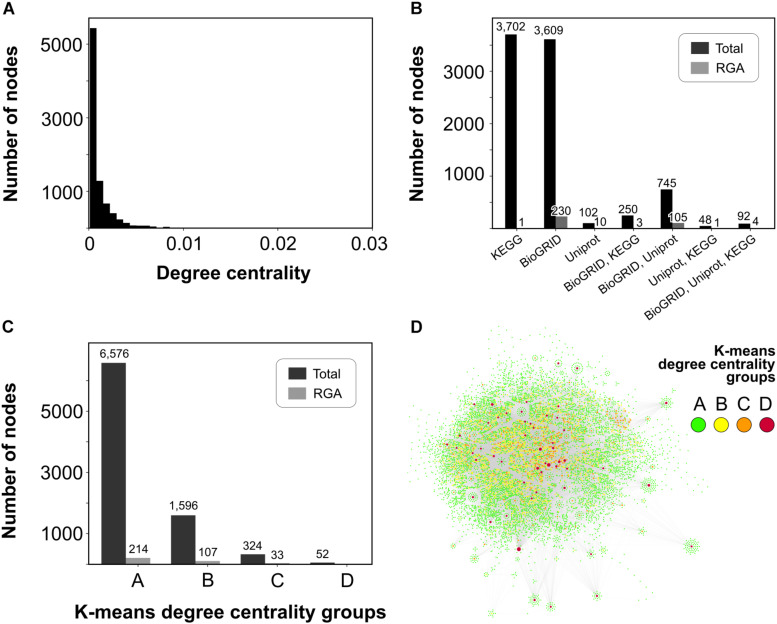
We assembled a dual-layered biological network to study the roles of resistance gene analogs (RGAs) in the resistance of sugarcane to infection by the biotrophic fungus causing smut disease. Based on sugarcane-Arabidopsis orthology, the modeling used metabolic and protein-protein interaction (PPI) data from Arabidopsis thaliana (from Kyoto Encyclopedia of Genes and Genomes (KEGG) and BioGRID databases) and plant resistance curated knowledge for Viridiplantae obtained through text mining of the UniProt/SwissProt database. With the network, we integrated functional annotations and transcriptome data from two sugarcane genotypes that differ significantly in resistance to smut and applied a series of analyses to compare the transcriptomes and understand both signal perception and transduction in plant resistance. We show that the smut-resistant sugarcane has a larger arsenal of RGAs encompassing transcriptionally modulated subnetworks with other resistance elements, reaching hub proteins of primary metabolism. This approach may benefit molecular breeders in search of markers associated with quantitative resistance to diseases in non-model systems.

Keywords: Saccharum; biological networks; biotrophic pathogens; data integration; data mining; transcriptome.


Conflict of interest statement

The authors declare that the research was conducted in the absence of any commercial or financial relationships that could be construed as a potential conflict of interest.

Figures

FIGURE 1
FIGURE 1
Overview of the sugarcane dual-layered network topology. (A) Histogram of degree centrality showing the majority of nodes with low values. (B) The number of nodes from each of the three interaction databases is used in this work. (C) The number of total nodes and nodes harboring RGA orthologs in each of the four K-means degree centrality groups of (A) less connected, (B) intermediate connected, (C) highly connected, and (D) super-connected nodes. (D) Graph view of the largest component of the sugarcane dual-layered network with nodes colored according to the legend.
FIGURE 2
FIGURE 2
Eleven MCODE core-periphery modules harboring nodes from all the four K-means degree centrality groups colored according to the legend. Black diamonds indicate modules harboring RGA nodes.
FIGURE 3
FIGURE 3
Graph overview of core-periphery MCODE module 42 (48 nodes and 166 edges) alongside the expression profiles of genes within nodes from two sugarcane transcriptome experiments of IAC66-6 and SP80-3280. (A) IAC DEGs, (B) SP DEGs, (C) IAC GSEA leading-edge genes, (D) SP GSEA leading-edge genes. Node sizes represent centrality degree values. Node expression profiles are colored according to the legend, standing for not differentially expressed (DE), upregulated or downregulated, relative to sugarcane orthologs with the lowest p-value of each node in the two sugarcane transcriptome experiments. Node edges are colored according to the legend of the K-means degree centrality groups. Edges connecting DE nodes were also colored as gray, red, or blue, indicating the expression profile pattern of the node. GSEA signatures of IAC and SP in (E) and (F), respectively, show the module 42 gene set distribution.
FIGURE 4
FIGURE 4
Distribution of Saccharum spontaneum orthologs of RGAs identified as within core-periphery subnetworks and DE in each of the two sugarcane transcriptome experiments of (A) susceptible IAC66-6 genotype and (B) resistant SP08-3280 genotype. Colored dots within circles indicate the positions of RGA orthologs along eight chromosomes, as well as the colored traces in chromosome bars. Colors depict seven main orthogroups according to the legend, and gray color depicts orthologs from other orthogroups.

Similar articles

Cited by

References

    1. Altschul S. F., Gish W., Miller W., Myers E. W., Lipman D. J. (1990). Basic local alignment search tool. J. Mol. Biol. 215 403–410. 10.1016/S0022-2836(05)80360-2 - DOI - PubMed
    1. Bader G. D., Hogue C. W. V. (2003). An automated method for finding molecular complexes in large protein interaction networks. BMC Bioinformatics 4:2. 10.1186/1471-2105-4-2 - DOI - PMC - PubMed
    1. Bolton M. D. (2009). Primary metabolism and plant defense — fuel for the fire. Mol. Plant Microbe Interact. 22 487–497. - PubMed
    1. Boutet E., Lieberherr D., Tognolli M., Schneider M., Bairoch A. (2007). “UniProtKB/Swiss-Prot,” in Plant Bioinformatics, ed. Edwards D. (Totowa, NJ: Humana Press; ), 89–112. 10.1007/978-1-59745-535-0_4 - DOI - PubMed
    1. Bürstenbinder K., Mitra D., Quegwer J. (2017). Functions of IQD proteins as hubs in cellular calcium and auxin signaling: a toolbox for shape formation and tissue-specification in plants? Plant Signal. Behav. 12:e1331198. 10.1080/15592324.2017.1331198 - DOI - PMC - PubMed

LinkOut - more resources