

A Multi-Environment Trial Analysis of Frost Susceptibility in Wheat and Barley Under Australian Frost-Prone Field Conditions
- PMID: 34490019
- PMCID: PMC8417324
- DOI: 10.3389/fpls.2021.722637
A Multi-Environment Trial Analysis of Frost Susceptibility in Wheat and Barley Under Australian Frost-Prone Field Conditions
Abstract
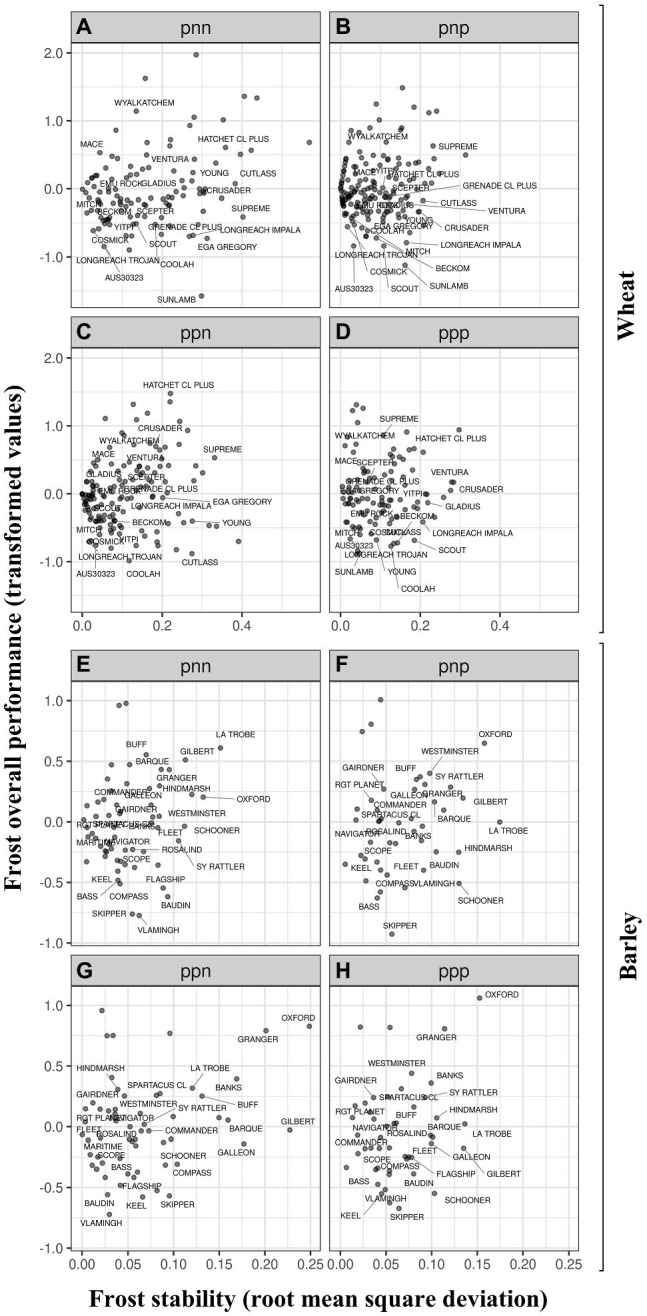
Low temperatures during the flowering period of cereals can lead to floret sterility, yield reduction, and economic losses in Australian crops. In order to breed for improved frost susceptibility, selection methods are urgently required to identify novel sources of frost tolerant germplasm. However, the presence of genotype by environment interactions (i.e. variety responses to a change in environment) is a major constraint to select the most appropriate varieties in any given target environment. An advanced method of analysis for multi-environment trials that includes factor analytic selection tools to summarize overall performance and stability to a specific trait across the environments could deliver useful information to guide growers and plant breeding programs in providing the most appropriate decision making-strategy. In this study, the updated selection tools approached in this multi-environment trials (MET) analysis have allowed variety comparisons with similar frost susceptibility but which have a different response to changes in the environment or vice versa. This MET analysis included a wide range of sowing dates grown at multiple locations from 2010 to 2019, respectively. These results, as far as we are aware, show for the first-time genotypic differences to frost damage through a MET analysis by phenotyping a vast number of accurate empirical measurements that reached in excess of 557,000 spikes. This has resulted in a substantial number of experimental units (10,317 and 5,563 in wheat and barley, respectively) across a wide range of sowing times grown at multiple locations from 2010 to 2019. Varieties with low frost overall performance (OP) and low frost stability (root mean square deviation -RMSD) were less frost susceptible, with performance more consistent across all environments, while varieties with low OP and high RMSD were adapted to specific environmental conditions.
Keywords: Hordeum vulgare L.; Triticum aestivum; factor analytic selection tool; genotype by environment interactions (GEI); interaction classes; spike fertility; spring radiation frost.
Copyright © 2021 Ferrante, Cullis, Smith and Able.
Conflict of interest statement
The authors declare that the research was conducted in the absence of any commercial or financial relationships that could be construed as a potential conflict of interest.
Figures


References
-
- Al-Issawi M., Rihan H. Z., El-Sarkassy N., Fuller M. P. (2013). Frost hardiness expression and characterisation in wheat at ear emergence. J. Agron. Crop Sci. 199, 66–74. 10.1111/j.1439-037X.2012.00524.x - DOI
-
- Arisnabarreta S., Miralles D. J. (2006). Yield responsiveness in two- and six-rowed barley grown in contrasting nitrogen environments. J. Agron. Crop Sci. 192, 178–185. 10.1111/j.1439-037X.2006.00203.x - DOI
-
- Arisnabarreta S., Miralles D. J. (2008). Critical period for grain number establishment of near isogenic lines of two- and six-rowed barley. Field Crop Res. 107, 196–202. 10.1016/j.fcr.2008.02.009 - DOI
-
- Arisnabarreta S., Miralles D. J. (2010). Nitrogen and radiation effects during the active spike-growth phase on floret development and biomass partitioning in 2- and 6-rowed barley isolines. Crop Pasture Sci. 61, 578–587. 10.1071/CP09292 - DOI
-
- Bailey R. A. (2008). Design of Comparative Experiments. UK: Cambridge University Press.
LinkOut - more resources
Full Text Sources
Miscellaneous