. 2021 Aug 19:11:713561.
doi: 10.3389/fonc.2021.713561. eCollection 2021.

A 14-Marker Multiplexed Imaging Panel for Prognostic Biomarkers and Tumor Heterogeneity in Head and Neck Squamous Cell Carcinoma

Affiliations

A 14-Marker Multiplexed Imaging Panel for Prognostic Biomarkers and Tumor Heterogeneity in Head and Neck Squamous Cell Carcinoma

Junichi Mitsuda et al. Front Oncol. .

Abstract

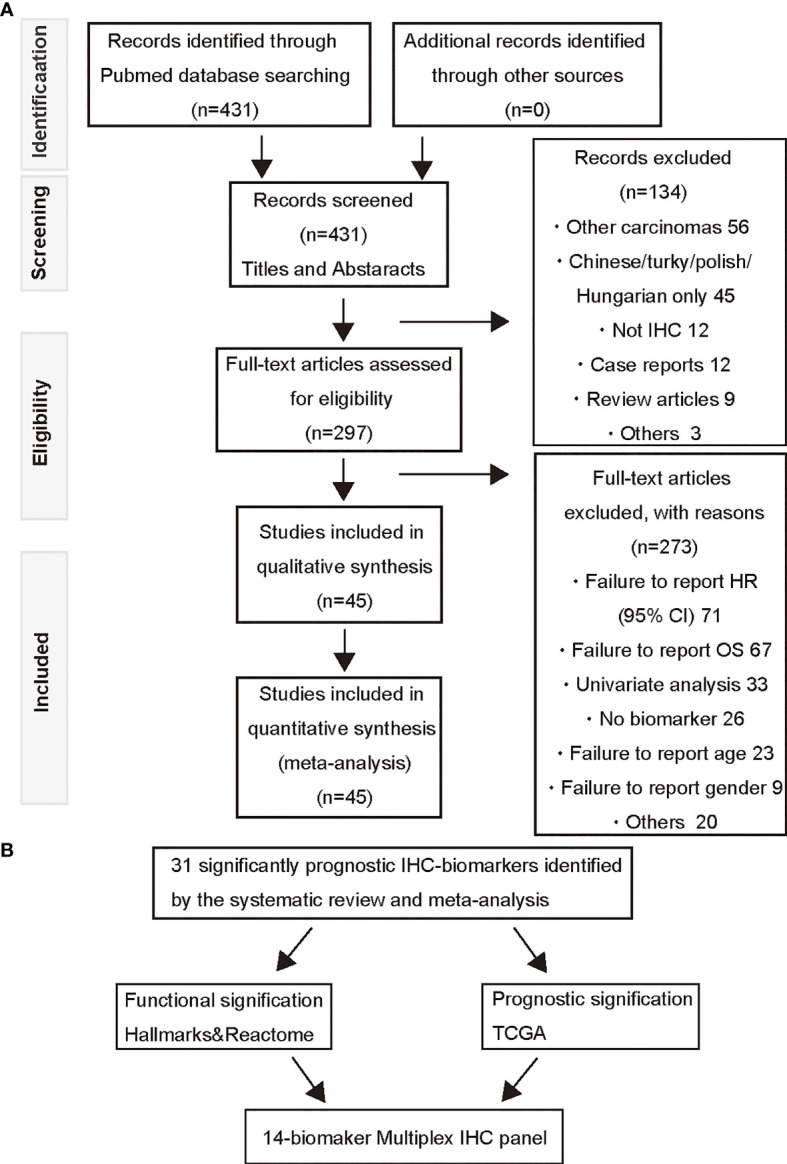
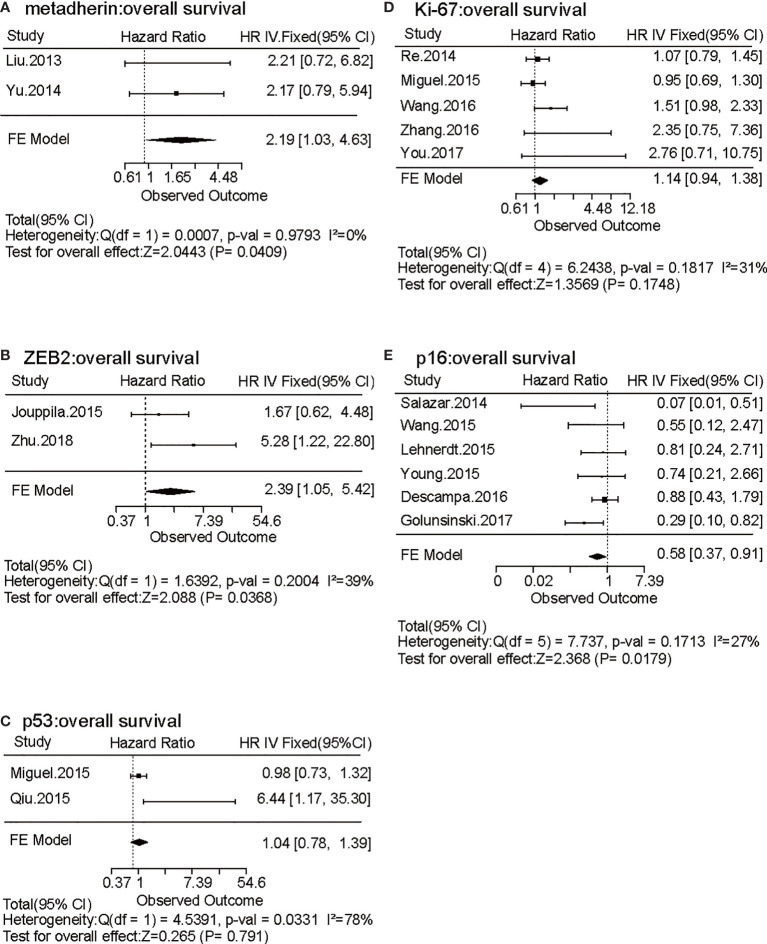
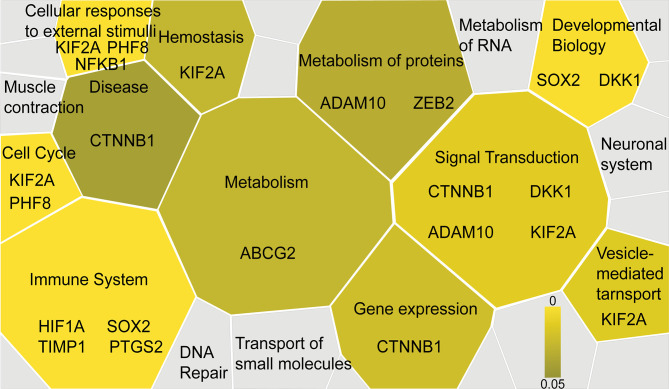
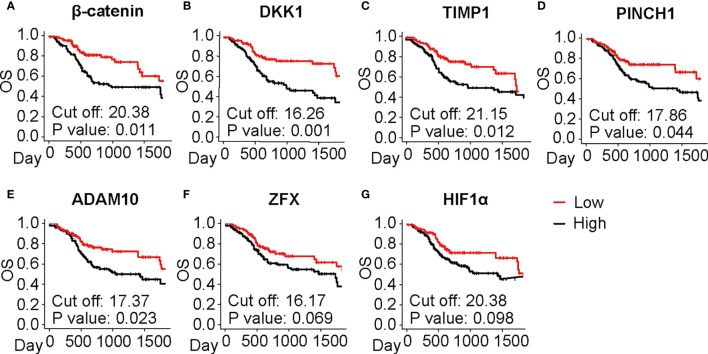
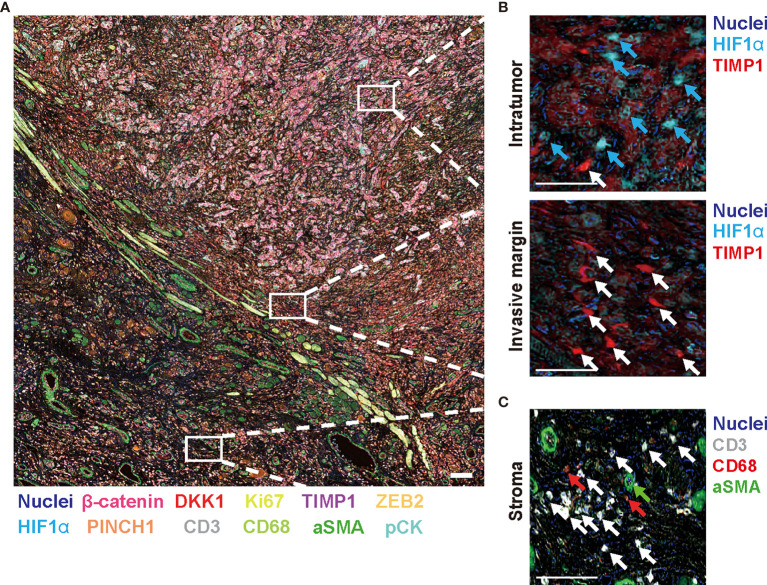
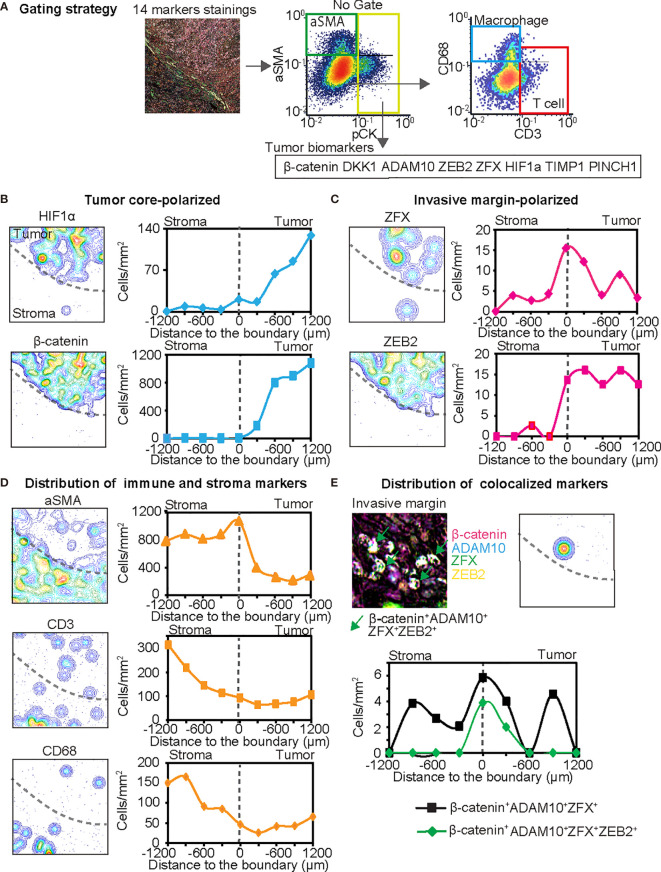
Recent advances made in treatment for head and neck squamous cell carcinoma (HNSCC) highlight the need for new prediction tools to guide therapeutic strategies. In this study, we aimed to develop a HNSCC-targeting multiplex immunohistochemical (IHC) panel that can evaluate prognostic factors and the intratumor heterogeneity of HNSCC. To identify IHC-based tissue biomarkers that constitute new multiplex IHC panel, a systematic review and meta-analysis were performed to analyze reported IHC biomarkers in laryngeal and pharyngeal SCC in the period of 2008-2018. The Cancer Genome Atlas (TCGA) and Reactome pathway databases were used to validate the prognostic and functional significance of the identified biomarkers. A 14-marker chromogenic multiplex IHC panel including identified biomarkers was used to analyze untreated HNSCC tissue. Forty-five high-quality studies and thirty-one candidate tissue biomarkers were identified (N = 7062). Prognostic validation in TCGA laryngeal and pharyngeal SCC cohort (N = 205) showed that β-catenin, DKK1, PINCH1, ADAM10, and TIMP1 were significantly associated with poor prognosis, which were related to functional categories such as immune system, cellular response, cell cycle, and developmental systems. Selected biomarkers were assembled to build a 14-marker panel, evaluating heterogeneity and polarized expression of tumor biomarkers in the tissue structures, which was particularly related to activation of Wnt/β-catenin pathway. Integrated IHC analysis based on a systemic review and meta-analysis provides an in situ proteomics tool to assess the aggressiveness and intratumor heterogeneity of HNSCC.

Keywords: biomarker; head and neck squamous cell carcinoma (HNSCC); immunohistochemistry; meta-analysis; tumor heterogeneity.


Conflict of interest statement

HO is an employee for SCREEN Holdings Co., Ltd. KI has received research funding from SCREEN Holdings Co., Ltd. The remaining authors declare that the research was conducted in the absence of any commercial or financial relationships that could be construed as a potential conflict of interest.

Figures

Figure 1
Figure 1
A PRISMA flow diagram of the systematic review of IHC-based prognostic biomarkers and multiplex IHC panel selection. (A) A prisma flow diagram presents the PubMed searches, the number of manuscripts excluded, and the identified high-quality cohort studies. (B) Selection strategies based on prognostic and functional significance are applied for establishment of the 14-biomaker multiplex IHC panel.
Figure 2
Figure 2
Forest plots of the effects of five biomarkers evaluated by two or more independent studies on laryngeal and pharyngeal HNSCC survival. (A–E) Forest plots of hazard ratio (HR) for overall survival (OS) of metadherin (A), ZEB2 (B), p53 (C), Ki-67 (D), and p16 (E) are shown based on a fixed effect model. Bars present 95% confidence intervals (CI) of HR, and the center of the lozenge gives the combined HR. Combined fixed effect HRs and tests for heterogeneity (I2) are based on the generic inverse variance (I-V) method.
Figure 3
Figure 3
Functional significance of the selected IHC biomarkers identified by the systematic review and meta-analysis. Functional significance of the identified IHC biomarkers is visualized by using the Reactome pathway database (https://reactome.org), reporting on biological pathways associated with dataset of genes. The results are visualized as a Voronoi diagram, showing an overview of the biological pathways related to the 31 biomarkers identified by the systematic review and meta-analysis. Significantly enriched pathways are shown with a color scale from dark to light yellow. IHC biomarkers associated with each pathway are shown.
Figure 4
Figure 4
Prognostic significance of the selected IHC biomarkers identified by the systematic review and meta-analysis. (A–G) Kaplan-Meier analyses of overall survival (OS) in the laryngeal and pharyngeal HNSCC cohort of the Cancer Genome Atlas (TCGA) (N = 205) stratified by gene expression of the identified biomarkers are shown. Median is used for the cutoff values. Statistical significance is determined using log-rank test.
Figure 5
Figure 5
Fourteen-marker multiplex IHC panel to visualize prognostic tumor cell biomarkers and immune/stromal cells in a single FFPE tissue. A FFPE tissue of tongue SCC is visualized by the established 14-marker multiplex IHC. (A) Representative 12-color composite images are shown. Biomarkers and colors are shown at the bottom. Scale bar = 100 µm. (B) Top and bottom panels present expression of HIF1α and TIMP1 in the intratumor and invasive margin regions, respectively. Blue and white arrows depict HIF1α+ cells and TIMP1+ cells, respectively. (C) Immune markers (CD3 and CD68) and aSMA+ cells in stroma region are shown. White, red, and green arrows present CD3+, CD68+, and aSMA+ cells, respectively. Biomarkers and colors are shown at the right. Scale bars = 10 µm. Corresponding single-marker images are shown in Supplementary Figure 3.
Figure 6
Figure 6
The 14-biomarker multiplex IHC panel quantitatively assesses intratumoral heterogeneity of HNSCC. (A) The gating strategy used for single cell-based chromogenic signal intensity is shown where cell size/area, and location are utilized for density plots similar to flow cytometry. X and y axes were shown on a logarithmic scale. The gating strategies identified cell populations of pCK+ tumor cells with selected tumor cell biomarkers such as β-catenin, DKK1, ADAM10, ZEB2, ZFX, HIF1α, TIMP1, and PINCH1, together with aSMA+ cells (pCKaSMA+), T cells (pCKaSMACD3+) and macrophages (pCKaSMACD68+) in a single tissue. (B–D) Left panels depict contour mapping based on cell density of each marker. Dash lines present the invasive margin between tumor cell nests and stroma. Right panels depict cell densities of identified lineages in every 200 µm-width from stroma to the tumor side. Tumor cell biomarkers are classified into tumor core-polarized (B), and invasive margin-polarized markers, in comparison with immune and stroma markers (D). (E) IHC image and pixel density contour graph indicate distribution of colocalized markers at the invasive margin. Line graph show two colocalized markers. Black line shows β-catenin+ DKK1+ ADAM10+ ZFX+ cells and green line showed β-catenin+ DKK1+ ADAM10+ ZFX+ ZEB2+ cells.

Similar articles

Cited by

References

    1. Bray F, Ferlay J, Soerjomataram I, Siegel RL, Torre LA, Jemal A. Global Cancer Statistics 2018: GLOBOCAN Estimates of Incidence and Mortality Worldwide for 36 Cancers in 185 Countries. CA Cancer J Clin (2018) 68:394–424. 10.3322/caac.21492 - DOI - PubMed
    1. Mroz EA, Tward AD, Pickering CR, Myers JN, Ferris RL, Rocco JW. High Intratumor Genetic Heterogeneity Is Related to Worse Outcome in Patients With Head and Neck Squamous Cell Carcinoma. Cancer (2013) 119:3034–42. 10.1002/cncr.28150 - DOI - PMC - PubMed
    1. Puram SV, Rocco JW. Molecular Aspects of Head and Neck Cancer Therapy. Hematol Oncol Clin North Am (2015) 29:971–92. 10.1016/j.hoc.2015.07.003 - DOI - PMC - PubMed
    1. Mroz EA, Rocco JW. Intra-Tumor Heterogeneity in Head and Neck Cancer and Its Clinical Implications. World J Otorhinolaryngol Neck Surg (2016) 2:60–7. 10.1016/j.wjorl.2016.05.007 - DOI - PMC - PubMed
    1. Easwaran H, Tsai HC, Baylin SB. Cancer Epigenetics: Tumor Heterogeneity, Plasticity of Stem-Like States, and Drug Resistance. Mol Cell (2014) 54:716–27. 10.1016/j.molcel.2014.05.015 - DOI - PMC - PubMed