Meta-Analysis
. 2021 Aug 18:9:705916.
doi: 10.3389/fpubh.2021.705916. eCollection 2021.

Cholesterol and Triglyceride Concentrations, COVID-19 Severity, and Mortality: A Systematic Review and Meta-Analysis With Meta-Regression

Affiliations
Meta-Analysis

Cholesterol and Triglyceride Concentrations, COVID-19 Severity, and Mortality: A Systematic Review and Meta-Analysis With Meta-Regression

Angelo Zinellu et al. Front Public Health. .

Abstract

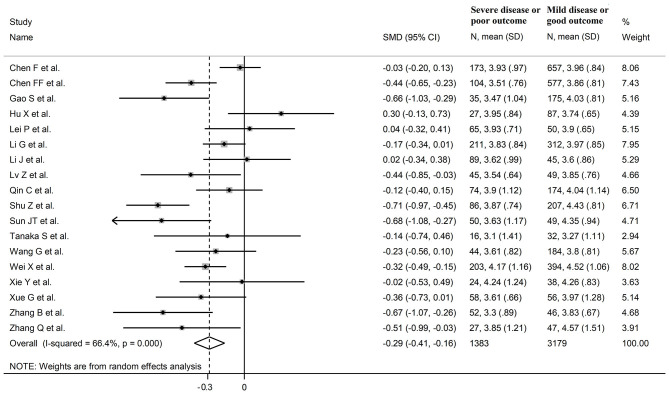
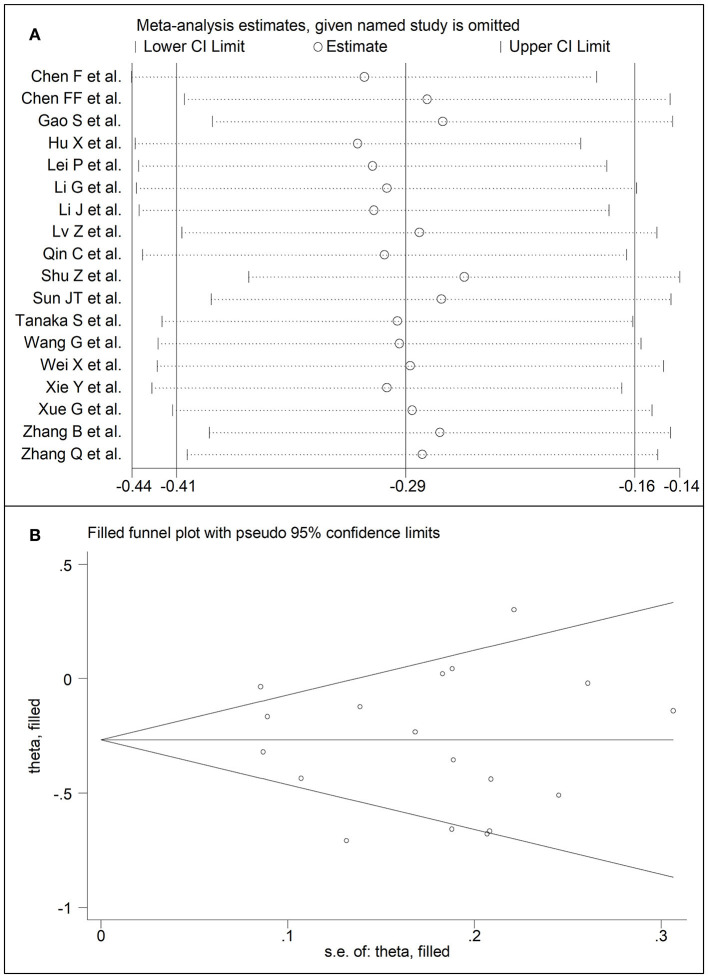
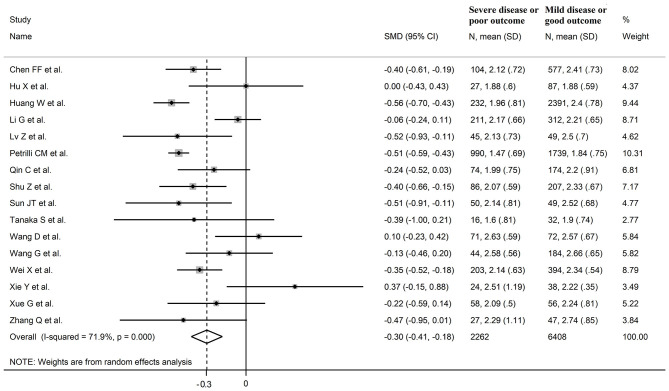
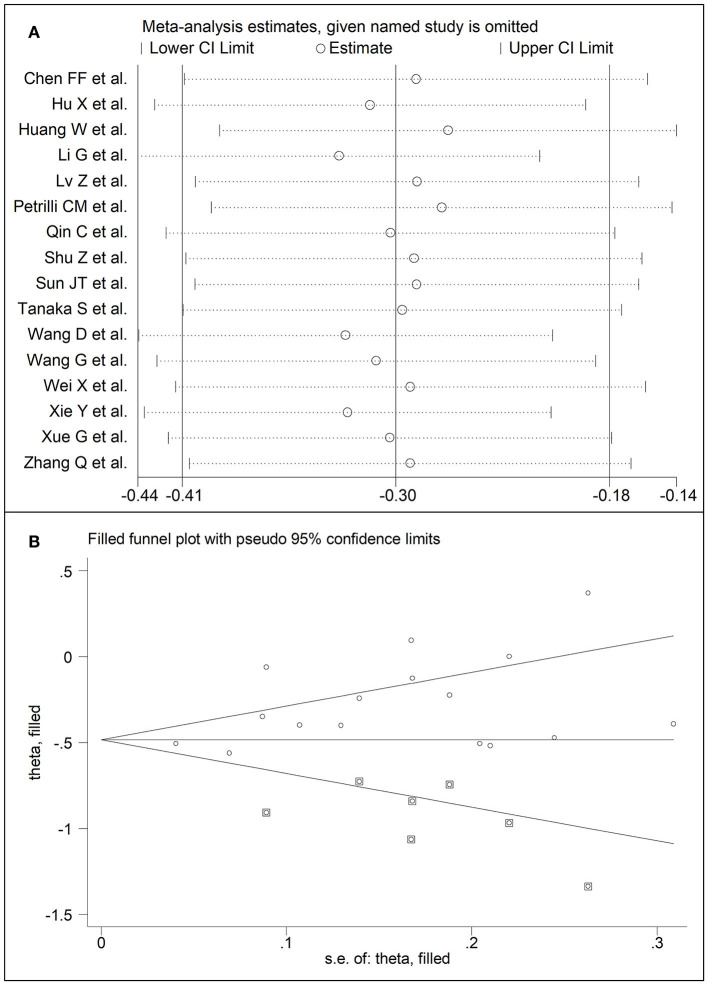
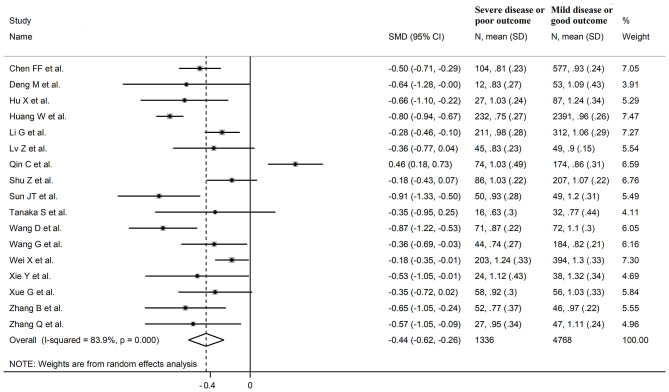
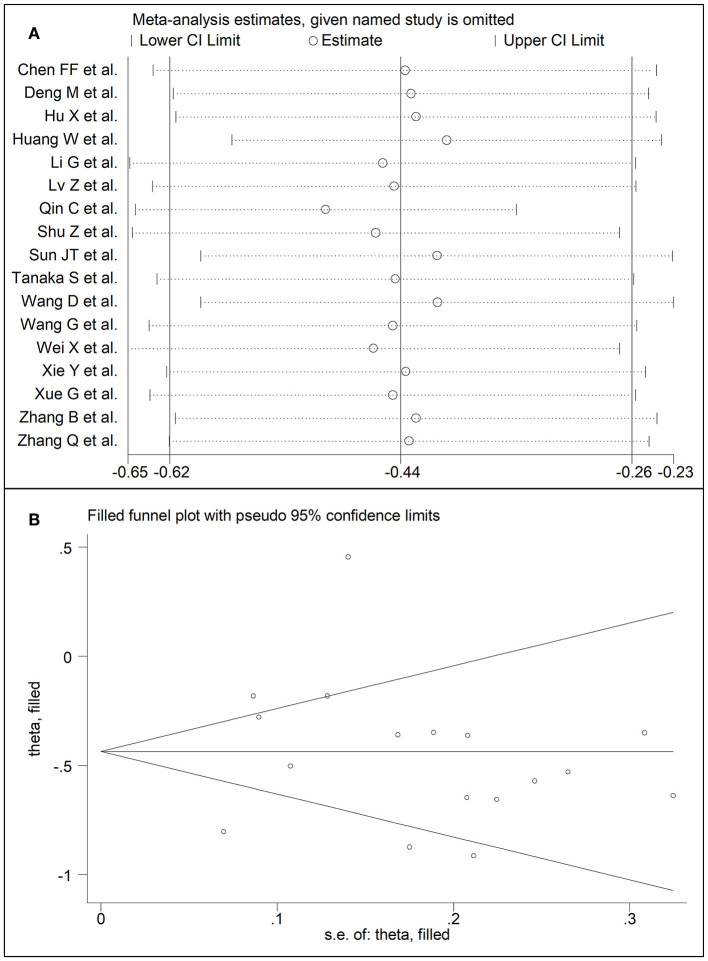
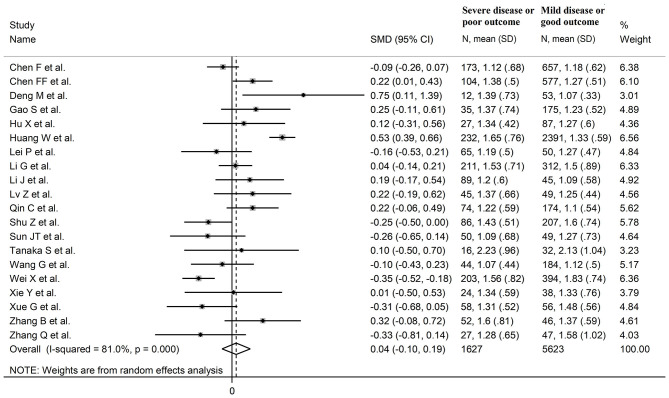
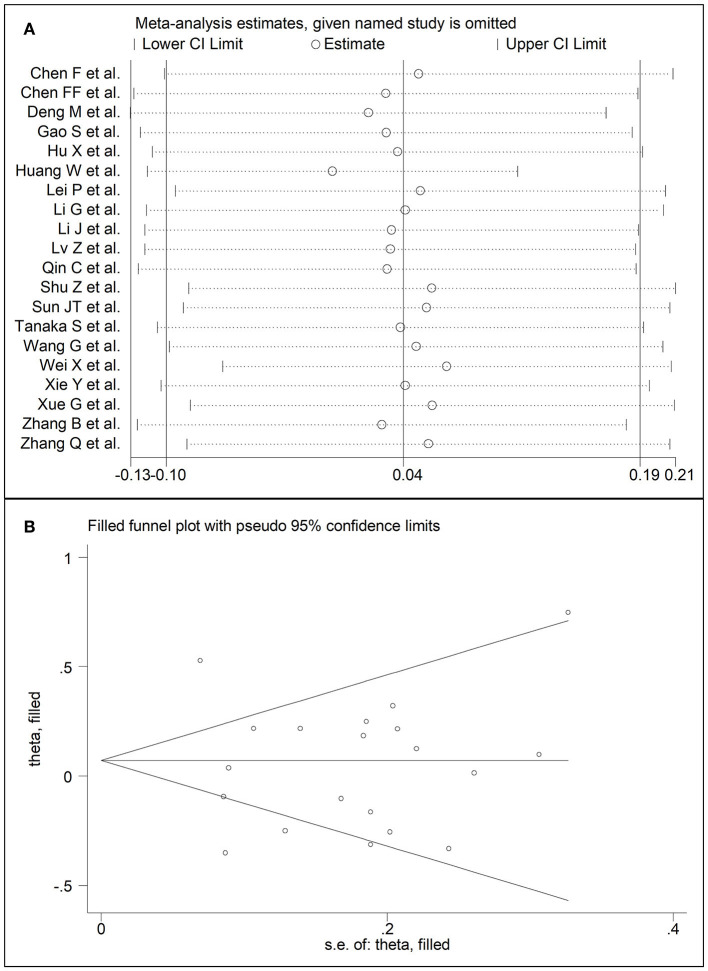
Lipid profile alterations have been observed in patients with coronavirus disease 2019 (COVID-19) in relation to disease severity and mortality. We conducted a systematic review and meta-analysis with meta-regression of studies reporting total, HDL, and LDL-cholesterol, and triglyceride concentrations in hospitalized patients with COVID-19. We searched PubMed, Web of Science and Scopus, between January 2020 and January 2021, for studies describing lipid concentrations, COVID-19 severity, and survival status (PROSPERO registration number: CRD42021253401). Twenty-two studies in 10,122 COVID-19 patients were included in the meta-analysis. Pooled results showed that hospitalized patients with severe disease or non-survivor status had significantly lower total cholesterol (standardized mean difference, SMD = -0.29, 95% CI -0.41 to -0.16, p < 0.001), LDL-cholesterol (SMD = -0.30, 95% CI -0.41 to -0.18, p < 0.001), and HDL-cholesterol (SMD = -0.44, 95% CI -0.62 to -0.26, p < 0.001), but not triglyceride (SMD = 0.04, 95% CI -0.10 to -0.19, p = 0.57), concentrations compared to patients with milder disease or survivor status during follow up. Between-study heterogeneity was large-to-extreme. In sensitivity analysis, the effect size of different lipid fractions was not affected when each study was in turn removed. The Begg's and Egger's t-tests did not show evidence of publication bias, except for studies investigating LDL-cholesterol. In meta-regression, significant associations were observed between the SMD of LDL-cholesterol and age and hypertension, and between the SMD of triglycerides and study endpoint and aspartate aminotransferase. In our systematic review and meta-analysis, lower total, HDL, and LDL-cholesterol, but not triglyceride, concentrations were significantly associated with COVID-19 severity and mortality. Cholesterol concentrations might be useful, in combination with other clinical and demographic variables, for risk stratification and monitoring in this group. Systematic Review Registration: PROSPERO registration number: CRD42021253401.

Keywords: COVID-19; cholesterol; disease severity; mortality; triglycerides.


Conflict of interest statement

The authors declare that the research was conducted in the absence of any commercial or financial relationships that could be construed as a potential conflict of interest.

Figures

Figure 1
Figure 1
Flow chart of study selection.
Figure 2
Figure 2
Forest plot of studies examining total cholesterol concentrations in COVID-19.
Figure 3
Figure 3
(A) Sensitivity analysis of the association between total cholesterol and COVID-19. The influence of individual studies on the overall standardized mean difference (SMD) is shown. The middle vertical axis indicates the overall SMD and the two vertical axes indicate the 95% confidence intervals (CIs). The hollow circles represent the pooled SMD when the remaining study is omitted from the meta-analysis. The two ends of each broken line represent the 95% CIs. (B) Funnel plot of studies investigating low vs. high severity or surviving vs. non-surviving status after trimming and filling. Dummy studies and genuine studies are represented by enclosed circles and free circles, respectively.
Figure 4
Figure 4
Forest plot of studies examining LDL-cholesterol concentrations in COVID-19.
Figure 5
Figure 5
(A) Sensitivity analysis of the association between LDL-cholesterol and COVID-19. The influence of individual studies on the overall standardized mean difference (SMD) is shown. The middle vertical axis indicates the overall SMD and the two vertical axes indicate the 95% confidence intervals (CIs). The hollow circles represent the pooled SMD when the remaining study is omitted from the meta-analysis. The two ends of each broken line represent the 95% CIs. (B) Funnel plot of studies investigating low vs. high severity or surviving vs. non-surviving status after trimming and filling. Dummy studies and genuine studies are represented by enclosed circles and free circles, respectively.
Figure 6
Figure 6
Forest plot of studies examining HDL-cholesterol concentrations in COVID-19.
Figure 7
Figure 7
(A) Sensitivity analysis of the association between HDL-cholesterol and COVID-19. The influence of individual studies on the overall standardized mean difference (SMD) is shown. The middle vertical axis indicates the overall SMD and the two vertical axes indicate the 95% confidence intervals (CIs). The hollow circles represent the pooled SMD when the remaining study is omitted from the meta-analysis. The two ends of each broken line represent the 95% CIs. (B) Funnel plot of studies investigating low vs. high severity or surviving vs. non-surviving status after trimming and filling. Dummy studies and genuine studies are represented by enclosed circles and free circles, respectively.
Figure 8
Figure 8
Forest plot of studies examining the concentrations of triglycerides in COVID-19.
Figure 9
Figure 9
(A) Sensitivity analysis of the association between serum triglycerides and COVID-19. The influence of individual studies on the overall standardized mean difference (SMD) is shown. The middle vertical axis indicates the overall SMD and the two vertical axes indicate the 95% confidence intervals (CIs). The hollow circles represent the pooled SMD when the remaining study is omitted from the meta-analysis. Two ends of each broken line represent the 95% CIs. (B) Funnel plot of studies investigating low vs. high severity or surviving vs. non-surviving status after trimming and filling. Dummy studies and genuine studies are represented by enclosed circles and free circles, respectively.

Similar articles

Cited by

References

    1. Huang C, Soleimani J, Herasevich S, Pinevich Y, Pennington KM, Dong Y, et al. . Clinical characteristics, treatment, and outcomes of critically ill patients with COVID-19: a scoping review. Mayo Clin Proc. (2021) 96:183–202. 10.1016/j.mayocp.2020.10.022 - DOI - PMC - PubMed
    1. Wynants L, Van Calster B, Collins GS, Riley RD, Heinze G, Schuit E, et al. . Prediction models for diagnosis and prognosis of covid-19 infection: systematic review and critical appraisal. BMJ. (2020) 369:m1328. 10.1101/2020.03.24.20041020 - DOI - PMC - PubMed
    1. Priesemann V, Balling R, Brinkmann MM, Ciesek S, Czypionka T, Eckerle I, et al. . An action plan for pan-European defence against new SARS-CoV-2 variants. Lancet. (2021) 397:469–70. 10.1016/S0140-6736(21)00150-1 - DOI - PMC - PubMed
    1. Meher G, Bhattacharjya S, Chakraborty H. Membrane cholesterol modulates oligomeric status and peptide-membrane interaction of severe acute respiratory syndrome coronavirus fusion peptide. J Phys Chem B. (2019) 123:10654–62. 10.1021/acs.jpcb.9b08455 - DOI - PubMed
    1. Kocar E, Rezen T, Rozman D. Cholesterol, lipoproteins, and COVID-19: basic concepts and clinical applications. Biochim Biophys Acta Mol Cell Biol Lipids. (2021) 1866:158849. 10.1016/j.bbalip.2020.158849 - DOI - PMC - PubMed