. 2021 Aug 20:9:710664.
doi: 10.3389/fcell.2021.710664. eCollection 2021.

G-Protein-Coupled Estrogen Receptor-1 Positively Regulates the Growth Plate Chondrocyte Proliferation in Female Pubertal Mice

Affiliations

G-Protein-Coupled Estrogen Receptor-1 Positively Regulates the Growth Plate Chondrocyte Proliferation in Female Pubertal Mice

Ya-Shuan Chou et al. Front Cell Dev Biol. .

Abstract

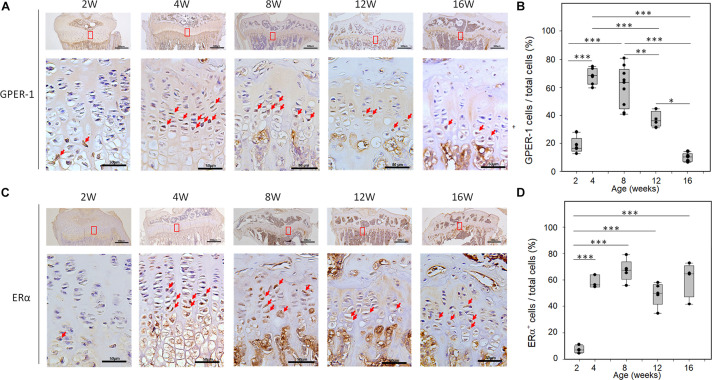
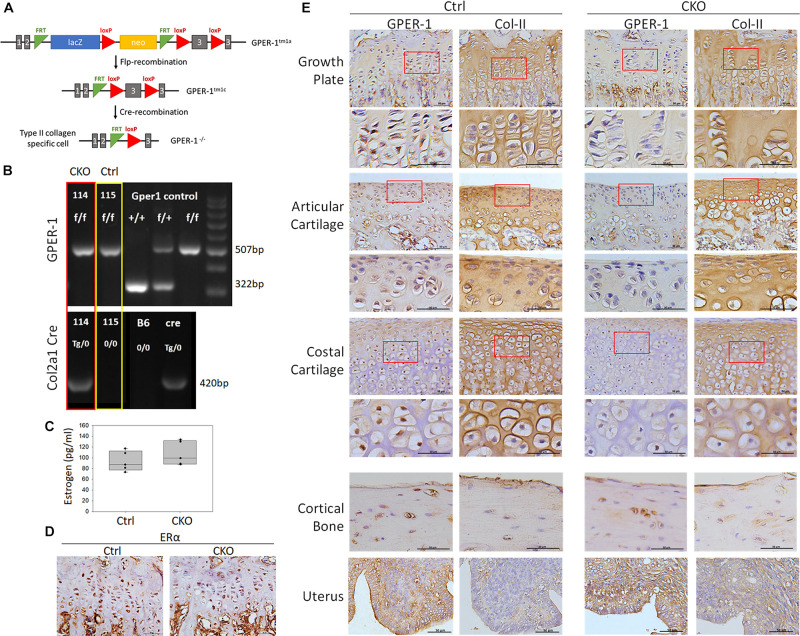
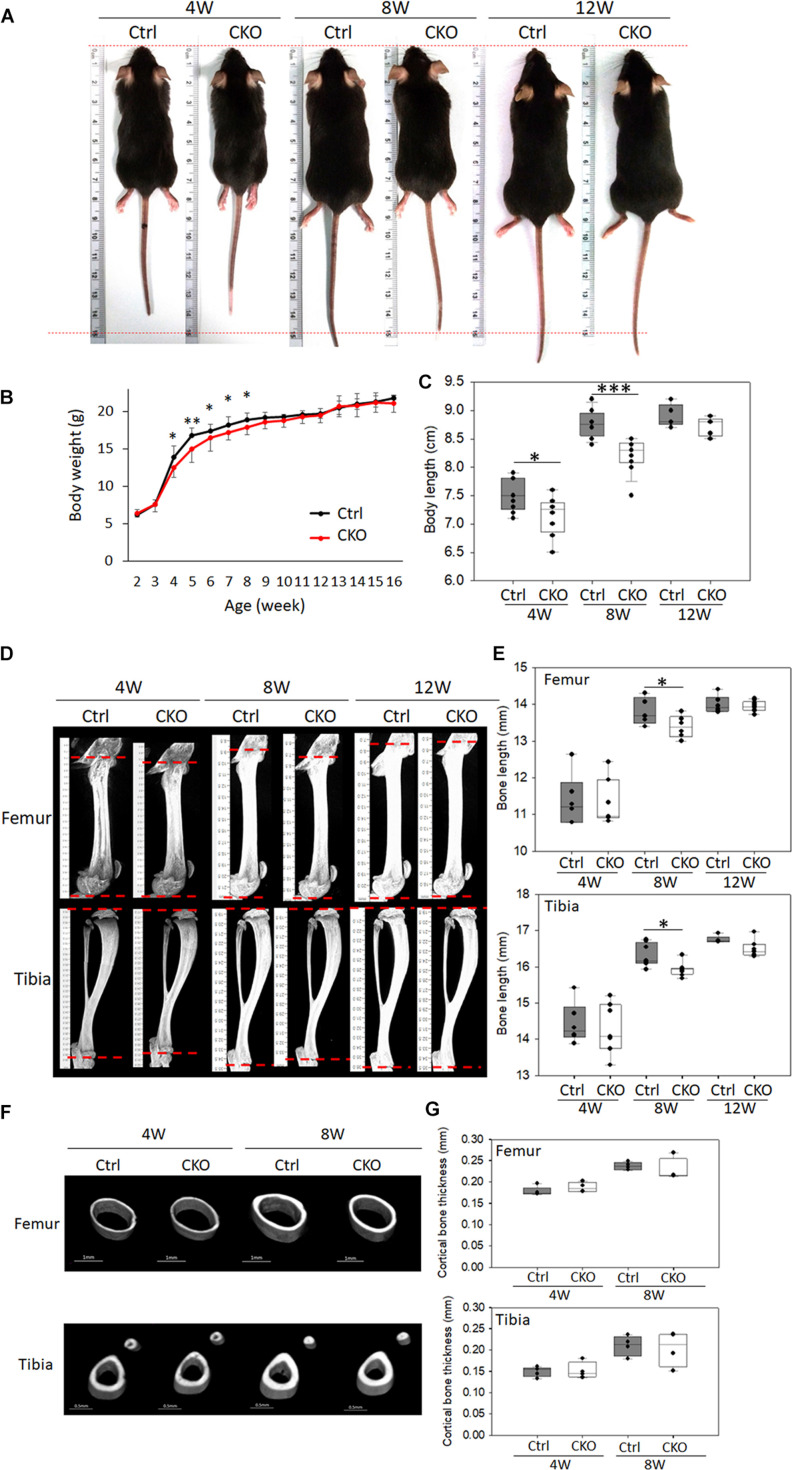
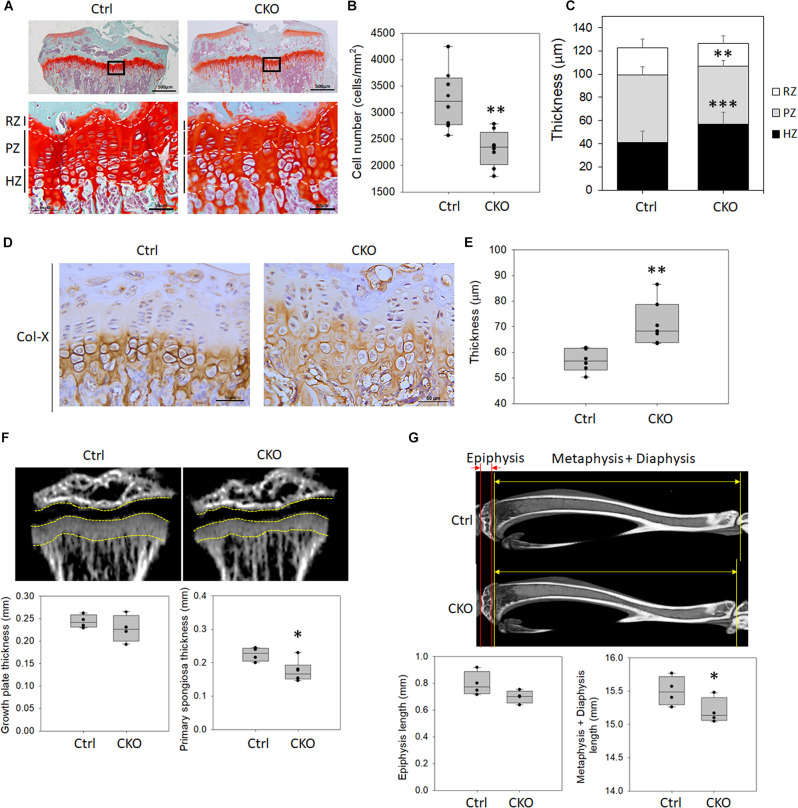
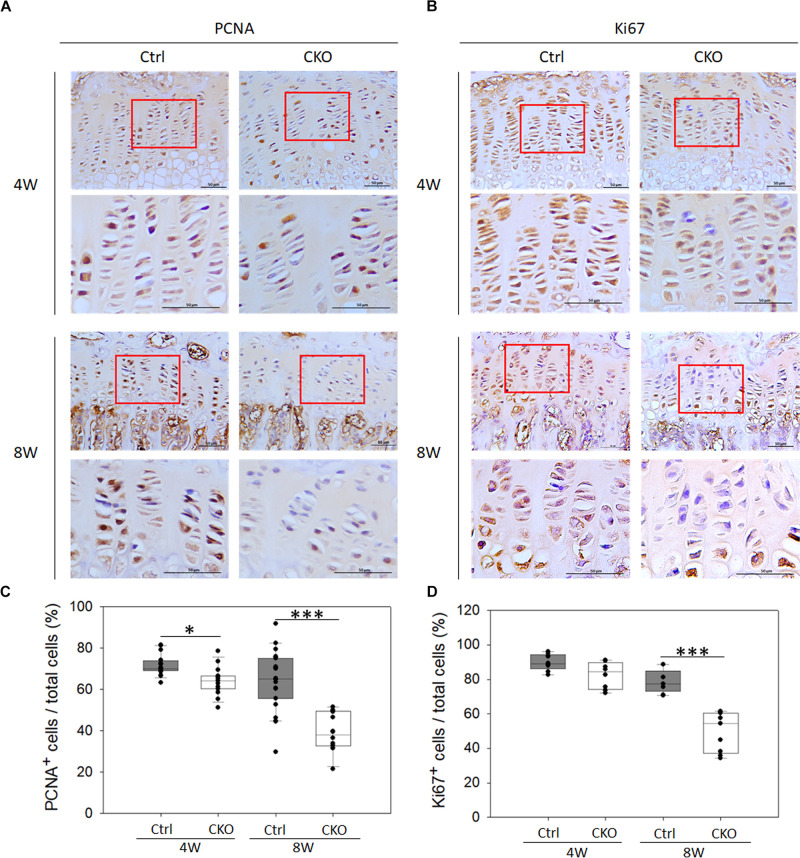
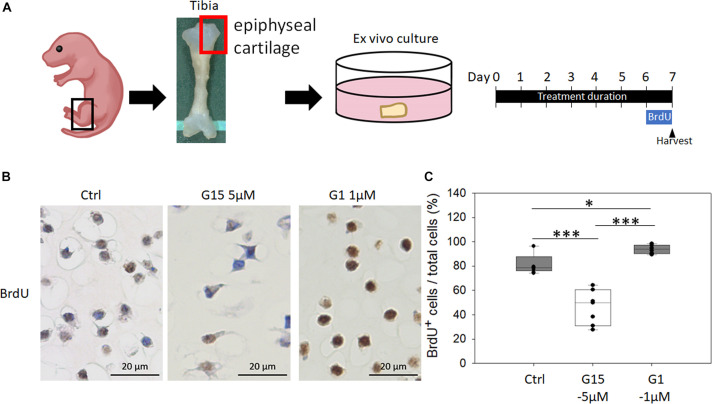
Estrogen enhances long bone longitudinal growth during early puberty. Growth plate chondrocytes are the main cells that contribute to long bone elongation. The role of G-protein-coupled estrogen receptor-1 (GPER-1) in regulating growth plate chondrocyte function remains unclear. In the present study, we generated chondrocyte-specific GPER-1 knockout (CKO) mice to investigate the effect of GPER-1 in growth plate chondrocytes. In control mice, GPER-1 was highly expressed in the growth plates of 4- and 8-week-old mice, with a gradual decline through 12 to 16 weeks. In CKO mice, the GPER-1 expression in growth plate chondrocytes was significantly lower than that in the control mice (80% decrease). The CKO mice also showed a decrease in body length (crown-rump length), body weight, and the length of tibias and femurs at 8 weeks. More importantly, the cell number and thickness of the proliferative zone of the growth plate, as well as the thickness of primary spongiosa and length of metaphysis plus diaphysis in tibias of CKO mice, were significantly decreased compared with those of the control mice. Furthermore, there was also a considerable reduction in the number of proliferating cell nuclear antigens and Ki67-stained proliferating chondrocytes in the tibia growth plate in the CKO mice. The chondrocyte proliferation mediated by GPER-1 was further demonstrated via treatment with a GPER-1 antagonist in cultured epiphyseal cartilage. This study demonstrates that GPER-1 positively regulates chondrocyte proliferation at the growth plate during early puberty and contributes to the longitudinal growth of long bones.

Keywords: G-protein-coupled estrogen receptor-1; bone growth; chondrocyte-specific knockout mice; estrogen receptor; long bone elongation.


Conflict of interest statement

The authors declare that the research was conducted in the absence of any commercial or financial relationships that could be construed as a potential conflict of interest.

Figures

FIGURE 1
FIGURE 1
Age-related changes of GPER-1 and ERα levels in tibia growth plates as determined via IHC staining. (A,C) Growth plate cartilage of tibias from 2-, 4-, 8-, 12-, and 16-week-old mice were stained for GPER-1 and ERα. Representative micrographs of growth plates at low (scale bars, 500 μm) and high (scale bars, 50 μm) magnification. (B,D) Image-J analysis of percentage of GPER-1- and Erα-positive cells from total number of hematoxylin-stained cells (total cells). Each group, N = 5. P < 0.05, ∗∗P < 0.01, ∗∗∗P < 0.001.
FIGURE 2
FIGURE 2
Generation of chondrocyte-specific GPER-1 knockout (CKO) mice using Cre/loxP system. (A) Schematic diagram of producing Col2a1-Cre; GPER-1f/f mice. (B) Genotyping of Col2a1-Cre and GPER-1 in control (Ctrl) and CKO mice. Genotyping of GPER-1 floxed allele amplified a 507-bp fragment, whereas GPER-1 wild-type allele produced a 322-bp fragment. Col2a1-Cre transgene produced a 420-bp fragment. Each group, N = 28–34. (C) Serum levels of estrogen showed no significant difference with GPER-1 deficiency. (D) IHC staining of ERα in tibia growth plates showed no significant difference between two groups. Scale bars, 50 μm. (E) GPER-1 and type II collagen (Col-II) were stained by IHC staining and analyzed in tibia growth plate, articular cartilage, costal cartilage, cortical bone, and uterus. Representative micrographs of growth plates at low and high magnification. Scale bars, 50 μm. Each group, N = 3–5.
FIGURE 3
FIGURE 3
Comparison of phenotypes between chondrocyte-specific GPER-1 knockout mice (CKO) and control mice (Ctrl). (A) General appearance of 4-, 8-, and 12-week-old female mice. (B) Body weight of CKO and Ctrl mice. (C) Body length (crown–rump length) of CKO and Ctrl mice. (D,E) Femur and tibia μ-CT images and length quantitation in 4-, 8-, and 12-week-old CKO and Ctrl mice. (F,G) Cortical bone thicknesses were analyzed via μ-CT. Each group, N = 6–8. P < 0.05, ∗∗P < 0.01, ∗∗∗P < 0.001.
FIGURE 4
FIGURE 4
Changes of growth plate development in chondrocyte-specific GPER-1 knockout (CKO) mice. (A) Tibial growth plates of 8-week-old female mice were stained with Safranin O/Fast Green staining. Representative micrographs of growth plates at low (scale bars, 500 μm) and high (scale bars, 50 μm) magnification. (B) Cell numbers were measured in CKO mice. (C) Thicknesses of resting zone, proliferation zone, and hyperopic zone were analyzed. (D) Hypertrophic zones of growth plates were stained via IHC to detect type X collagen (Col-X) in 8-week-old mice. Scale bars, 50 μm. (E) Thicknesses of type X collagen-stained hypertrophic zone were quantified. (F) Thicknesses of growth plate and primary spongiosa of 4-week-old mice were measured by μ-CT analysis. (G) Lengths of epiphysis and metaphysis plus diaphysis of 8-week-old mice were measured by μ-CT analysis. Each group, N = 4–8. P < 0.05, ∗∗P < 0.01, ∗∗∗P < 0.001. RZ: resting zone, PZ: proliferative zone, HZ: hypertrophic zone.
FIGURE 5
FIGURE 5
Effects of chondrocyte-specific GPER-1 knockout (CKO) on chondrocyte proliferation in tibia growth plates. (A,B) IHC staining of PCNA and Ki67 in tibial growth plates in 4- and 8-week-old female mice. Representative micrographs of growth plates at low and high magnification. Scale bars, 50 μm. (C,D) Quantification of ratio of proliferative cells to total cells was shown as ratio of PCNA- and Ki67-positive cells to hematoxylin-stained cells (total cells). Each group, N = 5. P < 0.05, ∗∗∗P < 0.001.
FIGURE 6
FIGURE 6
Effects of GPER-1 agonist and antagonist treatment on chondrocyte proliferation in cultured epiphyseal cartilage. (A) Graphical depiction of procedures described using ex vivo epiphyseal cartilage. (B,C) Antagonist (G15) and agonist (G1) of GPER-1 were used to testing effect of GPER-1 mediation on cell proliferation by measuring number of BrdU-positive chondrocytes. Scale bars, 20 μm. Each group, N = 5. P < 0.05, ∗∗∗P < 0.001.

Similar articles

Cited by

References

    1. Almeida M., Laurent M. R., Dubois V., Claessens F., O’Brien C. A., Bouillon R., et al. (2017). Estrogens and androgens in skeletal physiology and pathophysiology. Physiol. Rev. 97 135–187. 10.1152/physrev.00033.2015 - DOI - PMC - PubMed
    1. Bell M. R. (2018). Comparing postnatal development of gonadal hormones and associated social behaviors in rats, mice, and humans. Endocrinology 159 2596–2613. 10.1210/en.2018-00220 - DOI - PMC - PubMed
    1. Bologa C. G., Revankar C. M., Young S. M., Edwards B. S., Arterburn J. B., Kiselyov A. S., et al. (2006). Virtual and biomolecular screening converge on a selective agonist for GPR30. Nat. Chem. Biol. 2 207–212. 10.1038/nchembio775 - DOI - PubMed
    1. Chagin A. S., Savendahl L. (2007a). Estrogens and growth: review. Pediatr. Endocrinol. Rev. 4 329–334. - PubMed
    1. Chagin A. S., Savendahl L. (2007b). GPR30 estrogen receptor expression in the growth plate declines as puberty progresses. J. Clin. Endocrinol. Metab. 92 4873–4877. 10.1210/jc.2007-0814 - DOI - PubMed

LinkOut - more resources