. 2021 Sep 24;24(9):103078.
doi: 10.1016/j.isci.2021.103078. Epub 2021 Sep 2.

Development of humoral and cellular immunological memory against SARS-CoV-2 despite B cell depleting treatment in multiple sclerosis

Affiliations

Development of humoral and cellular immunological memory against SARS-CoV-2 despite B cell depleting treatment in multiple sclerosis

Klara Asplund Högelin et al. iScience. .

Abstract

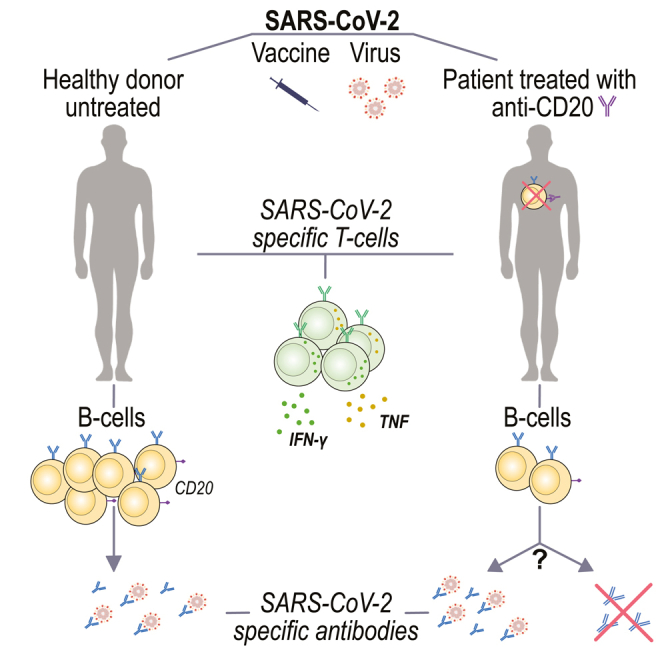
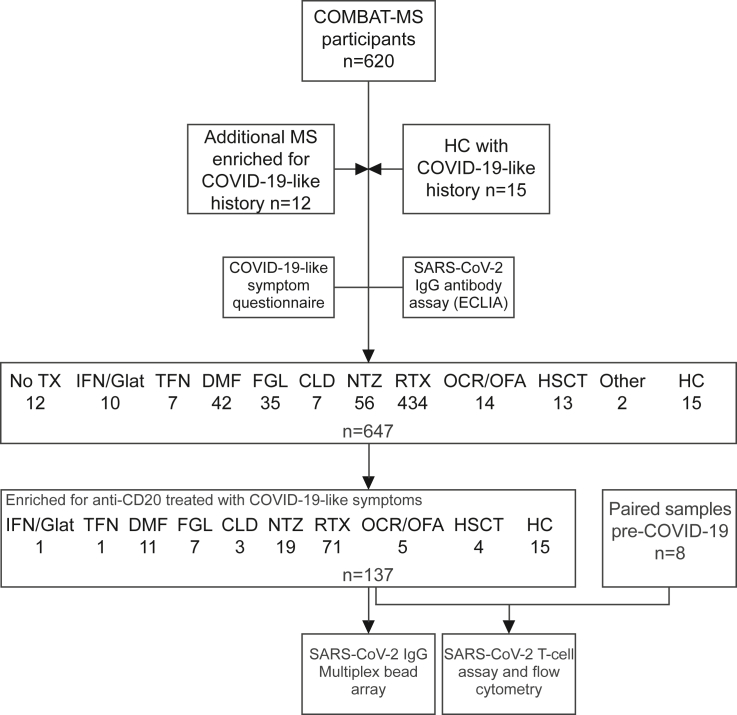
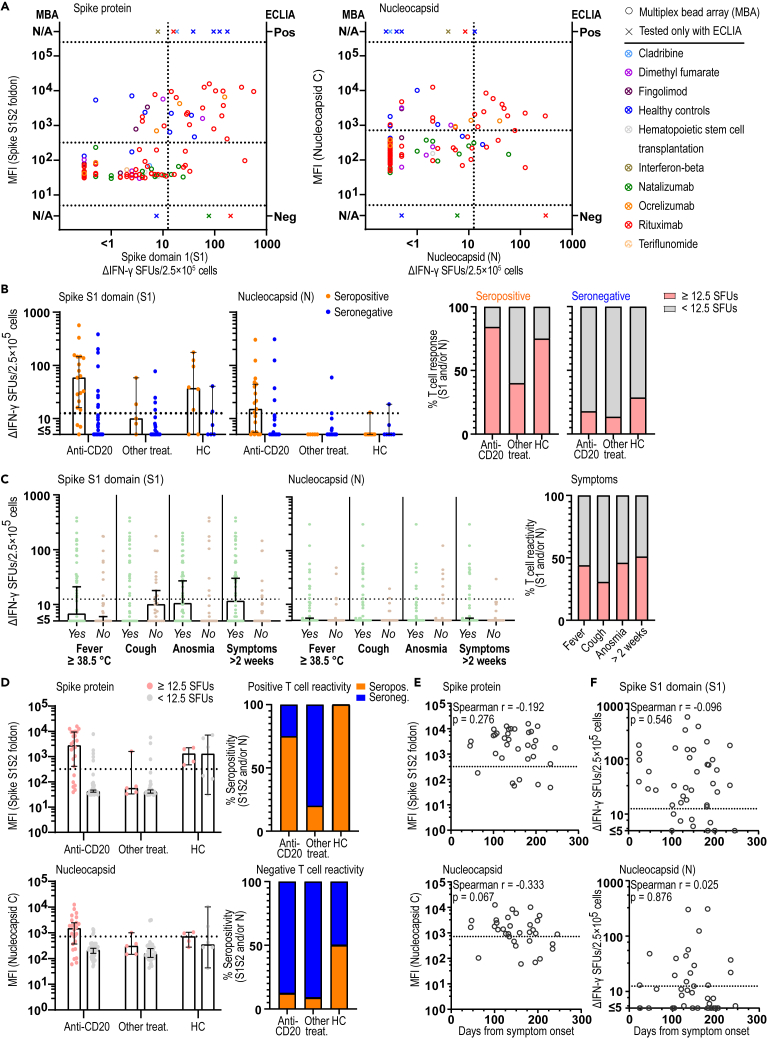
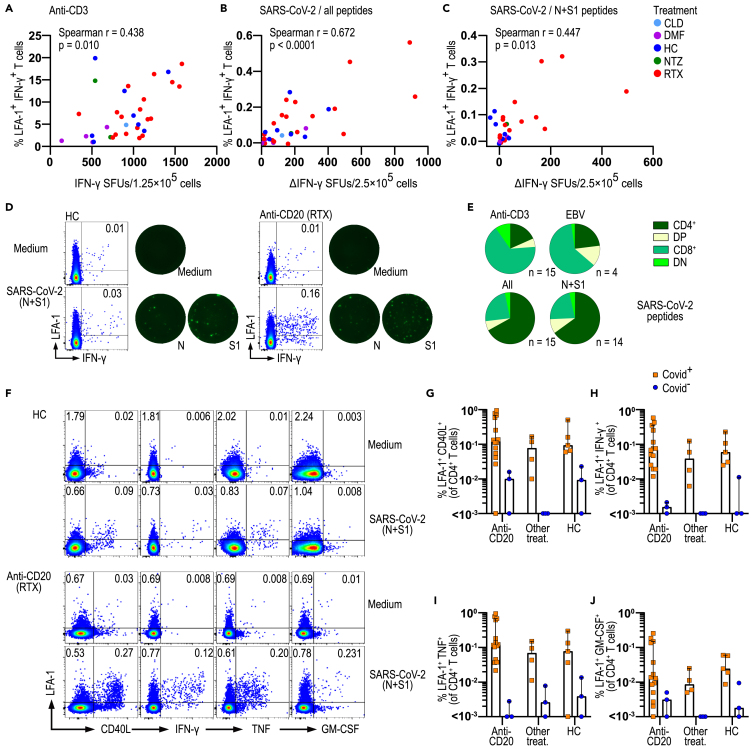
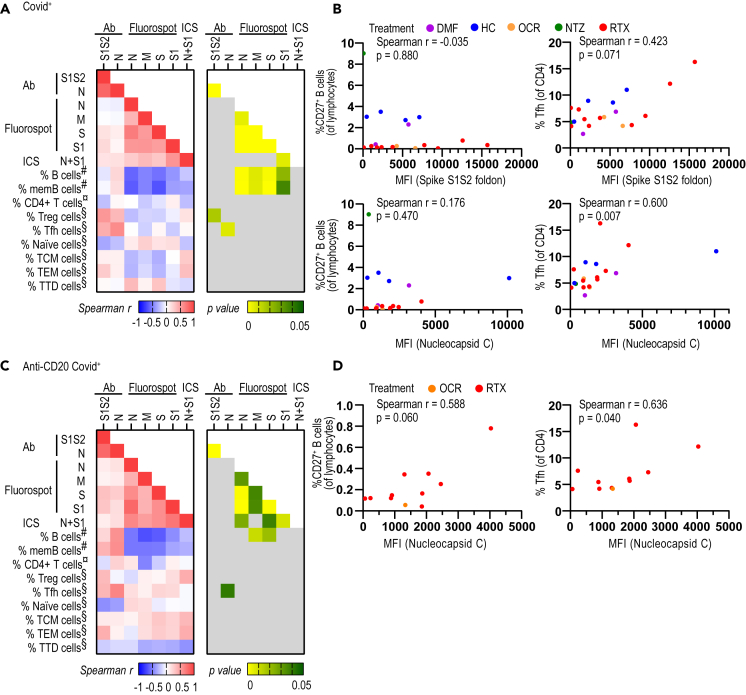
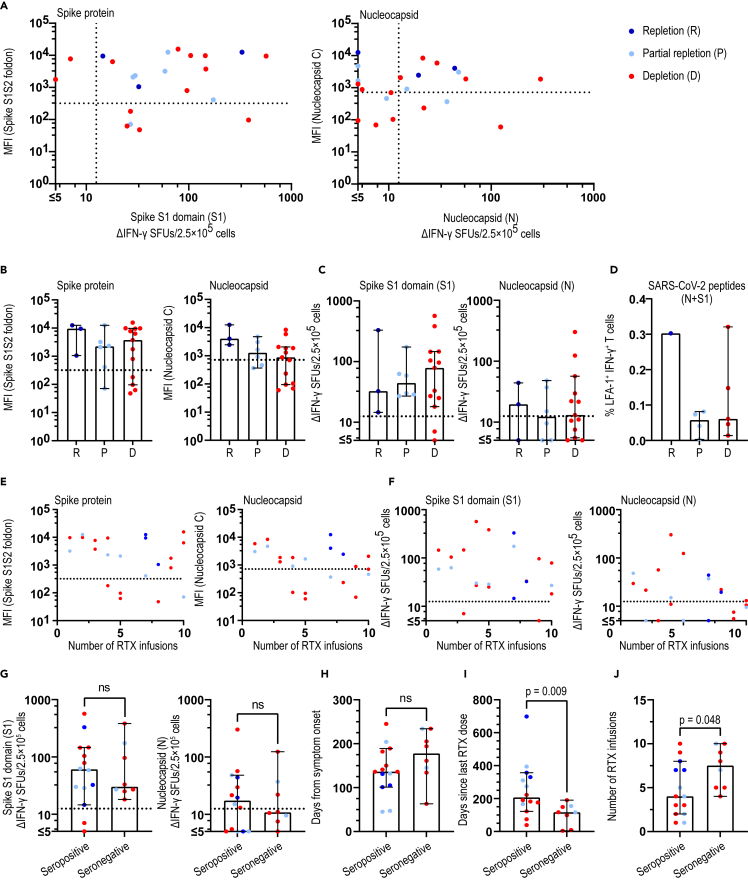
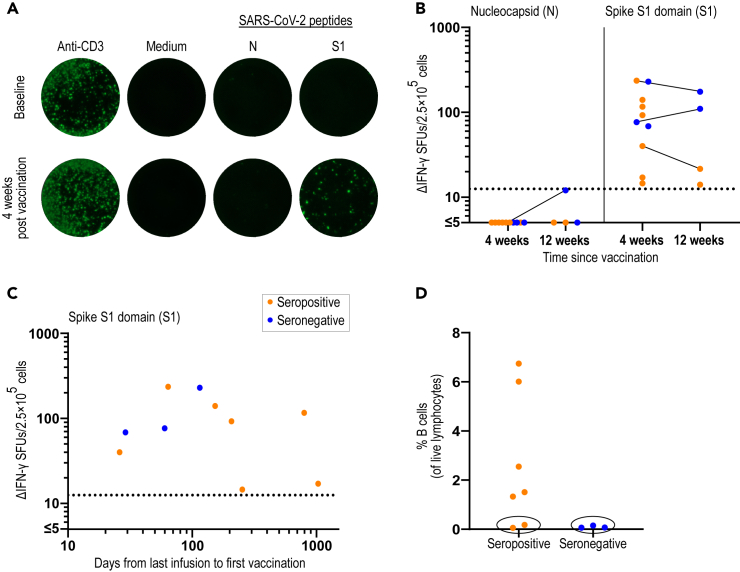
B cell depleting therapies (BCDTs) are widely used as immunomodulating agents for autoimmune diseases such as multiple sclerosis. Their possible impact on development of immunity to severe acute respiratory syndrome virus-2 (SARS-CoV-2) has raised concerns with the coronavirus disease 2019 (COVID-19) pandemic. We here evaluated the frequency of COVID-19-like symptoms and determined immunological responses in participants of an observational trial comprising several multiple sclerosis disease modulatory drugs (COMBAT-MS; NCT03193866) and in eleven patients after vaccination, with a focus on BCDT. Almost all seropositive and 17.9% of seronegative patients on BCDT, enriched for a history of COVID-19-like symptoms, developed anti-SARS-CoV-2 T cell memory, and T cells displayed functional similarity to controls producing IFN-γ and TNF. Following vaccination, vaccine-specific humoral memory was impaired, while all patients developed a specific T cell response. These results indicate that BCDTs do not abrogate SARS-CoV-2 cellular memory and provide a possible explanation as to why the majority of patients on BCDTs recover from COVID-19.

Keywords: Immunology; Virology.


Conflict of interest statement

T.O. has received unrestricted grants for extended multiple sclerosis studies in relation to COVID-19 from Biogen and Merck. Not related to this manuscript, T.O. has received unrestricted grants, advisory board/ lectures from Biogen, Merck, Novartis, and Sanofi, and F.P. has received research grants from Genzyme, Merck KGaA, and UCB and fees for serving as Chair of DMC in clinical trials with Parexel. All other authors declare no competing interests.

Figures

None
Graphical abstract
Figure 1
Figure 1
Study design CLD = cladribine; DMF = dimethyl fumarate; ECLIA = electro-chemiluminescence immunoassay; FGL = fingolimod; Glat. = glatirameracetate; HC = healthy controls; HSCT = hematopoietic stem cell transplantation; IFN = interferon-beta; No TX = no treatment; NTZ = natalizumab; OCR = ocrelizumab; OFA = ofatumumab; RTX = rituximab; TFN = teriflunomide.
Figure 2
Figure 2
Patients with MS treated with immunosuppressants develop SARS-CoV-2 humoral and cellular immunological memory (A) Correlation of SARS-CoV-2 antibody levels as measured by MFI of S1S2 or N with ΔIFN-γ SFUs after stimulation with S1 (n = 122) or N (n = 122) peptides, respectively. Ten samples that were only tested with ECLIA are also shown. (B) Number of ΔIFN-γ SFUs after stimulation with S1 (n = 132) or N peptides (n = 132) in seropositive or seronegative patients on anti-CD20 (n = 75) or other immunosuppressive treatment (n = 42) and in HC (n = 15). The percentage of persons with SARS-CoV-2-positive T cell immunity per serostatus and treatment group or HC. (C) Number of ΔIFN-γ SFUs after stimulation with S1 or N peptides in patients (n = 88) and HC (n = 11) with specific COVID-19-like symptoms. The percentage of SARS-CoV-2-positive T cell immunity per specific COVID-19-like symptom. (D) Anti-SARS-CoV-2 antibody MFI for S1S2 and N in persons with positive or negative T cell immunity and on anti-CD20 (n = 73) or other immunosuppressive treatment (n = 39) and in HC (n = 10). The percentage of positive and negative serology status in pwMS and HC with positive or negative SARS-CoV-2 T cell immunity is shown. (E and F) Correlation of MFI (n = 34) or ΔIFN-γ SFU (n = 42) measured with days between sampling and COVID-19-like symptoms. Spearman r and p values are shown. Dots represent individual data points while X represents samples that were only tested with ECLIA. Box plots represent median and 95% CI. See also Tables S1, S2 and Figure S1. ECLIA = electro-chemiluminescence immunoassay; HC = healthy controls; MFI = median fluorescent intensity; pwMS = persons with multiple sclerosis; SFU = spot forming unit.
Figure 3
Figure 3
SARS-CoV-2-specific T cells from patients with MS on anti-CD20 treatment are functional (A–C) Correlation of ΔIFN-γ SFUs measured by FluoroSpot with percentages of LFA-1+ IFN-γ+ T cells stimulated with anti-CD3 (n = 34) or four SARS-CoV-2 peptides (N, S, S1, and M, n = 34) or only N and S1 SARS-CoV-2 peptides in pwMS and HC (n = 30). (D) Representative dotplots of LFA-1 and IFN-γ expression of total CD3+ T cells with corresponding IFN-γ FluoroSpot image of one HC and one pwMS under anti-CD20 treatment. (E) Repartition of LFA-1+ IFN-γ+ specific T cells between CD4 and CD8 among pwMS with anti-CD20 treatment following stimulation as in (A–C) (n = 14 or 15) and with EBV peptides (n = 4). (F) Representative dotplots of CD4+ T cell expression of LFA-1 with CD40L, IFN-γ, TNF, and GM-CSF from one HC and one pwMS with anti-CD20 treatment following a culture with medium or in the presence of SARS-CoV-2 peptides N and S1. (G–J) Percentages of LFA-1+CD40L+, LFA-1+IFN-γ+, LFA-1+TNF+, and LFA-1+GM-CSF+ among CD4+ T cells in HC (n = 8) and pwMS with anti-CD20 treatment (n = 18) or with other therapies (n = 7). Spearman r and p values are shown. Dots represent individual data points. Box plots represent median and 95% CI. See also Figure S2. CLD = cladribine; DMF = dimethyl fumarate; DN = double-negative; DP = double-positive; EBV = Epstein-Barr virus; HC = healthy controls; MFI = median fluorescent intensity; NTZ = natalizumab; pwMS = persons with multiple sclerosis; RTX = rituximab; SFU = spot forming unit.
Figure 4
Figure 4
Circulating follicular T helper cells correlate with SARS-CoV-2 antibody levels. PwMS and HC that were SARS-CoV-2 positive in either serological and/or T cell assays are included (A) Correlation matrix representing Spearman r (left panel) and the corresponding p values (right panel) between the COVID-19-specific antibody levels (n = 40), ΔIFN-γ levels measured by FluoroSpot (n = 50), and percentages of LFA-1+IFN-γ+ T cells (n = 14), with the percentage of immune cells determined by FACS in COVID-19-positive pwMS and HC. (B) Correlation between percentages of memory CD27+ B cells (left images) and Tfh cells (right images) with COVID-19-specific antibody levels (MFI) for spike S1S2 (upper images) and nucleocapsid C (lower images). (C) Correlation matrix representing Spearman r and their corresponding p value between the COVID-19-specific antibody levels immune response (n = 26), IFN-γ levels measured by FluoroSpot (n = 28) and percentages of LFA-1+IFN-γ+ T-cells (n = 13), with the percentage of immune cells determined by FACS in Covid+ (n = 13) pwMS with anti-CD20 treatment. (D) Correlation between percentages of Tfh cells with COVID-19-specific antibody levels for nucleocapsid C in COVID-19-positive pwMS with anti-CD20 treatment (n = 11). DMF = dimethyl fumarate; HC = healthy controls; ICS = intracellular staining; memB = memory B; MFI = median fluorescence intensity; NTZ = natalizumab; OCR = ocrelizumab; pwMS = persons with multiple sclerosis; RTX = rituximab; TCM cells = central memory T cells; TEM cells = effector memory T cells; Tfh = T follicular helper cells; Treg = T regulatory; TTD cells = terminally differentiated T cells.
Figure 5
Figure 5
Immunological memory to SARS-CoV-2 is evident in RTX-treated pwMS irrespective of B cell depletion status. Patients that were SARS-CoV-2 positive in either serological and/or T cell assays are included (A) Correlation of SARS-CoV-2 antibody levels for S1S2 or N with ΔIFN-γ SFUs for S1 (n = 22) or N (n = 22) peptides, respectively. (B and C) Anti-SARS-CoV-2 antibody levels for S1S2 and N and number of ΔIFN-γ SFUs for S1 or N peptides in patients with B cell repletion, partial repletion, and depletion. No significant differences were seen. (D) Percentages of LFA-1+IFN-γ+ in patients with B cell repletion (n = 1), partial repletion (n = 4), and depletion (n = 5). (E) Correlation of antibody levels for S1S2 and N with number of RTX infusions. (F) Correlation of ΔIFN-γ SFUs for S1 and N peptides with number of RTX infusions. (G–J) Comparison of seropositive (n = 14) and seronegative (n = 8) patients regarding number of ΔIFN-γ SFUs for S1 (p = 0.803) or N (p = 0.815) or days from symptom onset to sampling (p = 0.140) or days from last RTX dose to symptom onset (p = 0.009) or number of RTX infusions (p = 0.048). (A–C, E–J) B cell depletion status; n = 3 repletion, n = 6 partial repletion, n = 13 depletion. Dots represent individual data points. Box plots represent median and 95% CI. Mann-Whitney test was used for statistical analysis and p values ≤ 0.05 were considered significant. See also Table S3 and Figure S3. MFI = median fluorescent intensity; ns = non-significant; pwMS = persons with multiple sclerosis; RTX = rituximab; SFU = spot forming unit.
Figure 6
Figure 6
Development of T cellular immune response to the spike protein of SARS-CoV-2 in anti-CD20-treated pwMS after vaccination (A) Images of the IFN-γ FluoroSpot after stimulation with the positive control (anti-CD3), negative control (medium only), and SARS-CoV-2 specific peptides (N and S1) in one pwMS on anti-CD20 before and 4 weeks after SARS-CoV-2 vaccination. (B) Serology status and number of ΔIFN-γ SFUs after stimulation with N or S1 peptides four (n = 10) and twelve (n = 4) weeks after SARS-CoV-2 vaccination in pwMS on anti-CD20. (C) Serology status and number of ΔIFN-γ SFUs after stimulation with S1 peptides 4 weeks after vaccination (n = 10) and days from last anti-CD20 infusion to first vaccine dose. (D) Percentages of B cells in seropositive (n = 7) and seronegative (n = 3) pwMS 4 weeks after vaccination. Samples with <0.2% B cells of live lymphocytes are marked with a black circle. pwMS = persons with multiple sclerosis; SFU = spot forming unit.

Similar articles

Cited by

References

    1. Achiron A., Mandel M., Dreyer-Alster S., Harari G., Magalashvili D., Sonis P., Dolev M., Menascu S., Flechter S., Falb R., Gurevich M. Humoral immune response to COVID-19 mRNA vaccine in patients with multiple sclerosis treated with high-efficacy disease-modifying therapies. Ther. Adv. Neurol. Disord. 2021;14 doi: 10.1177/17562864211012835. 17562864211012835. - DOI - PMC - PubMed
    1. Anna F., Goyard S., Lalanne A.I., Nevo F., Gransagne M., Souque P., Louis D., Gillon V., Turbiez I., Bidard F.C. High seroprevalence but short-lived immune response to SARS-CoV-2 infection in Paris. Eur. J. Immunol. 2020;51:180–190. doi: 10.1002/eji.202049058. - DOI - PMC - PubMed
    1. Baker D., Marta M., Pryce G., Giovannoni G., Schmierer K. Memory B cells are major targets for effective immunotherapy in relapsing multiple sclerosis. EBioMedicine. 2017;16:41–50. doi: 10.1016/j.ebiom.2017.01.042. - DOI - PMC - PubMed
    1. Baker D., Roberts C.A.K., Pryce G., Kang A.S., Marta M., Reyes S., Schmierer K., Giovannoni G., Amor S. COVID-19 vaccine-readiness for anti-CD20-depleting therapy in autoimmune diseases. Clin. Exp. Immunol. 2020;202:149–161. doi: 10.1111/cei.13495. - DOI - PMC - PubMed
    1. Bar-Or A., Calkwood J.C., Chognot C., Evershed J., Fox E.J., Herman A., Manfrini M., McNamara J., Robertson D.S., Stokmaier D. Effect of ocrelizumab on vaccine responses in patients with multiple sclerosis: the VELOCE study. Neurology. 2020;95:e1999–e2008. doi: 10.1212/WNL.0000000000010380. - DOI - PMC - PubMed

LinkOut - more resources