. 2021 Aug 20:4:674238.
doi: 10.3389/frai.2021.674238. eCollection 2021.

Estimation and Discriminability of Doppler Ultrasound Fetal Heart Rate Variability Measures

Affiliations

Estimation and Discriminability of Doppler Ultrasound Fetal Heart Rate Variability Measures

Johann Vargas-Calixto et al. Front Artif Intell. .

Abstract

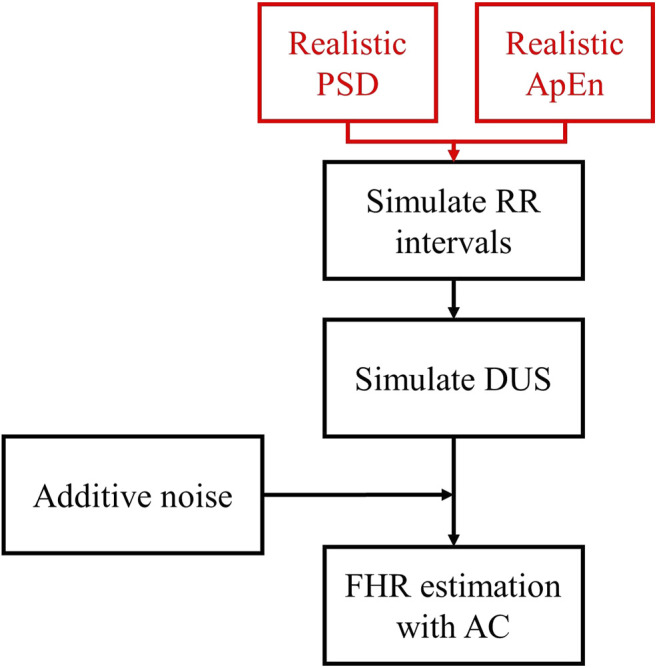
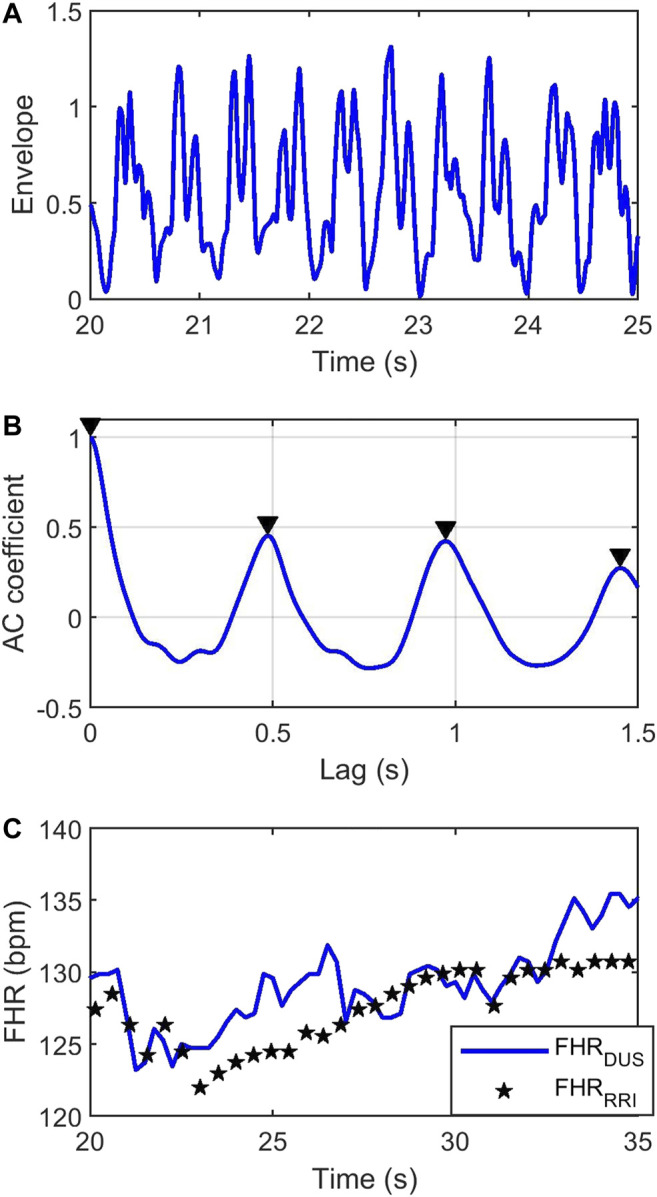
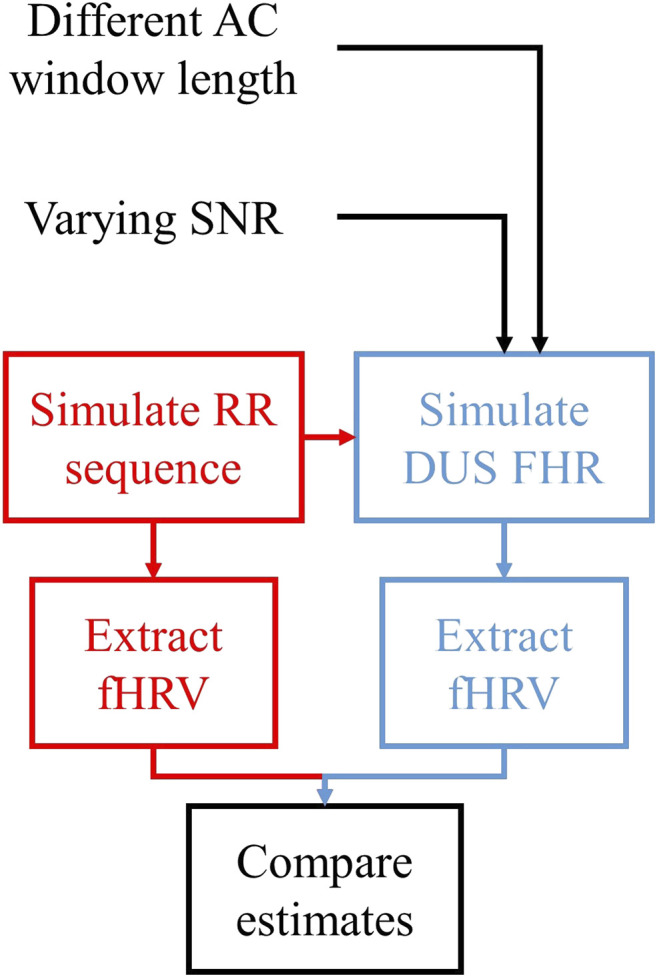
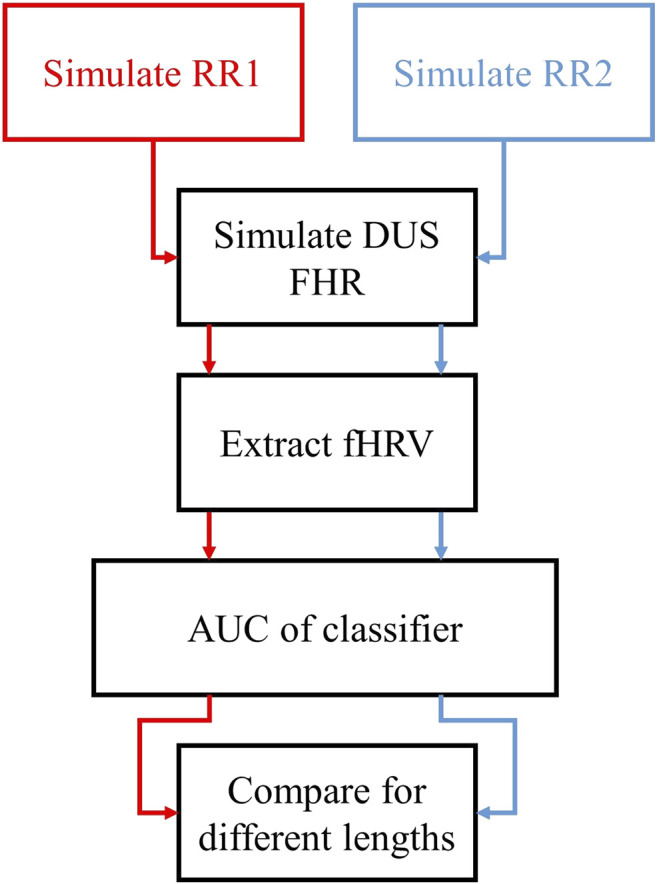
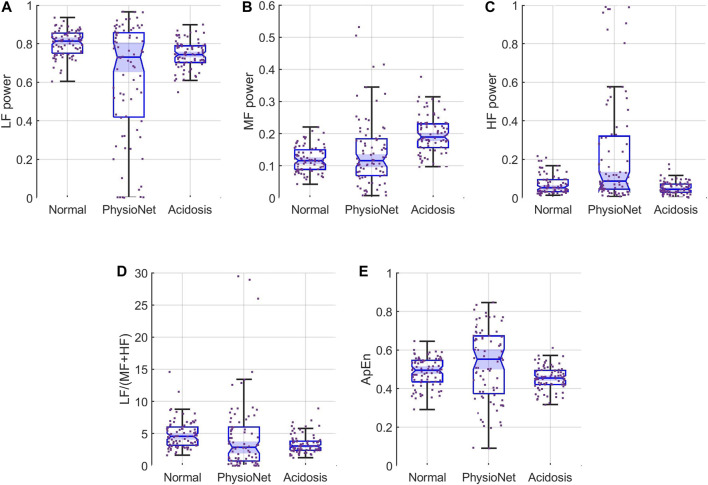
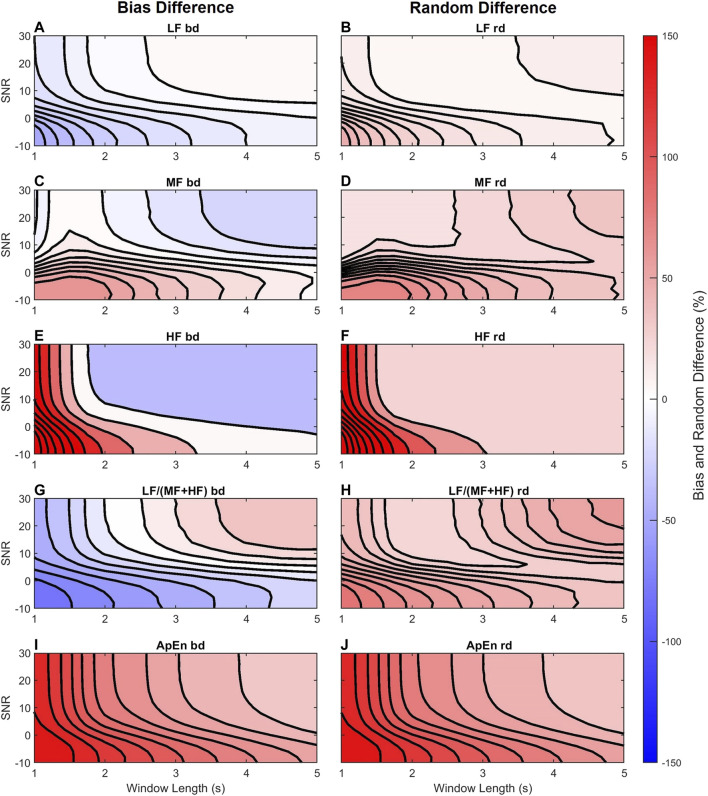
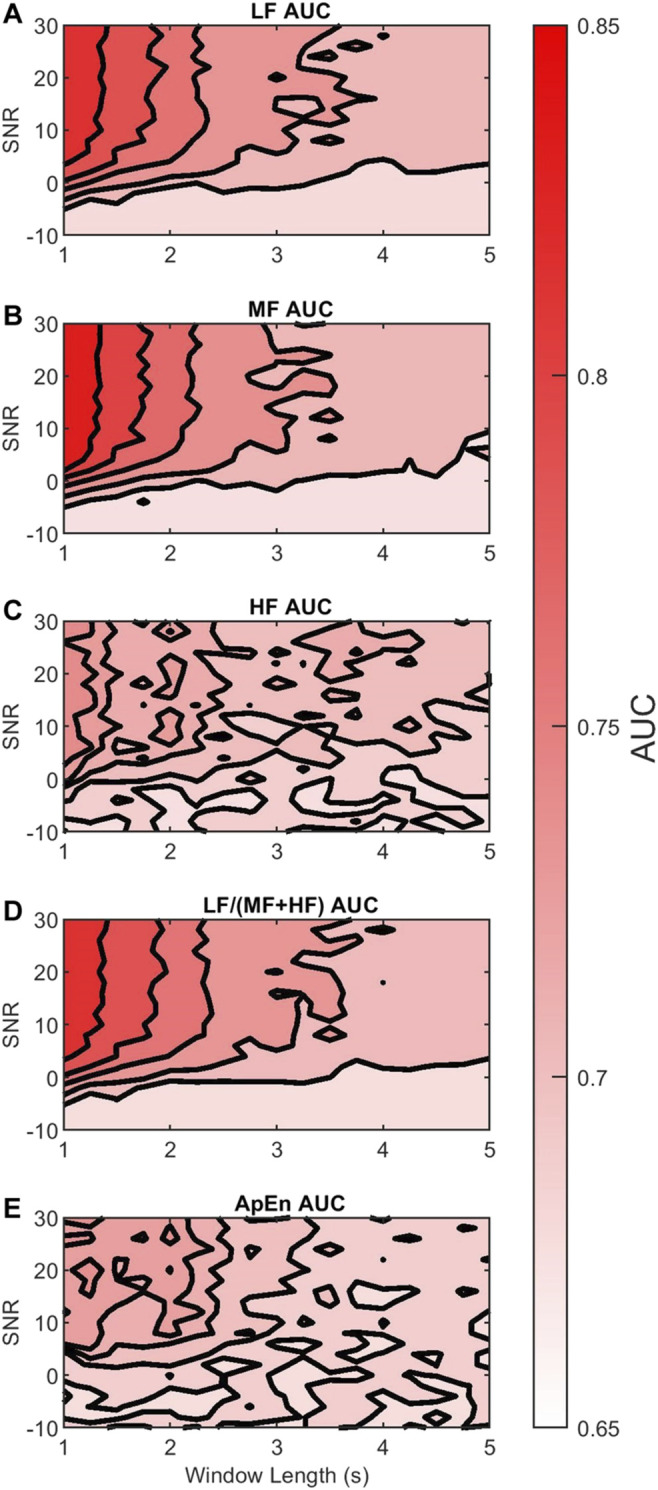
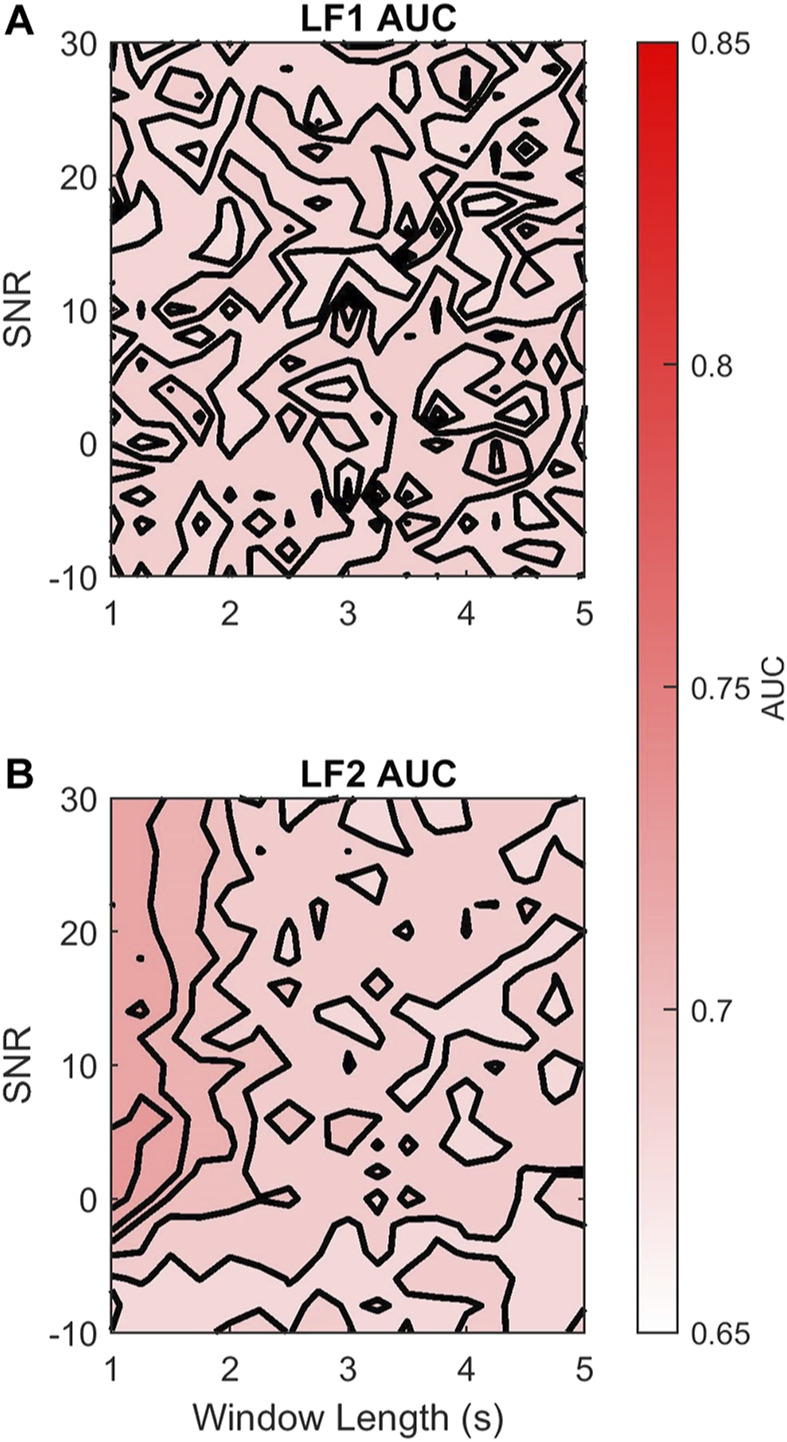
Continuous electronic fetal monitoring and the access to databases of fetal heart rate (FHR) data have sparked the application of machine learning classifiers to identify fetal pathologies. However, most fetal heart rate data are acquired using Doppler ultrasound (DUS). DUS signals use autocorrelation (AC) to estimate the average heartbeat period within a window. In consequence, DUS FHR signals loses high frequency information to an extent that depends on the length of the AC window. We examined the effect of this on the estimation bias and discriminability of frequency domain features: low frequency power (LF: 0.03-0.15 Hz), movement frequency power (MF: 0.15-0.5 Hz), high frequency power (HF: 0.5-1 Hz), the LF/(MF + HF) ratio, and the nonlinear approximate entropy (ApEn) as a function of AC window length and signal to noise ratio. We found that the average discriminability loss across all evaluated AC window lengths and SNRs was 10.99% for LF 14.23% for MF, 13.33% for the HF, 10.39% for the LF/(MF + HF) ratio, and 24.17% for ApEn. This indicates that the frequency domain features are more robust to the AC method and additive noise than the ApEn. This is likely because additive noise increases the irregularity of the signals, which results in an overestimation of ApEn. In conclusion, our study found that the LF features are the most robust to the effects of the AC method and noise. Future studies should investigate the effect of other variables such as signal drop, gestational age, and the length of the analysis window on the estimation of fHRV features and their discriminability.

Keywords: Doppler ultrasound; autocorrelation; cardiotocography; classification; fetal heart rate; fetal heart rate variability.


Conflict of interest statement

Author PW was employed by the company PeriGen Inc. The remaining authors declare that the research was conducted in the absence of any commercial or financial relationships that could be construed as a potential conflict of interest.

Figures

FIGURE 1
FIGURE 1
Diagram of the simulation of FHRRRI and FHRDUS signals. The PSD and ApEn distributions reported by Gonçalves et al. (2013) are used to generate random simulations of FHRRRI with similar fHRV. Then, we simulate DUS signals that correspond to the FHRRRI and we add noise. Finally, we use the AC to estimate the FHRDUS.
FIGURE 2
FIGURE 2
(A) Simulated envelope of the DUS'(t) signal using a series of FHRRRI extracted from the PhysioNet Database and 20 dB SNR. (B) AC coefficient (blue) and peaks (black triangles) of the DUS envelope using a 4 s window. (C) Simulated FHRDUS (blue), and the non-uniformly sampled FHRRRI (black stars).
FIGURE 3
FIGURE 3
Outline of the assessment of the fHRV estimation differences between FHRRRI and FHRDUS. We simulate a set of RR intervals, and estimate the fHRV features. We also use these sequences to simulate FHRDUS varying AC window length and SNR. Finally, we estimate fHRV from these signals and compare the differences in estimates from FHRRRI and FHRDUS.
FIGURE 4
FIGURE 4
Outline of the assessment of the discriminability of fHRV features as functions of the AC window length. We simulated two sets of FHRRRI sequences with different PSD and ApEn distributions. Then, we extracted the fHRV of the simulated FHRDUS for each case, and we used these estimates to assess the discriminability of each feature using the AUC of Neyman-Pearson classifiers.
FIGURE 5
FIGURE 5
Feature distributions for (A) LF, (B) MF, and (C) HF (D) LF/(MF + HF) ratio, and (E) ApEn. Each panel show the samples (scattered points) and boxplots for the features for simulated normal (left), the PhysioNet data (middle), and simulated acidosis FHRRRI features (right). The notches, or indentations, in each boxplot indicate the 95% CI for the median of each distribution. These plots show that the PhysioNet data and the simulated normal are not significantly different for any of the features. In contrast, the simulated acidosis distributions are significantly different for the MF and ApEn.
FIGURE 6
FIGURE 6
Contour plots of the bias difference, bd, and random difference, rd, of the LF (A,B), MF (C,D), HF (E,F), LF/(MF + HF) (G,H), and ApEn (I,J) features from FHRDUS for the acidosis distributions and varying AC window length (horizontal axis) and SNR (vertical axis). The differences are coded in colors blue (negative), white (zero), and red (positive) according to their magnitude. For visualization, 10 isolines are used in each panel.
FIGURE 7
FIGURE 7
Contour plots of the median AUCDUS of the (A) LF, (B) MF, (C) HF, (D) LF/(MF + HF), and (E) ApEn features for varying AC window length (horizontal axis) and SNR (vertical axis). The AUCDUS are coded in colors white (0.65), and red (0.85) according to their magnitude. For visualization, 5 isolines are used in each panel.
FIGURE 8
FIGURE 8
Contour plots of the median AUCDUS of the (A) LF1 and (B) LF2 sub-bands for varying AC window length (horizontal axis) and SNR (vertical axis). The AUCDUS are coded in colors white (0.65), and red (0.85) according to their magnitude. For visualization, 5 isolines are used in each panel.

Similar articles

References

    1. Acharya U. R., Joseph K. P., Kannathal N., Lim C. M., Suri J. S. (2006). Heart Rate Variability: a Review. Med. Biol. Eng. Comput. 44, 1031–1051. 10.1007/s11517-006-0119 - DOI - PubMed
    1. Alnuaimi S. A., Jimaa S., Khandoker A. H. (2017). Fetal Cardiac Doppler Signal Processing Techniques: Challenges and Future Research Directions. Front. Bioeng. Biotechnol. 5, 82. 10.3389/fbioe.2017.00082 - DOI - PMC - PubMed
    1. American College of Obstetricians and Gynecologists (2014). “Intrapartum Considerations and Assessment,” in Neonatal Encephalopathy and Neurologic Outcome, Report of the American College of Obstetricians and Gynecologists’ Task Force on Neonatal Encephalopathy (Washington, DC: American Academy of Pediatrics; ), 87–114.
    1. Ayres-De-Campos D., Nogueira-Reis Z. (2016). Technical Characteristics of Current Cardiotocographic Monitors. Best Pract. Res. Clin. Obstet. Gynaecol. 30, 22–32. 10.1016/j.bpobgyn.2015.05.005 - DOI - PubMed
    1. Campanile M., D’Alessandro P., Della Corte L., Saccone G., Tagliaferri S., Arduino B., et al. (2018). Intrapartum Cardiotocography with and without Computer Analysis: a Systematic Review and Meta-Analysis of Randomized Controlled Trials. J. Maternal-Fetal Neonatal Med. 33, 2284–2290. 10.1080/14767058.2018.1542676 - DOI - PubMed