. 2021 Sep;26(9):096004.
doi: 10.1117/1.JBO.26.9.096004.

Imaging in thick samples, a phased Monte Carlo radiation transfer algorithm

Affiliations

Imaging in thick samples, a phased Monte Carlo radiation transfer algorithm

Lewis McMillan et al. J Biomed Opt. 2021 Sep.

Abstract

Significance: Optical microscopy is characterized by the ability to get high resolution, below 1 μm, high contrast, functional and quantitative images. The use of shaped illumination, such as with lightsheet microscopy, has led to greater three-dimensional isotropic resolution with low phototoxicity. However, in most complex samples and tissues, optical imaging is limited by scattering. Many solutions to this issue have been proposed, from using passive approaches such as Bessel beam illumination to active methods incorporating aberration correction, but making fair comparisons between different approaches has proven to be challenging.

Aim: We present a phase-encoded Monte Carlo radiation transfer algorithm (φMC) capable of comparing the merits of different illumination strategies or predicting the performance of an individual approach.

Approach: We show that φMC is capable of modeling interference phenomena such as Gaussian or Bessel beams and compare the model with experiment.

Results: Using this verified model, we show that, for a sample with homogeneously distributed scatterers, there is no inherent advantage to illuminating a sample with a conical wave (Bessel beam) instead of a spherical wave (Gaussian beam), except for maintaining a greater depth of focus.

Conclusion: φMC is adaptable to any illumination geometry, sample property, or beam type (such as fractal or layered scatterer distribution) and as such provides a powerful predictive tool for optical imaging in thick samples.

Keywords: Bessel; Monte Carlo methods; light scattering; phase; photons; scattering.


Figures

Fig. 1
Fig. 1
Comparison of theory and simulation for the double-slit experiment. (a) A slice through the computed image and the expected profile from theory. For clarity only every fifth MCRT data point is plotted. (b) The computed image.
Fig. 2
Fig. 2
Comparison of theory and simulation for diffraction through a square aperture in the Fresnel and Fraunhofer regimes, for a variety of Fresnel numbers.
Fig. 3
Fig. 3
Comparison of Gausssian beam simulation and theory. (a) The Beam waist as a function of distance from its minimum. (b) The width of the Gaussian beam at its minimum.
Fig. 4
Fig. 4
Comparison of theoretical and MCRT simulation of a Bessel beams, with intensity normalized. The results from φMC show good agreement with the theory.
Fig. 5
Fig. 5
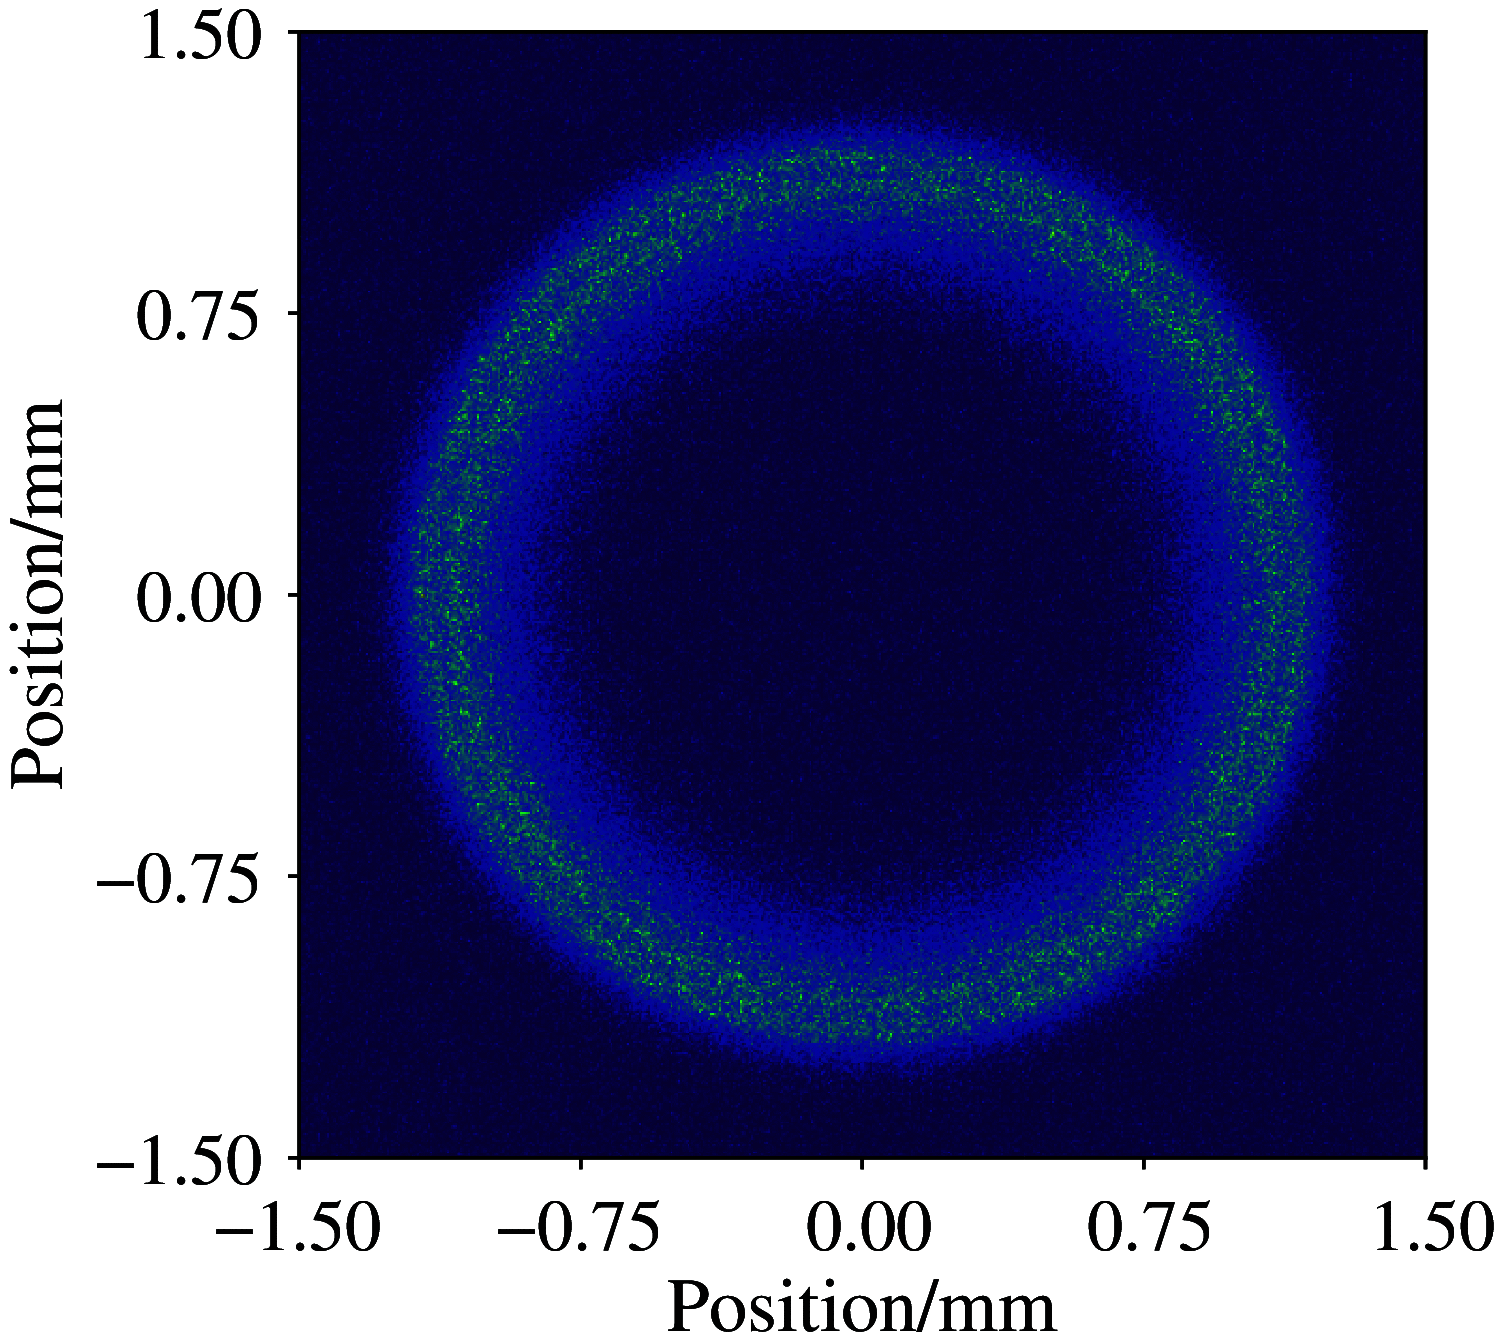
Bessel beam in the far field. Bessel beams in the far field becomes a ring beam. Image shows a slice of intensity through the medium.
Fig. 6
Fig. 6
Experimental setup for propagating a Bessel beam through a cuvette filled with varying concentrations of Intralipid 20%. Bessel beam is imaged by an 20× objective lens and a Grasshopper 3 camera.
Fig. 7
Fig. 7
Scattering properties of 20% Intralipid.
Fig. 8
Fig. 8
Comparison of experimental and simulation data for propagation of a Bessel beam produced by an axicon, through mediums of various turbidity. (a)–(g) The data from φMC, and (h)–(n) the experimental data. Volumes along the top are the volume of Intralipid in each solution as in Table 1. All images are cropped so they are the same size and normalized to the maximum value in each image.
Fig. 9
Fig. 9
Line graph plots of slices taken through the generated and experimental images as shown in Fig. 8.
Fig. 10
Fig. 10
First comparison of Bessel and Gaussian beams with equal power used to generate both beams. Plots taken at the Gaussian beams focus. The maxima at the sides of the Gaussian beam in the 0.0  μL plot are due to simulation effects, mainly the small size of the medium not allowing photons from further off the optical axis to interfere destructively.
Fig. 11
Fig. 11
First comparison of Bessel and Gaussian beams, with equal power used to generate both beams. Plots taken at the bottom of the simulated medium. Medium has a 2 mm thickness.
Fig. 12
Fig. 12
Second comparison of Bessel and Gaussian beams for the case where the power given to each beam yields the same maximum at the Gaussian beams focus. These plots are taken from the Gaussian beams focus. Medium has a 2-mm thickness.
Fig. 13
Fig. 13
Comparisons of unequal powered beams at the bottom of scattering medium. Medium has a 2-mm thickness.

References

    1. Keller P. J., et al. , “Reconstruction of zebrafish early embryonic development by scanned light sheet microscopy,” Science 322(5904), 1065–1069 (2008).SCIEAS10.1126/science.1162493 - DOI - PubMed
    1. Keller P. J., et al. , “Fast, high-contrast imaging of animal development with scanned light sheet-based structured-illumination microscopy,” Nat. Methods 7(8), 637–642 (2010).10.1038/nmeth.1476 - DOI - PMC - PubMed
    1. Vettenburg T., et al. , “Light-sheet microscopy using an airy beam,” Nat. Methods 11(5), 541–544 (2014).10.1038/nmeth.2922 - DOI - PubMed
    1. Rozbicki E., et al. , “Myosin-II-mediated cell shape changes and cell intercalation contribute to primitive streak formation,” Nat. Cell Biol. 17(4), 397–408 (2015).NCBIFN10.1038/ncb3138 - DOI - PMC - PubMed
    1. Wood K., Reynolds R., “A model for the scattered light contribution and polarization of the diffuse Hα galactic background,” Astrophys. J. 525(2), 799 (1999).ASJOAB10.1086/307939 - DOI

Publication types