. 2021 Sep 7:10:e67777.
doi: 10.7554/eLife.67777.

Endothelial pannexin 1-TRPV4 channel signaling lowers pulmonary arterial pressure in mice

Affiliations

Endothelial pannexin 1-TRPV4 channel signaling lowers pulmonary arterial pressure in mice

Zdravka Daneva et al. Elife. .

Abstract

Pannexin 1 (Panx1), an ATP-efflux pathway, has been linked with inflammation in pulmonary capillaries. However, the physiological roles of endothelial Panx1 in the pulmonary vasculature are unknown. Endothelial transient receptor potential vanilloid 4 (TRPV4) channels lower pulmonary artery (PA) contractility and exogenous ATP activates endothelial TRPV4 channels. We hypothesized that endothelial Panx1-ATP-TRPV4 channel signaling promotes vasodilation and lowers pulmonary arterial pressure (PAP). Endothelial, but not smooth muscle, knockout of Panx1 increased PA contractility and raised PAP in mice. Flow/shear stress increased ATP efflux through endothelial Panx1 in PAs. Panx1-effluxed extracellular ATP signaled through purinergic P2Y2 receptor (P2Y2R) to activate protein kinase Cα (PKCα), which in turn activated endothelial TRPV4 channels. Finally, caveolin-1 provided a signaling scaffold for endothelial Panx1, P2Y2R, PKCα, and TRPV4 channels in PAs, promoting their spatial proximity and enabling signaling interactions. These results indicate that endothelial Panx1-P2Y2R-TRPV4 channel signaling, facilitated by caveolin-1, reduces PA contractility and lowers PAP in mice.

Keywords: Caveolin 1; Pannexin 1; TRP channel; biochemistry; cell biology; chemical biology; mouse; pulmonary vasculature; purinergic signaling.


Conflict of interest statement

ZD, YC, EK, MK, SS, RM, CS, VL, BI, SS none, MO None

Figures
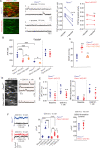
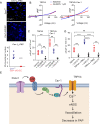
Figure 1.
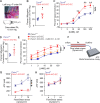
Figure 1.. ATP efflux through Panx1EC ATP activates TRPV4EC channels in pulmonary arteries (PAs) and lowers pulmonary arterial pressure (PAP).
(A) Left: immunofluorescence images of en face fourth-order PAs from Panx1fl/fl and Panx1 cKO-EC mice. CD31 immunofluorescence indicates ECs. Center: representative traces showing TRPV4EC sparklet activity in en face preparations of PAs from Panx1fl/fl mice in the absence or presence of apyrase (10 U/mL). Dotted lines are quantal levels. Experiments were performed in Fluo-4-loaded PAs in the presence of cyclopiazonic acid (CPA; 20 μmol/L CPA, included to eliminate Ca2+ release from intracellular stores). Right: TRPV4EC sparklet activity (NPo) per site in en face preparations of PAs from Panx1fl/fl and Panx1 cKO-EC mice in the presence or absence of apyrase (10 U/mL; n = 5; ***p<0.001 vs. Panx1fl/fl [-apyrase, 10 U/mL]; ns indicates no statistical significance; t-test). ‘N’ is the number of channels per site and ‘PO’ is the open state probability of the channel. (B), measurements of ATP (nmol/L) levels in PAs from Panx1fl/fl, Panx1 cKO-EC, Panx1 cKO-SMC, Trpv4fl/fl, and Trpv4 cKO-EC mice, and endothelium-denuded PAs from Panx1fl/fl and Panx1 cKO-SMC mice (n = 5–6; *p<0.05 vs. Panx1 cKO-EC; *p<0.05 vs. Panx1fl/fl [denuded]; ***p<0.001 vs. Panx1fl/fl; ***p<0.001 vs. Panx1 cKO-SMC; ns indicates no statistical significance; one-way ANOVA). (C) Average resting right ventricular systolic pressure (RVSP) values in Panx1fl/fl, Panx1 cKO-EC, and Panx1 cKO-SMC mice (n = 6; ***p<0.001 vs. Panx1fl/fl; ns indicates no statistical significance; one-way ANOVA). (D) Left grayscale image of a field of view in an en face preparation of Fluo-4-loaded PAs from Panx1fl/fl and Panx1 cKO-EC mice showing approximately 20 ECs. Dotted outlines indicate an EC (20 μmol/L CPA included to eliminate Ca2+ release from intracellular stores). Right: representative traces showing TRPV4EC sparklet activity in en face preparations of PAs from Panx1fl/fl and Panx1 cKO-EC mice in response to GSK1016790A (GSK101; 1 nmol/L). Experiments were performed in Fluo-4-loaded PAs in the presence of CPA (20 μmol/L). (E) TRPV4EC sparklet activity (NPO) per site and sites per cell in en face preparations of PAs from Panx1fl/fl and Panx1 cKO-EC mice under baseline conditions (i.e., 20 μmol/L CPA) and in response to 1 nmol/L GSK101 (n = 6; *p<0.05, **p<0.01 vs. Panx1fl/fl; *p<0.05 vs. Panx1fl/fl; ns indicates no statistical significance; two-way ANOVA). (F) Left: representative GSK101 (10 nmol/L)-induced outward TRPV4EC currents in freshly isolated ECs from Panx1fl/fl and Panx1 cKO-EC mice and effect of GSK2193874 (GSK219, TRPV4 inhibitor, 100 nmol/L) in the presence of GSK101. Currents were elicited by a 200 ms voltage step from –50 mV to +100 mV. Center: scatterplot showing outward currents at +100 mV under baseline conditions, after the addition of GSK101 (10 nmol/L), and after the addition of GSK219 (100 nmol/L; n = 5–6 cells, *p<0.05 vs. Panx1 cKO-EC [+GSK101]; **p<0.01 vs. Panx1 cKO-EC [baseline]; ***p<0.001 vs. Panx1fl/fl [+baseline]; vs. Panx1fl/fl [+GSK101]; and Panx1 cKO-EC [+GSK101] vs. Panx1fl/fl [+GSK101]; two-way ANOVA). Right: scatterplot showing GSK219-sensitive TRPV4EC currents in response to GSK101 (100 nmol/L; ns indicates no statistical significance; n = 5).
Figure 1—figure supplement 1.
Figure 1—figure supplement 1.. Panx1SMC mRNA levels in mesenteric arteries from Panx1fl/fl and Panx1 cKO-SMC mice.
Data presented as a fold change from Panx1fl/fl (n = 5; ***p<0.001 vs. Panx1fl/fl; t-test).
Figure 1—figure supplement 2.
Figure 1—figure supplement 2.. TRPV4EC sparklet activity (NPO) per site and TRPV4 sparklet sites per cell in en face preparations of pulmonary arteries (PAs) from Panx1fl/fl and Panx1 cKO-EC mice in response to 30 nmol/L GSK101.
Experiments were performed in Fluo-4-loaded PAs in the presence of cyclopiazonic acid (CPA; 20 μmol/L), included to eliminate Ca2+ release from intracellular stores. ‘N’ is the number of channels per site and ‘PO’ is the open state probability of the channel (n = 6; ns indicates no statistical significance).
Figure 2.
Figure 2.. Endothelial Panx1–TRPV4 signaling lowers myogenic and agonist-induced constriction of pulmonary arteries (PAs).
(A) Top: an image showing the left lung and the order system used to isolate fourth-order PAs in this study; bottom: an image of a fourth-order PA cannulated and pressurized at 15 mm Hg. (B) Percentage myogenic constriction of PAs from Trpv4fl/fl and Trpv4 cKO-EC mice (n = 6; *p<0.05; t-test). (C) Percent constriction of PAs from Trpv4fl/fl and Trpv4 cKO-EC mice in response to thromboxane A2 receptor agonist U46619 (U466, 1–300 nmol/L; n = 5; *p<0.05 vs. Trpv4fl/fl [10 nmol/L], **p<0.01 vs. Trpv4fl/fl [30, 100, and 300 nmol/L]; ##p<0.01 vs. Trpv4fl/fl; two-way ANOVA). (D) Percentage myogenic constriction of PAs from Panx1fl/fl and Panx1 cKO-EC mice (n = 6; *p<0.05; t-test). (E) U46619 (U466, 1–300 nmol/L)-induced constriction of PAs from Panx1fl/fl, Panx1 cKO-EC, and Panx1 cKO-EC mice in the absence or presence of GSK101 (3 nmol/L) (n = 5; **p<0.01 vs. Panx1 cKO-EC, ***p<0.01 vs. Panx1fl/fl; two-way ANOVA, between groups). (F) Schematic of flow-induced ATP release from isolated and cannulated fourth-order PAs. Shear stress was calculated using the following equation: τ=4(μQ˙)/(πr3), where μ is viscosity, Q. is volumetric flow, and r is internal radius of the vessel. Outflow was collected every 10 min and ATP was measured using Luciferin-Luciferase ATP Bioluminescence Assay. (G) Release of ATP (nmol/L) from PAs of Panx1fl/fl and Panx1 cKO-EC mice in response to flow/shear stress in the presence of ARL-67156 (ARL; ecto-ATPase inhibitor; 300 μmol/L; 4, 7, and 14 dynes/cm2; n = 6; *p<0.05 vs. Panx1fl/fl [4 dynes/cm2]; **p<0.01 vs. Panx1fl/fl [7 dynes/cm2]; ###p<0.001 vs. Panx1 cKO-EC; two-way ANOVA). (H) Release of ATP (nmol/L) from PAs of Trpv4fl/fl and Trpv4 cKO-EC mice in response to flow/shear stress in the presence of ARL (300 μmol/L; 4, 7, and 14 dynes/cm2; n = 6; *p<0.05 vs. Trpv4fl/fl [4 dynes/cm2]; #p<0.05 vs. Trpv4 cKO-EC [4 dynes/cm2]; two-way ANOVA).
Figure 2—figure supplement 1.
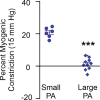
Figure 2—figure supplement 1.. Percent myogenic constriction in small pulmonary arteries (PAs; 50–100 μm internal diameter) and large PAs (>200 μm internal diameter; n = 6–10; ***p<0.001).
Figure 2—figure supplement 2.
Figure 2—figure supplement 2.. Percent constriction of pulmonary arteries (PAs) from Panx1fl/fl and Panx1fl/fl plus apyrase (10 U/mL) mice in response to U46619 (U466; 1–100 nmol/L; n = 5; **p<0.01 vs. Panx1fl/fl; two-way ANOVA).
Figure 2—figure supplement 3.
Figure 2—figure supplement 3.. Left: representative diameter traces showing ATP (1 μmol/L)-induced dilation of pulmonary arteries (PAs) from Trpv4fl/fl and Trpv4 cKO-EC mice, pre-constricted with the thromboxane A2 receptor analog U46619 (50 nmol/L).
Fourth-order PAs were pressurized to 15 mm Hg. Center: percent dilation of PAs from Trpv4fl/fl and Trpv4 cKO-EC mice in response to ATP (1 μmol/L; n = 5–10; ***p<0.001 vs. Trpv4fl/fl [ATP 1 μmol/L]; t-test). Right: percent dilation of PAs from Panx1fl/fl and Panx1 cKO-EC mice in response to ATP (1 μmol/L; n = 5–10; ns indicates no statistical significance).
Figure 3.
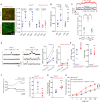
Figure 3.. Endothelial P2Y2R-TRPV4 channel signaling lowers pulmonary artery (PA) contractility and pulmonary arterial pressure (PAP).
(A) Left: immunofluorescence images of en face fourth-order PAs from P2ry2fl/fl and P2ry2 cKO-EC mice. CD31 immunofluorescence indicates ECs. Right: effects of ATP (1 μmol/L) on TRPV4EC sparklet activity in the absence or presence of the P2Y1R inhibitor MRS2179 (MRS; 10 μmol/L) or P2Y2R inhibitor AR-C 118925XX (AR-C; 10 μmol/L) in PAs from P2ry2fl/fl and P2ry2 cKO-EC mice, expressed as NPO per site (n = 5; ***p<0.001 vs. Control [- ATP]; **p<0.01 vs.+ MRS [- ATP]; ns indicates no statistical significance; two-way ANOVA). ‘N’ is the number of channels per site and ‘PO’ is the open state probability of the channel. (B) Effects of ATP (1 μmol/L) on TRPV4EC sparklet activity in the presence of the general P2X1-5/7R inhibitor PPADS (10 μmol/L) and P2X7R inhibitor JNJ-47965567 (JNJ; 1 μmol/L) in PAs of C57BL6/J mice (n = 5; *p<0.05 vs. [-ATP]; one-way ANOVA). (C) Top: representative ATP (10 μmol/L)-induced outward TRPV4 currents in freshly isolated ECs from C57BL6/J mice and the effect of GSK2193874 (GSK219; TRPV4 inhibitor; 100 nmol/L) in the presence of ATP. Currents were elicited by a 200 ms voltage step from –50 mV to +100 mV. Bottom: scatterplot showing outward currents at +100 mV under baseline conditions, after the addition of ATP, and after the addition of GSK219 (100 nmol/L; n = 6 cells; ***p<0.001 vs. baseline; **p<0.01 vs.+ ATP [10 μmol/L]; one-way ANOVA). (D) Left: representative traces showing TRPV4EC sparklet activity in en face preparations of PAs from P2ry2fl/fl mice. Dotted lines are quantal levels. Right: TRPV4EC sparklet activity per site (NPO) in en face preparations of PAs from P2ry2fl/fl and P2ry2 cKO-EC mice under baseline conditions (i.e., 20 μmol/L cyclopiazonic acid [CPA]) and in response to 2-thio UTP (P2Y2R agonist, 0.5 μmol/L; n = 5; *p<0.05 vs. P2ry2fl/fl [-2-thio UTP]; ns indicates no statistical significance; t-test). (E) Left: average resting right ventricular systolic pressure (RVSP) values in P2ry2fl/fl and P2ry2 cKO-EC mice (n = 6; **p<0.01; t-test). Right: average Fulton index values in P2ry2fl/fl and P2ry2 cKO-EC mice (n = 5–6; ns indicates no statistical significance). (F) Right: representative diameter traces showing ATP (1 μmol/L)-induced dilation of PAs from P2ry2fl/fl and P2ry2 cKO-EC mice, pre-constricted with the thromboxane A2 receptor agonist U46619 (U466, 50 nmol/L). Fourth-order PAs were pressurized to 15 mm Hg. Right: percent dilation of PAs from P2ry2fl/fl and P2ry2 cKO-EC mice in response to ATP (1 μmol/L; n = 5–10; ***p<0.01 vs. P2ry2fl/fl [ATP 1 μmol/L]; t-test). (G) Percentage myogenic constriction of PAs from P2ry2fl/fl and P2ry2 cKO-EC mice (n = 5–7; ***p<0.001; t-test). (H) U46619 (U466, 1–300 nmol/L)-induced constriction of PAs from P2ry2fl/fl, P2ry2 cKO-EC, and P2ry2 cKO-EC mice in the absence or presence of GSK101 (3 nmol/L) (n = 5; ***p<0.001 vs. P2ry2 cKO-EC, ***p<0.001 vs. P2ry2fl/fl; two-way ANOVA).
Figure 4.
Figure 4.. Cav-1EC provides a signaling scaffold for Panx1EC–P2Y2REC–TRPV4EC signaling in pulmonary arteries (PAs).
(A) Left: representative traces showing TRPV4EC sparklets in en face preparations of PAs from Cav1fl/fl and Cav1 cKO-EC mice in the absence or presence of ATP (1 μmol/L). Dotted lines are quantal levels. Right: TRPV4EC sparklet activity (NPO) per site in en face preparations of PAs from Cav1fl/fl and Cav1 cKO-EC mice in the absence or presence of 1 μmol/L ATP (n = 5; *p<0.05 vs. Cav1fl/fl [- ATP]; **p<0.01 vs. Cav1fl/fl [- ATP]; ns indicates no statistical significance; two-way ANOVA). Experiments were performed in Fluo-4-loaded fourth-order PAs in the presence of cyclopiazonic acid (CPA; 20 μmol/L), included to eliminate Ca2+ release from intracellular stores. ‘N’ is the number of channels per site and ‘PO’ is the open state probability of the channel. (B) Percentage dilation of PAs from Cav1fl/fl and Cav1 cKO-EC mice in response to ATP (1 μmol/L). PAs were pre-constricted with the thromboxane A2 receptor analog U46619 (50 nmol/L; n = 5; ***p<0.01 vs. Cav1fl/fl; t-test). (C) Top: representative merged images of proximity ligation assays (PLAs) signal, showing EC nuclei and Cav-1EC:Panx1EC, Cav-1EC:P2Y2REC, and Cav-1EC:TRPV4EC co-localization (white puncta) in fourth-order PAs from Cav1fl/fl and Cav1 cKO-EC mice. Bottom: quantification of Cav-1EC:Panx1EC, Cav-1EC:P2Y2REC, and Cav-1EC:TRPV4EC co-localization in PAs from Cav1fl/fl and Cav1 cKO-EC mice (n = 5; ***p<0.001 vs. Cav1fl/fl; t-test). (D) Representative PLA images showing EC nuclei, TRPV4EC:P2Y2REC and Panx1EC:P2Y2REC co-localization (white puncta) in fourth-order PAs from Cav1fl/fl and Cav1 cKO-EC mice. Bottom: quantification of TRPV4EC:P2Y2REC and Panx1EC:P2Y2REC co-localization in PAs from Cav1fl/fl and Cav1 cKO-EC mice (n = 5; ***p<0.001 vs. Cav1fl/fl; t-test).
Figure 4—figure supplement 1.
Figure 4—figure supplement 1.. Representative proximity ligation assay (PLA) images showing EC nuclei, TRPV4EC:P2Y2REC and Panx1EC:P2Y2REC co-localization in fourth-order pulmonary arteries (PAs) from P2ry2 cKO-EC mice.
Figure 4—figure supplement 2.
Figure 4—figure supplement 2.. Left: representative proximity ligation assay (PLA) images showing EC nuclei and Cav-1EC:P2Y1EC co-localization in fourth-order pulmonary arteries (PAs) from Cav1fl/fl mice.
Right: quantification of Cav-1EC:P2Y1EC co-localization in PAs from Cav1fl/fl mice (n = 5).
Figure 5.
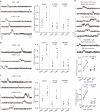
Figure 5.. ATP activates TRPV4EC channels via phospholipase C–diacylglycerol–protein kinase C (PLC–DAG–PKC) signaling in pulmonary arteries (PAs).
(A) Left: representative traces showing TRPV4EC sparklet activity in en face preparations of PAs from C57BL6/J mice before and after treatment with ATP (1 μmol/L). Right: effects of U73122 (PLC inhibitor; 3 μmol/L) or Gö-6976 (PKCα/β inhibitor; 1 μmol/L) on TRPV4EC sparklet activity in en face preparations of PAs from C57BL6/J mice before and after treatment with ATP (1 μmol/L), expressed as NPO per site. Experiments were performed in Fluo-4-loaded fourth-order PAs in the presence of cyclopiazonic acid (CPA; 20 μmol/L), included to eliminate Ca2+ release from intracellular stores (n = 5; *p<0.05 vs. Control [-ATP]; ns indicates no statistical significance; one-way ANOVA). ‘N’ is the number of channels per site and ‘PO’ is the open state probability of the channel. Dotted lines indicate quantal levels. (B) Left: representative traces showing TRPV4EC sparklet activity in en face preparations of PAs from C57BL6/J mice in the absence or presence of OAG (DAG analog; 1 μmol/L). Right: effects of U73122 (3 μmol/L) or Gö-6976 (1 μmol/L) on TRPV4EC sparklet activity in en face preparations of PAs from C57BL6/J mice before and after treatment with OAG (1 μmol/L, n = 6; **p<0.01 vs. Control [-OAG]; **p<0.01 vs. U73122 [-OAG]; ns indicates no statistical significance; one-way ANOVA). (C) Left: representative traces showing TRPV4EC sparklets in en face preparations of PAs from C57BL6/J mice in the absence or presence of phorbol myristate acetate (PMA) (PKC activator; 10 nmol/L). Right: effects of U73122 (3 μmol/L) or Gö-6976 (1 μmol/L) on TRPV4EC sparklet activity in en face preparations of PAs from C57BL6/J mice before and after treatment with PMA (n = 6; *p<0.05 vs. Control [-PMA]; *p<0.05 vs. U73122 [-PMA]; ns indicates no statistical significance; one-way ANOVA). (D) Top: representative traces showing TRPV4EC sparklet activity in en face preparations of PAs from Cdh5-optoα1AR (adrenergic receptor) mouse before and after light activation (470 nm). Center: scatterplot showing TRPV4 sparklet activity before and after light activation in the absence or presence of PKCα/β inhibitor Gö-6976 (1 μmol/L, n = 4, ***p<0.01 vs. –Gö-6976 [before]; ns indicates no statistical significance; one-way ANOVA). Bottom: scatterplot showing TRPV4 sparklet activity, expressed as sparklet sites per cell, before and after light activation, in the absence or presence of PKCα/β inhibitor Gö-6976 (1 μmol/L; n = 4; ***p<0.001 vs. –Gö-6976 [before]; ns indicates no statistical significance; one-way ANOVA).
Figure 5—figure supplement 1.
Figure 5—figure supplement 1.. A multi-Gaussian to all-points histogram obtained using sparklet traces from X-Rhod-1-loaded pulmonary arteries (PAs), showing quantal (evenly spaced) ΔF/F0 levels of 0.21.
Figure 5—figure supplement 2.
Figure 5—figure supplement 2.. Left: scatterplot showing TRPV4 sparklet activity, expressed as NPO per site, before and after light activation, in the presence of TRPV4 inhibitor GSK2193874 (GSK219; 100 nmol/L, n = 4).
‘N’ is the number of channels per site and ‘PO’ is the open state probability of the channel. Right: scatterplot showing TRPV4 sparklet activity, expressed as sparklet sites per cell, before and after light activation, in the presence of TRPV4 inhibitor GSK219 (100 nmol/L, n = 5; ns indicates no statistical significance).
Figure 6.
Figure 6.. Localization of PKCα with Cav-1EC increases the activity of TRPV4EC channels in pulmonary arteries (PAs).
(A) Top: representative merged images of proximity ligation assays (PLAs) showing endothelial cell (EC) nuclei and Cav-1EC:PKC co-localization (white puncta) in fourth-order PAs from Cav1fl/fl and Cav1 cKO-EC mice. Bottom: quantification of Cav-1EC:PKC co-localization in PAs from Cav1fl/fl and Cav1 cKO-EC mice (n = 5; ***p<0.001 vs. Cav1fl/fl; t-test). (B) Representative traces showing TRPV4 currents in the absence or presence of Gö-6976 (PKC inhibitor; 1 μmol/L) in HEK293 cells transfected with TRPV4 alone or co-transfected with TRPV4 plus wild-type Cav-1, recorded in the whole-cell patch-clamp configuration. (C) Current density scatterplot of TRPV4 currents at +100 mV in the absence or presence of Gö-6976 (1 μmol/L) and after the addition of GSK2193874 (GSK219; TRPV4 inhibitor; 100 nmol/L) in HEK293 cells transfected with TRPV4 alone or TRPV4 plus wild-type Cav-1 (n = 5; **p<0.01 vs. Control [TRPV4]; **p<0.01 vs. Control [TRPV4+ Cav-1]; ns indicates no statistical significance; one-way ANOVA). (D) Current density plot of TRPV4 currents at +100 mV in HEK293 cells transfected with TRPV4+ PKCα or TRPV4+ PKCβ and in the presence of GSK219 (100 nmol/L; n = 5; ***p<0.001 vs. TRPV4+ PKCα; t-test). (E) Schematic depiction of the Panx1EC–P2Y2REC–TRPV4EC signaling pathway that promotes vasodilation and lowers pulmonary arterial pressure (PAP) in PAs. ATP released from Panx1EC activates P2Y2REC purinergic receptors on the EC membrane. Stimulation of P2Y2REC recruits PKCα, which anchors to the scaffolding protein Cav-1EC in close proximity to TRPV4EC channels. TRPV4EC channel-dependent vasodilation lowers PAP.

Similar articles

Cited by

References

    1. Ahn SJ, Fancher IS, Bian JT, Zhang CX, Schwab S, Gaffin R, Phillips SA, Levitan I. Inwardly rectifying K+ channels are major contributors to flow-induced vasodilatation in resistance arteries. The Journal of Physiology. 2017;595:2339–2364. doi: 10.1113/JP273255. - DOI - PMC - PubMed
    1. Airan RD, Thompson KR, Fenno LE, Bernstein H, Deisseroth K. Temporally precise in vivo control of intracellular signalling. Nature. 2009;458:1025–1029. doi: 10.1038/nature07926. - DOI - PubMed
    1. Alvarez DF, King JA, Weber D, Addison E, Liedtke W, Townsley MI. Transient receptor potential vanilloid 4-mediated disruption of the alveolar septal barrier: a novel mechanism of acute lung injury. Circulation Research. 2006;99:988–995. doi: 10.1161/01.RES.0000247065.11756.19. - DOI - PMC - PubMed
    1. Bakhshi FR, Mao M, Shajahan AN, Piegeler T, Chen Z, Chernaya O, Sharma T, Elliott WM, Szulcek R, Bogaard HJ, Comhair S, Erzurum S, van Nieuw Amerongen GP, Bonini MG, Minshall RD. Nitrosation-dependent caveolin 1 phosphorylation, ubiquitination, and degradation and its association with idiopathic pulmonary arterial hypertension. Pulmonary Circulation. 2013;3:816–830. doi: 10.1086/674753. - DOI - PMC - PubMed
    1. Bao L, Locovei S, Dahl G. Pannexin membrane channels are mechanosensitive conduits for ATP. FEBS Letters. 2004;572:65–68. doi: 10.1016/j.febslet.2004.07.009. - DOI - PubMed

Publication types