Detection of sarcopenic obesity and prediction of long-term survival in patients with gastric cancer using preoperative computed tomography and machine learning
- PMID: 34490899
- PMCID: PMC9290491
- DOI: 10.1002/jso.26668
Detection of sarcopenic obesity and prediction of long-term survival in patients with gastric cancer using preoperative computed tomography and machine learning
Abstract
Background: Previous studies evaluating the prognostic value of computed tomography (CT)-derived body composition data have included few patients. Thus, we assessed the prevalence and prognostic value of sarcopenic obesity in a large population of gastric cancer patients using preoperative CT, as nutritional status is a predictor of long-term survival after gastric cancer surgery.
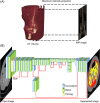
Methods: Preoperative CT images were analyzed for 840 gastric cancer patients who underwent gastrectomy between March 2009 and June 2018. Machine learning algorithms were used to automatically detect the third lumbar (L3) vertebral level and segment the body composition. Visceral fat area and skeletal muscle index at L3 were determined and used to classify patients into obesity, sarcopenia, or sarcopenic obesity groups.
Results: Out of 840 patients (mean age = 60.4 years; 526 [62.6%] men), 534 (63.5%) had visceral obesity, 119 (14.2%) had sarcopenia, and 48 (5.7%) patients had sarcopenic obesity. Patients with sarcopenic obesity had a poorer prognosis than those without sarcopenia (hazard ratio [HR] = 3.325; 95% confidence interval [CI] = 1.698-6.508). Multivariate analysis identified sarcopenic obesity as an independent risk factor for increased mortality (HR = 2.608; 95% CI = 1.313-5.179). Other risk factors were greater extent of gastrectomy (HR = 1.928; 95% CI = 1.260-2.950), lower prognostic nutritional index (HR = 0.934; 95% CI = 0.901-0.969), higher neutrophil count (HR = 1.101; 95% CI = 1.031-1.176), lymph node metastasis (HR = 6.291; 95% CI = 3.498-11.314), and R1/2 resection (HR = 4.817; 95% CI = 1.518-9.179).
Conclusion: Body composition analysis automated by machine learning predicted long-term survival in patients with gastric cancer.
Keywords: body mass index; gastric cancer; machine learning; nutrition process; sarcopenic obesity; survival.
© 2021 The Authors. Journal of Surgical Oncology published by Wiley Periodicals LLC.
Conflict of interest statement
The authors declare that there are no conflict of interests.
Figures


References
-
- Amin MB, Edge S, Greene F, Byrd DR, Brookland RK, MK W. AJCC Cancer Staging Manual. 8th ed. 2‐New York: Springer International Publishing; 2017.
-
- Kiuchi J, Komatsu S, Kosuga T, et al. Long‐term postoperative nutritional status affects prognosis even after infectious complications in gastric cancer. Anticancer Res. 2018;38(5):3133‐3138. - PubMed
-
- Minami Y, Kawai M, Fujiya T, et al. Family history, body mass index and survival in Japanese patients with stomach cancer: a prospective study. Int J Cancer. 2015;136(2):411‐424. - PubMed

