Review
. 2022 Apr 27;122(8):7840-7908.
doi: 10.1021/acs.chemrev.1c00380. Epub 2021 Sep 7.

Mass Spectrometry-Based Techniques to Elucidate the Sugar Code

Affiliations
Review

Mass Spectrometry-Based Techniques to Elucidate the Sugar Code

Márkó Grabarics et al. Chem Rev. .

Abstract

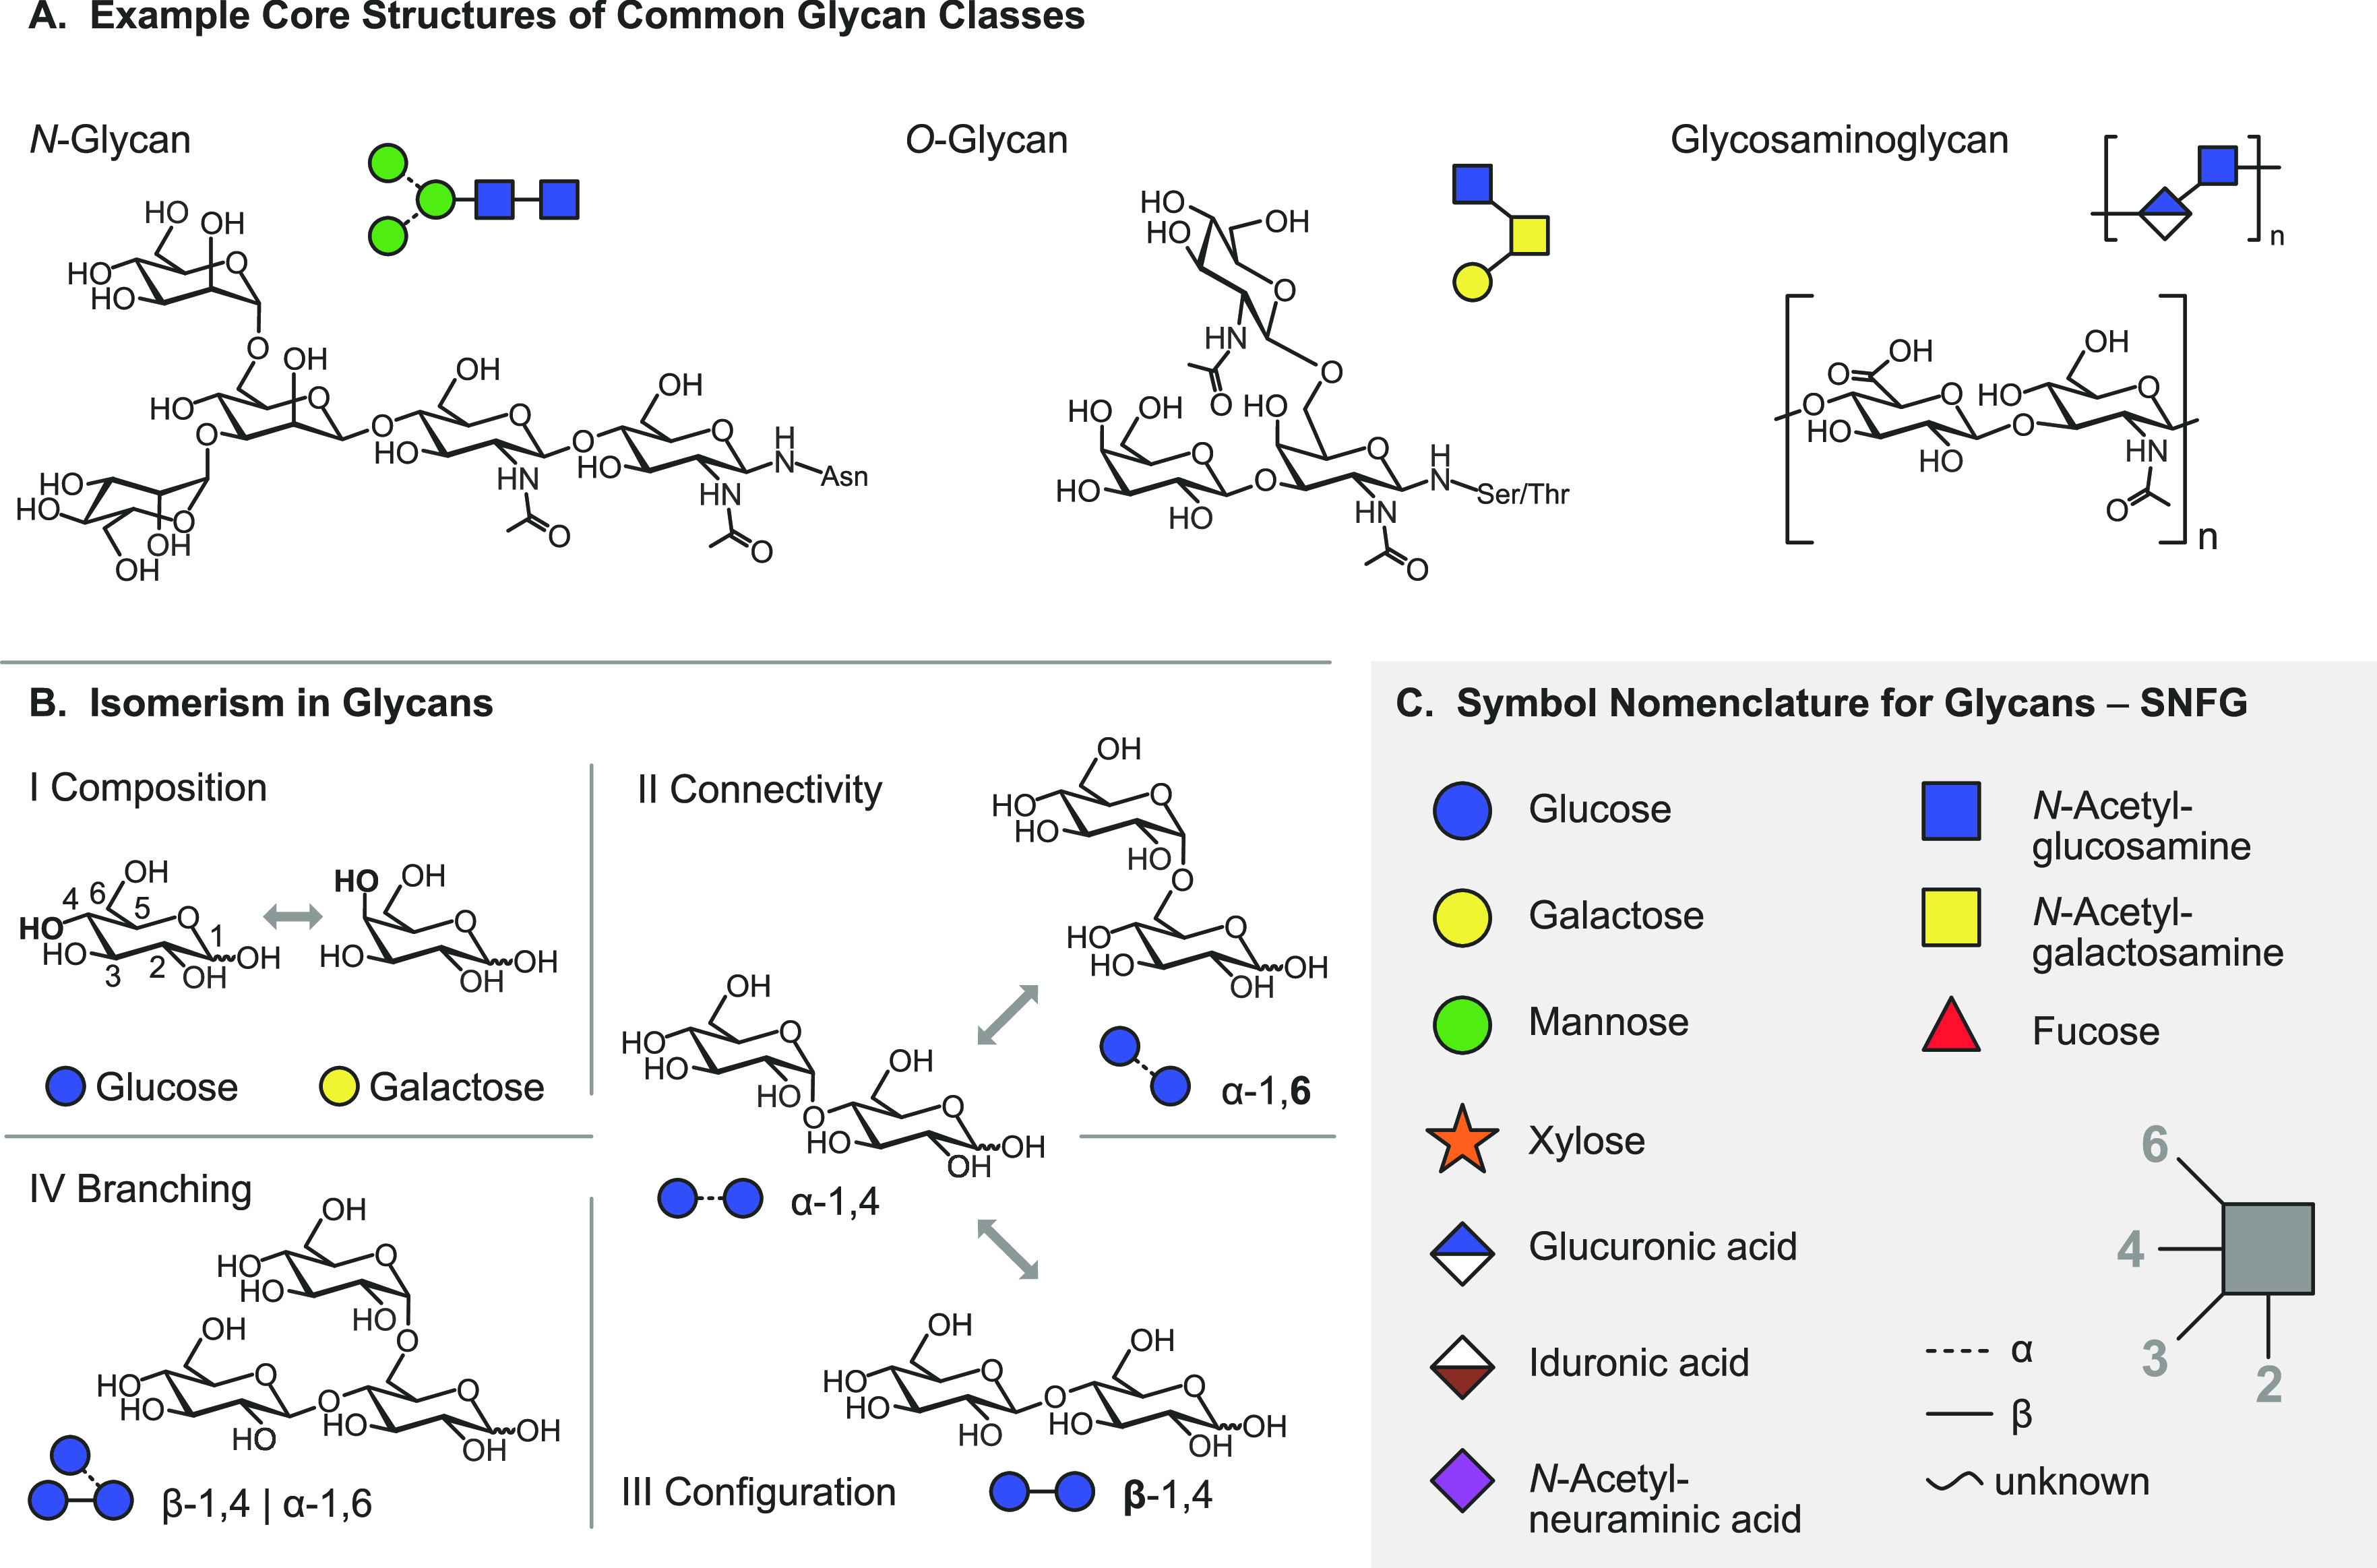
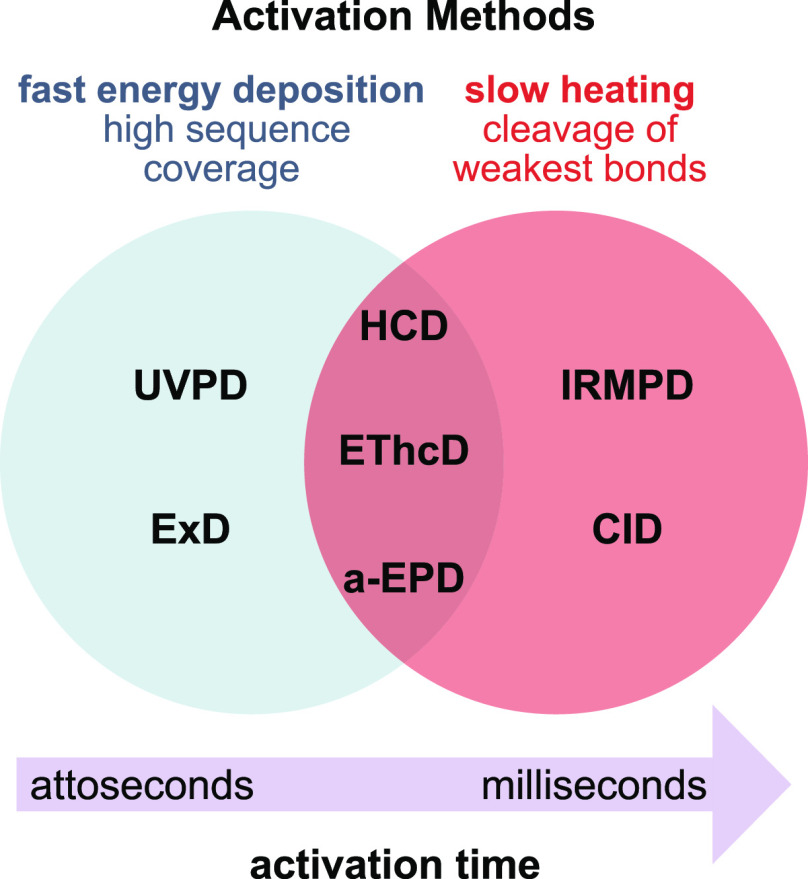
Cells encode information in the sequence of biopolymers, such as nucleic acids, proteins, and glycans. Although glycans are essential to all living organisms, surprisingly little is known about the "sugar code" and the biological roles of these molecules. The reason glycobiology lags behind its counterparts dealing with nucleic acids and proteins lies in the complexity of carbohydrate structures, which renders their analysis extremely challenging. Building blocks that may differ only in the configuration of a single stereocenter, combined with the vast possibilities to connect monosaccharide units, lead to an immense variety of isomers, which poses a formidable challenge to conventional mass spectrometry. In recent years, however, a combination of innovative ion activation methods, commercialization of ion mobility-mass spectrometry, progress in gas-phase ion spectroscopy, and advances in computational chemistry have led to a revolution in mass spectrometry-based glycan analysis. The present review focuses on the above techniques that expanded the traditional glycomics toolkit and provided spectacular insight into the structure of these fascinating biomolecules. To emphasize the specific challenges associated with them, major classes of mammalian glycans are discussed in separate sections. By doing so, we aim to put the spotlight on the most important element of glycobiology: the glycans themselves.


Conflict of interest statement

The authors declare no competing financial interest.

Figures

Figure 1
Figure 1
Representation of glycan structures and frequently occurring isomers. (A) Example core structures of N-glycans, O-glycans, and glycosaminoglycans are represented using chemical structures and equivalent symbol nomenclature. (B) Isomerism in glycans occurs on different levels: glycan composition, connectivity, configuration, and branching. (C) The symbol nomenclature for glycans offers simplified but unambiguous representations of complex glycan structures. Symbols are shown for the most abundant monosaccharides found in vertebrates.
Figure 2
Figure 2
Domon–Costello nomenclature of carbohydrate fragmentation. A- and X-fragments result from cross-ring cleavages, whereas B- and C-fragments and their Y and Z counterparts originate from glycosidic cleavage between two monosaccharide units. The numbering of bonds in the sugar ring, which is indicated as superscript numerals in cross-ring fragments, is exemplarily shown for one monosaccharide. Figure is based on ref (54).
Figure 3
Figure 3
Time scale and specificity of different ion activation methods. Slow heating methods involve multiple activation events, leading to the cleavage of labile chemical bonds. Fast energy deposition occurs in a single activation step and yields complementary, site-specific fragments. UVPD = ultraviolet photodissociation; ExD = electron-mediated dissociation (including ECD, ETD, EDD, and EID/EED); HCD = higher-energy collisional dissociation; EThcD = electron-transfer/higher-energy collision dissociation; a-EPD = activated electron photodetachment; IRMPD = infrared multiple photon dissociation; CID = collision-induced dissociation.
Figure 4
Figure 4
Influence of ion polarity and the ion activation method on the fragmentation pattern of N-glycans. (A) CID in positive ion mode mainly yields B-fragments from glycosidic cleavage. The abundance of cross-ring fragments can be increased by the coordination of metal cations (B) or by employing CID in negative ion mode (C). Figure reprinted with permission from ref (95). 2020 Copyright Wiley-VCH. (D) ECD yields both glycosidic and cross-ring cleavage. Figure adapted with permission from ref (85). Copyright 2007 American Chemical Society. (E) UVPD of N-glycans yields a wealth of fragments, which are informative but challenging to interpret. Only cross-ring fragments are shown in the accompanying structure for clarity. Figure adapted with permission from ref (76). Copyright 2011 American Chemical Society.
Figure 5
Figure 5
Overview and basic principles of ion mobility spectrometry techniques commonly applied in glycan analysis.
Figure 6
Figure 6
Direct absorption vs action spectroscopy. (A) Concept of direct absorption spectroscopy. The Lambert–Beer law relates the intensity of transmitted light I at a specific frequency ν to the intensity of the incident light I0, the absorption cross section σ, the path length l, and the particle density N. (B) Concept of action spectroscopy (upper panel). The equation is derived from the Lambert–Beer law and relates the number of unaffected ions n at a specific frequency ν to the number of precursor ions n0, the absorption cross section σ(ν), and the photon fluence F(ν). IRMPD time-of-flight mass spectra of a m/z-selected highly sulfated pentasaccharide without (middle panel) and with (lower panel) resonant IR irradiation. Two fragments with a sequential loss of neutral SO3 are observed upon multiple photon dissociation at 1264 cm–1.
Figure 7
Figure 7
Comparison of types of IR action spectroscopy. (A) Instrumentation and scheme of action for infrared multiple photon dissociation (IRMPD) spectroscopy. With resonant irradiation, multiple IR photons excite the intact parent ion until the fragmentation threshold is reached. Fragment and parent ions are detected. (B) Instrumentation and scheme of action for messenger (tagging) spectroscopy. Ions are tagged with buffer gas atoms or molecules, e.g., N2, He, or Ar, in a cryogenic ion trap. With resonant irradiation typically with a single photon, the tag is detached, and the bare ion is detected. (C) Instrumentation and scheme of action for cryogenic spectroscopy in helium nanodroplets. The ions are picked up by helium nanodroplets in an ion trap and cooled to 0.4 K. With resonant irradiation, the ion is excited and immediately cooled again by evaporative cooling. After several iterations, the ion is released from the nanodroplet and detected.
Figure 8
Figure 8
Schematic overview of cold-ion UV spectroscopy. (A) Simplified representation of an experimental scheme for recording UV spectra of cold ions. m/z-Selected parent ions, represented by three joint spheres, are cooled in a cryogenic ion trap and probed by UV radiation from a tunable laser, inducing photodissociation and/or photodetachment (latter not shown). The parent species and its photofragments (lone spheres) are extracted from the trap and transferred to a simultaneous mass analyzer, such as a ToF or FTMS device. (B) Plotting the overall fragmentation yield as a function of photon energy yields the UV optical spectrum of the parent ion. 2D UV-MS fingerprints correlate UV optical spectroscopic information and MS data. The fingerprints display entire fragment ion spectra as the function of excitation wavelength, condensing more analytical information into UV-MS matrices.
Figure 9
Figure 9
Overview of the structure of human milk oligosaccharides. (A) The five monosaccharide building blocks and basic structural blueprint of human milk oligosaccharides (HMOs), shown on the example of a hypothetical triantennary glycan. (B) Typical examples of neutral HMOs, highlighting both unmodified and fucosylated structures. (C) Representative acidic HMOs carrying one or more sialic acid residues.
Figure 10
Figure 10
Electron detachment dissociation (EDD) of human milk oligosaccharide dianions. (A) EDD tandem mass spectrum of LST b as [M – H + Cl]2–, along with (B) the corresponding fragmentation pattern. Product ions depicted in bold appeared uniquely for the chloride-adducted species and were not observed upon EDD of the doubly deprotonated analogue. Fragments resulting from multiple cleavage sites are designated with a slash. Reprinted with permission from ref (269). Copyright 2012 American Society for Mass Spectrometry.
Figure 11
Figure 11
Electron transfer dissociation (ETD) of metal-ion-adducted human milk oligosaccharides. (A) ETD fragmentation pattern of reduced, permethylated LST c as [M + Mg]2+ (m/z 652.3). Note the diagnostic cross-ring fragments enabling the assignment of the LNnT core and the Neu5Ac linkage position. (B) Corresponding ETD tandem mass spectrum. Fragments between m/z 1142.2 and 1216.4 are attributed to cleavages within the sialic acid residue. Reprinted with permission from ref (257). Copyright 2011 American Society for Mass Spectrometry.
Figure 12
Figure 12
193 nm ultraviolet photodissociation (UVPD) of deprotonated human milk oligosaccharides. (A) Product ion spectra of singly deprotonated LST b (m/z 997) employing (A) collision-induced dissociation (CID) and (B) 193 nm UVPD. The corresponding (C) CID and (D) UVPD fragmentation patterns and assignments. The precursor ion is labeled with an asterisk. Reproduced with permission from ref (76). Copyright 2011 American Chemical Society.
Figure 13
Figure 13
Radical-directed dissociation (RDD) of protonated human milk oligosaccharides at 266 nm. (a) RDD tandem mass spectrum and product ion assignment of singly protonated LNDFH I labeled with 4-iodoaniline. (b) RDD of the singly protonated LNDFH II isomer labeled with the same radical precursor. Reprinted with permission from ref (277). Copyright 2014 Elsevier B.V.
Figure 14
Figure 14
Nondissociative electron transfer (ETnoD) combined with traveling wave ion mobility (TWIM) separations for the analysis of fucosylated milk oligosaccharides. (a) Collision cross section (CCS) distributions of LNFP I and V isomers as calcium and barium ion adducts, along with (b) the CCS distributions of the respective singly charged radical ETnoD products. (c) CCS distributions of LNDFH I and II isomers as calcium and barium ion adducts and (d) that of the respective ETnoD products. Reproduced with permission from ref (280). Copyright 2015 American Chemical Society.
Figure 15
Figure 15
Ab initio molecular dynamics reveals rapid charge migration in a deprotonated milk oligosaccharide. (a) Snapshots of singly deprotonated LNH at different simulation times. Colored spheres indicate the OH groups involved in charge migration. The position of the charge within each structure is highlighted by a black circle. (b) Chemical structure of LNH; the colored spheres correspond to the OH groups in the upper panel that are deprotonated over the 20 ps simulation. Reprinted from ref (283). Published by The Royal Society of Chemistry. Copyright 2016 Struwe et al. (Creative Commons Attribution 3.0 Unported License).
Figure 16
Figure 16
Ion mobility separation of human milk oligosaccharides in structures for lossless ion manipulations. The upper panel shows the arrival time distributions (ATDs) of singly protonated LNT and LNnT, resulting from a 31.5 m separation. The lower panel depicts the ATDs of three LNFP isomers as the outcome of a 45 m separation. LNFP isomers were measured as doubly charged [M + H + K]2+ species. Reprinted with permission from ref (134). Copyright 2018 The Royal Society of Chemistry.
Figure 17
Figure 17
Gas-phase IR spectroscopy of human milk oligosaccharides. Arrival time distributions and vibrational spectra of sodiated (a) LNDFH I and (b) LNDFH II, each tagged with one molecule of N2. The drift times and peak widths are (a) 9.21 ms, fwhm = 0.13 ms; and (b) 9.32 ms, fwhm = 0.13 ms. Reprinted with permission from ref (292). Copyright 2018 The Royal Society of Chemistry.
Figure 18
Figure 18
Most common types and modifications of N-glycans found in mammals. (A) Exemplary structures for three types of N-glycans: high-mannose (sometimes called oligomannose), complex, and hybrid. (B) Common core modifications of mammalian N-glycans and chitobiose core, a subunit common to all N-glycans. (C) Common antennary modifications.
Figure 19
Figure 19
Fourier transform ion cyclotron resonance tandem mass spectra of a deprotonated and chlorinated asialylated complex biantennary N-glycan, [M – H + Cl]2–. Mass spectrum employing (top) EDD and (middle) CID on the precursor ion [M – H + Cl]2–. Product ions shown in bold are unique to fragmentation of [M – H + Cl]2– compared to the doubly deprotonated species [M – 2H]2–. An asterisk indicates doubly charged product ions, whereas squares indicate water loss from adjacent product ions. Product ions bearing a chloride anion are highlighted with superscripted Cl. (bottom) observed fragmentation pattern after EDD of [M – H + Cl]2–. Reprinted with permission from reference. Copyright 2012 American Society for Mass Spectrometry.
Figure 20
Figure 20
Ion mobility separation with subsequent collision-induced dissociation (CID) of a mixture of complex N-glycans as [M + H2PO4] ions. (a) TWIM-MS ATD for GlcNAc1Man3GlcNAc2 released from chicken albumin. CID tandem mass spectra for the features (b) b, (c) c, and (d) d in the ATD. Reprinted with permission from ref (278). Copyright 2009 Elsevier B.V.
Figure 21
Figure 21
TWIM-MS/MS of sodiated complex N-glycan from a human parotid gland. (A) ATDs of diagnostic fragments with TWCCSN2. (B) Tandem mass spectrum of [M + Na]+, including the representation of the precursor structure and fragment assignments. Glycan structures are represented using the Oxford system (notable differences to SNFG nomenclature: yellow diamond = Gal, red diamond = Fuc). Reproduced with permission from ref (374). Copyright 2017 American Chemical Society.
Figure 22
Figure 22
Comparison of IR spectra of protonated complex N-glycans. IR spectrum of the GlcNAc2Man3GlcNAc2 reference (purple) and of GlcNAc2Man3GlcNAc2 after enzymatic cleavage from Gal2GlcNAc2Man3GlcNAc2 (gray). Figure adapted with permission from ref (382). Copyright 2020 American Chemical Society.
Figure 23
Figure 23
Typical O-glycan structures. (A) The most abundant O-glycan core structures 1–4 and the four less common cores 5–8 shown using the symbol nomenclature for glycans (SNFG). (B) Typical extensions of glycan cores are the attachment of N-acetyllactosamine units, sialylation, and fucosylation. (C) Examples for fully processed O-glycan structures based on core 1 (upper structure) and core 3 (lower structure) including their linkage site to the glycoprotein. At the nonreducing end, O-glycans often contain antigenic structures such as the ABO and Lewis blood group determinants, which are highlighted by gray boxes.
Figure 24
Figure 24
Ion-mobility-based comparison of two sets of O-glycan isomers as [M – H] and [M + H2PO4] ions. (A) Arrival time distributions (ATDs) of two isomers composed of Hex1HexNAc2 measured as deprotonated (m/z 587, blue) or phosphate adduct (m/z 685, black) ions. (B) ATDs of two Hex1HexNAc 2dHex1 isomers as deprotonated (m/z 733, blue) or phosphate adduct (m/z 831, black) ions. Structures are depicted using the symbol nomenclature for glycans (SNFGs): yellow square = GalNAc, yellow circle = Gal, blue square = GlcNAc, red triangle = Fuc. Figure adapted and modified with permission from ref (411). Copyright 2019 American Chemical Society.
Figure 25
Figure 25
From early tandem MS experiments to IR spectroscopy and ion mobility experiments investigating fucose migration and internal residue loss. (A) Schematic example of fucose migration and internal residue loss for a trisaccharide (upper panel) in the symbol nomenclature for glycans (SNFG) (lower panel, left) and chemical representation of β-l-fucose, a 6-deoxy-l-galactose (lower panel, right). (B) Tandem MS experiments showing unexpected m/z-fragments from internal residue loss. Figure adapted with permission from ref (66). Copyright 2002 American Chemical Society. (C) IR spectroscopy experiments showing fucose migration in the trisaccharides Lex and BG-H2 as in-source fragmentation products of a tetrasaccharide (upper panel) and as intact parent ions (middle and lower panel). Figure reprinted with permission from ref (205). Copyright 2018 Wiley-VCH. (D) IMS experiments distinguishing two fragments with identical m/z ratio but at least one with a rearranged fucose monosaccharide from their ATD. Figure reprinted with permission from ref (425). Copyright 2019 Wiley-VCH.
Figure 26
Figure 26
General structure of glycosaminoglycans. Overview of the characteristic disaccharide units, sulfation motifs, and potential protein linkages found in the four main glycosaminoglycan families. (A) Repetitive hyaluronan chains are not modified further by sulfation or epimerization. Uniquely, biosynthesis starts with the formation of a chitin cap and proceeds toward the reducing end. (B) Chondroitin and dermatan sulfate display a variety of sulfation motifs. The chains are linked to serine residues of proteoglycan core proteins through a specific tetrasaccharide linker. (C) Heparan sulfate and heparin represent the most diverse family of glycosaminoglycans. The heparin chain depicted corresponds to the antithrombin III binding sequence, mimicked by the synthetic anticoagulant fondaparinux. Discovery of additional sulfation motifs in the future cannot be ruled out. (D) Keratan sulfate contains galactose instead of hexuronic acid. The chains may be linked to both asparagine and serine/threonine residues of core proteins.
Figure 27
Figure 27
Common glycosaminoglycan depolymerization strategies shown through the example of heparan sulfate/heparin. (A, left) Enzymatic depolymerization of GAG chains may be performed using glycosidases, resulting in hydrolytic cleavage that preserves the hexuronic acid stereochemistry. To obtain oligosaccharide fragments covering the full sequence, enzymes with endolytic activity are necessary. Heparanases are endo-β-glucuronidases cleaving at the reducing end of GlcA residues in moderately sulfated HS/heparin chains. (A, right) Prokaryotic lyases, such as heparinase I–III, act via a β-eliminative mechanism, leading to Δ4,5-unsaturated uronic acid residues at the new nonreducing end. Consequently, stereochemical information is lost in the process. (B, left) Benzyl esterification with alkaline β-elimination may be applied for the depolymerization of GAGs, mimicking lyase activity. (B, right) Deaminative cleavage preserves hexuronic acid stereochemical information at the cleavage site but alters the structure of the glucosamine through the formation of 2,5-anhydromannose. The reaction is blocked in the presence of N-acetyl groups on glucosamines, making prior deacetylation necessary.
Figure 28
Figure 28
Sulfate equivalent loss of glycosaminoglycans in the gas phase. (A) Sulfate loss in the form of neutral SO3 upon ion heating. Protonated sites are more prone to undergo decomposition. (B) Deprotonation of sulfate groups inhibits the undesirable reaction. Quaternary ammonium or metal ions (M+) may neutralize the charge of deprotonated sulfate groups, reducing intramolecular Coulomb repulsion and facilitating the removal of protons.
Figure 29
Figure 29
Electron detachment dissociation (EDD) vs slow-heating fragmentation of glycosaminoglycans. (A) EDD tandem mass spectrum and corresponding fragmentation pattern of a synthetic heparan sulfate tetrasaccharide as [M – 2H]2–. Tandem mass spectra and fragmentation patterns resulting from (B) infrared multiple photon dissociation (IRMPD) and (C) collision-induced dissociation (CID) of the same precursor ion. Doubly charged product ions are indicated with an asterisk. Figure reprinted with permission from ref (86). Copyright 2007 American Society for Mass Spectrometry.
Figure 30
Figure 30
Negative electron transfer dissociation (NETD) fragmentation patterns of synthetic heparin/heparan sulfate hexasaccharides. (a) GlcA-GlcNS6S-IdoA-GlcNS3S-GlcAGlcNS6S; (b) GlcA-GlcNS6S-IdoA-GlcNS6S-GlcA-GlcNS6S; and (c) GlcA-GlcNS6S-IdoA-GlcNS3S6S-GlcA-GlcNS6S. The highly sulfated glycans were measured as [M – H]5– polyanions. Note the diagnostic cross-ring fragments enabling the localization of sulfate groups within the glucosamine residues. Reprinted with permission from ref (509). Copyright 2018 American Society for Mass Spectrometry.
Figure 31
Figure 31
Ultraviolet photodissociation (UVPD) tandem MS of a dermatan sulfate tetrasaccharide at 193 nm. (a) Product ion spectrum of the doubly deprotonated oligosaccharide (m/z 458). (b) The corresponding UVPD fragmentation pattern and structural assignment. (c) Donut plot depicting the distribution of photofragments based on summed abundances of fragment types. Reproduced with permission from ref (515). Copyright 2019 American Chemical Society.
Figure 32
Figure 32
Gated trapped ion mobility separation of heparin/heparan sulfate oligosaccharides. (A) Arrival time distributions (ATDs) of two isomeric tetrasaccharides (blue and red traces) and that of their mixture (black trace). (B) ATDs of three highly sulfated hexasaccharide isomers (blue, green, and red traces) and that of their mixture (black trace). Collision cross sections of each compound (measured as triply deprotonated species) are listed below. R stands for an aminopentyl linker. (C) Relative quantification of the two hexasaccharide stereoisomers (compounds 3 and 4) enabled by trapped ion mobility spectrometry. The peak area ratio, A3/(A3 + A4), was averaged over three technical replicates and plotted against the ratio of the concentration of compound 3 over the total concentration, C3/(C3 + C4). Error bars represent the standard deviations of three measurements. Figure adapted with permission from ref (525). Copyright 2019 American Chemical Society.
Figure 33
Figure 33
Graphical overview of the SIMMS2 strategy for de novo glycosaminoglycan sequencing. (a) Characteristic domain structure of heparan sulfate (HS) chains and a matching set of shorter HS oligosaccharide standards. (b) MS and tandem MS provide m/z values for intact and fragment ions, while ion mobility spectrometry allows for the determination of collision cross sections (CCSs). (c) Through comparison of unknowns with database elements, the library containing m/z values and CCSs of ions generated from known standards enables the determination of unknown HS sequences. (d) Illustration of the iterative loop process for expanding the CCS data set, enabling continuous development of the library-based SIMMS2 strategy. Figure reprinted from ref (527). Copyright 2020 Miller et al. (Creative Commons Attribution 4.0 International License).
Figure 34
Figure 34
IRMPD spectra of heparan sulfate (HS) and chondroitin sulfate (CS) disaccharides. Scheme: Δ4,5 unsaturated disaccharides derived from HS (left) and CS (right). (A, B) IRMPD spectra of deprotonated Hp II-A (red: [Hp II-A – H]) and Hp III-A (black: [Hp III-A – H]) in the 550–1850 and 2700–3700 cm–1 spectral ranges. Right panels: IRMPD spectra of CS-A (red) and CS-C (blue) in different charge states. (C) Singly deprotonated [CS-A – H] and [CS-C – H]. (D) Doubly deprotonated [CS-A – 2H]2– and [CS-C – 2H]2–. (E) NH4+ cationic complexes [CS-A + NH4]+ and [CS-C – NH4]+. Figure reproduced with permission from ref (537). Copyright 2017 American Chemical Society.
Figure 35
Figure 35
Conformation of chondroitin sulfate disaccharides in the gas phase revealed by IR spectroscopy and quantum chemical calculations. (A) Cryogenic IR spectra of a triply sulfated disaccharide investigated as a [M – 3H]3– anion with m/z of 205. (B) Calculation of the dihedral angles at the glycosidic bond with respect to the relative energies of the conformers presented in a Ramachandran-type plot for the glycosidic linkage. (C) Calculation of the intramolecular distance of charged sulfates to carboxyl and amide groups in Å in conformers with relative energies ΔEPBE < 50 kJ mol–1. In the case of the triply sulfated and triply charged disaccharide, the low-energy conformers present in the gas phase are similar to each other. The empty diamond symbol represents a Δ4,5-unsaturated hexuronic acid residue. Figure reproduced from ref (540). Copyright 2021 Lettow et al. (Creative Commons Attribution 4.0 International License).
Figure 36
Figure 36
General scheme of bottom-up glycoproteomics workflows. Glycoproteins are extracted and enriched from biological samples. The glycoproteins are digested by proteolytic enzymes, and the resulting glycopeptides are enriched from the digestion mixture. The concentrated glycopeptides are separated via HPLC or CE to facilitate isomeric identification and subsequently analyzed via MS/MS. Complete glycopeptide characterization requires three elements: the sequencing of the peptide backbone, the sequencing of the glycan moiety, and the localization of the glycosylation site within the amino acid sequence.
Figure 37
Figure 37
Ion-mobility-resolved parallel fragmentation of a triantennary, fully sialylated complex N-glycopeptide structure via collision-induced dissociation (CID) and electron transfer dissociation (ETD) in positive ion mode. (a) 2D plot of glycopeptide precursor intensity against m/z and drift time. Precursor activation via ETD results in charge reduction which allows separation of activated (dt2, green) and nonactivated precursor (dt1, blue) on the IMS level. (b) Tandem mass spectrum of the glycosylated species at dt1 after CID activation. (c) Tandem mass spectrum of the glycosylated species at dt2 after ETD activation. (d) Visual representation of the glycopeptide precursor and the resulting fragmentation pattern after CID (blue) and ETD (green) fragmentation. Figure reprinted with permission from ref (569). Copyright 2017 The Royal Society of Chemistry.
Figure 38
Figure 38
Ion mobility–mass spectrometry (IM-MS) workflow for regiochemistry analysis of N-acetylneuraminic acid (Neu5Ac) linkages in a1-proteinase inhibitor (A1PI). (A) A1PI isolated from human plasma and recombinantly expressed in Chinese hamster ovary (CHO) cells was purified and digested with trypsin, and the glycopeptides were HILIC-enriched. (B) Fragmentation of the obtained glycopeptides and subsequent IM-MS analysis of the characteristic B3-trisaccharide fragments (m/z 657) enabled the differentiation of α2,3- from α2,6-linked Neu5Ac. The observed fragment drift times and TWCCSN2 are independent of the underlying precursor sequence. Reprinted from ref (590). Published by The Royal Society of Chemistry. Copyright 2016 Hinneburg et al. (Creative Commons Attribution 3.0 Unported License).
Figure 39
Figure 39
Structural diversity of glycolipids. (A) Glycolipids are classified according to the lipid core structure into three categories. (B) The most common glycolipids in mammals are glycosphingolipids, which are assembled in a modular fashion from a sphingoid base, a fatty acid, and a glycan headgroup. (C) The first monosaccharide attached to ceramides in mammals is either β-Gal or β-Glc. The latter can be elongated to yield common glycan core structures. (D) Bacterial glycoglycerolipids often contain building blocks that are uncommon for mammalian glycolipids, including α-linked monosaccharides and lipid chain branching or cyclopropane rings. The glycoglycerolipid shown here was isolated from Lactobacillus plantarum.
Figure 40
Figure 40
Illustration of fragment ions produced by ultraviolet photodissociation (UVPD) of GSLs. Contrary to collision-induced dissociation, UVPD induces cross-ring cleavage (A/X-ions) in addition to glycosidic bond cleavage. Furthermore, irradiation with 193 nm UV light causes several unique cleavages within the sphingoid base and the fatty acid of the ceramide tail. Figure reproduced with permission from ref (627). Copyright 2013 American Chemical Society.
Figure 41
Figure 41
Comparison of the performance of several MS-based techniques in distinguishing between the diastereoisomeric glycolipids Glc- and Gal-sphingosine (So). (A) Classical CID induces cleavage of the glycosidic bond and concomitant loss of the stereochemical information. (B/C) RDD and charge inversion induce alternative fragmentation mechanisms and yield different relative intensities of fragments. (D) SLIM IM-MS can partially separate sodiated Glc and Gal sphingosine after four passes (ca. 60 m). (E) Gas-phase IR spectroscopy is sensitive toward stereochemical changes and yields diagnostic spectroscopic fingerprints for Glc and Gal epimers.
Figure 42
Figure 42
Spectral deconvolution of biological glycolipid mixtures into single isomers. IR spectra of biological mixtures from α-galactosidase (1) and α-glucosidase (2) knockout mice were deconvoluted to identify contributing isomers. IR spectra of the synthetic isomers α- and β-Glc and GalCer are required for isomer assignment. The main isomer in both biological samples is β-GlcCer, but α-glucosidase deficiency also leads to a measurable increase in α-GlcCer. Figure reprinted from ref (239). Copyright 2021 Kirschbaum et al. (Creative Commons Attribution 4.0 International License).

References

    1. Varki A. Biological Roles of Glycans. Glycobiology 2017, 27, 3–49. 10.1093/glycob/cww086. - DOI - PMC - PubMed
    1. Klemm D.; Heublein B.; Fink H.-P.; Bohn A. Cellulose: Fascinating Biopolymer and Sustainable Raw Material. Angew. Chem., Int. Ed. 2005, 44, 3358–3393. 10.1002/anie.200460587. - DOI - PubMed
    1. Hart G. W.; Copeland R. J. Glycomics Hits the Big Time. Cell 2010, 143, 672–676. 10.1016/j.cell.2010.11.008. - DOI - PMC - PubMed
    1. Palaniappan K. K.; Bertozzi C. R. Chemical Glycoproteomics. Chem. Rev. 2016, 116, 14277–14306. 10.1021/acs.chemrev.6b00023. - DOI - PMC - PubMed
    1. Petrescu A.-J.; Wormald M. R.; Dwek R. A. Structural Aspects of Glycomes with a Focus on N-Glycosylation and Glycoprotein Folding. Curr. Opin. Struct. Biol. 2006, 16, 600–607. 10.1016/j.sbi.2006.08.007. - DOI - PubMed

Publication types