. 2021 Sep 7:10:e71270.
doi: 10.7554/eLife.71270.

β-hydroxybutyrate accumulates in the rat heart during low-flow ischaemia with implications for functional recovery

Affiliations

β-hydroxybutyrate accumulates in the rat heart during low-flow ischaemia with implications for functional recovery

Ross T Lindsay et al. Elife. .

Abstract

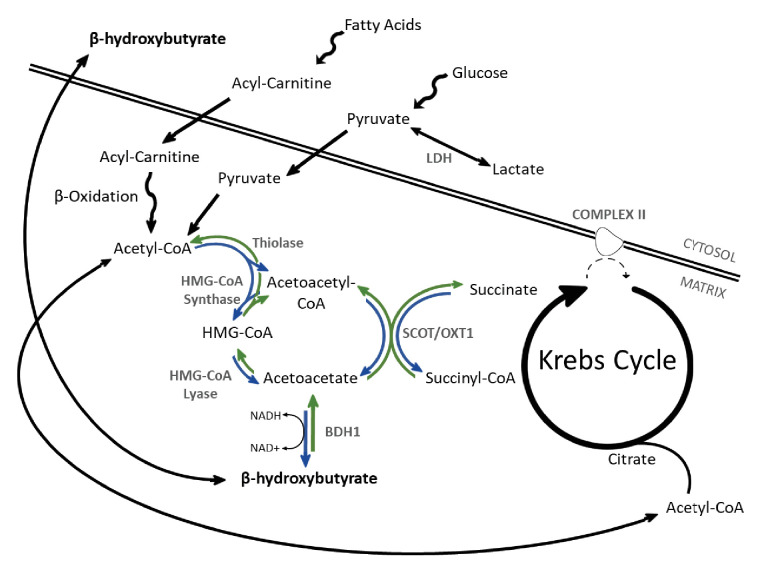
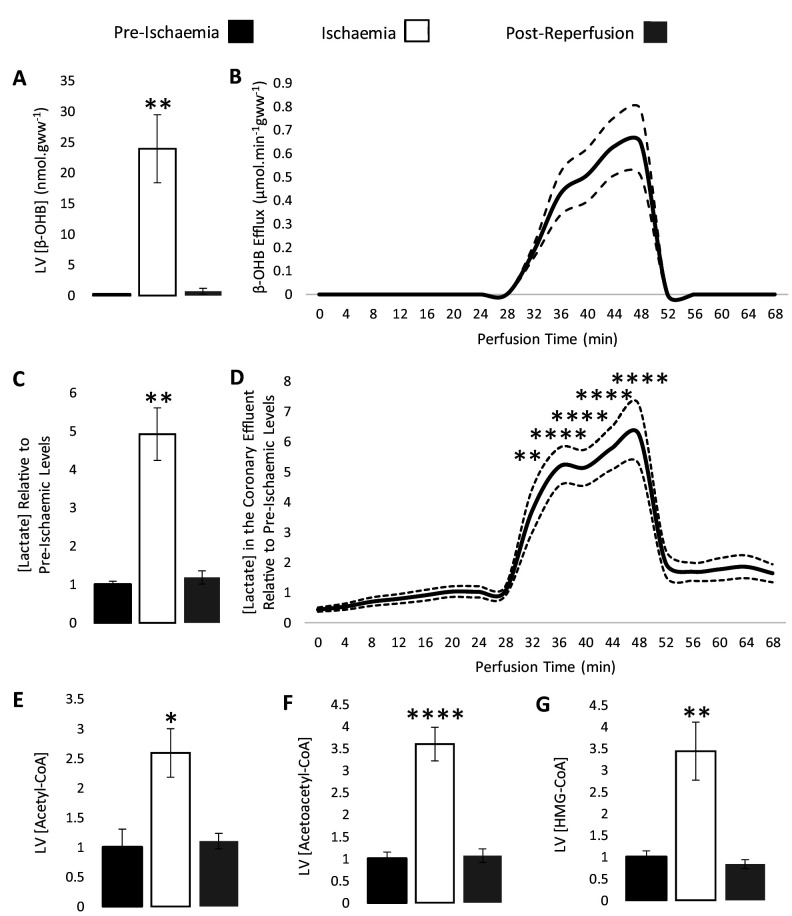
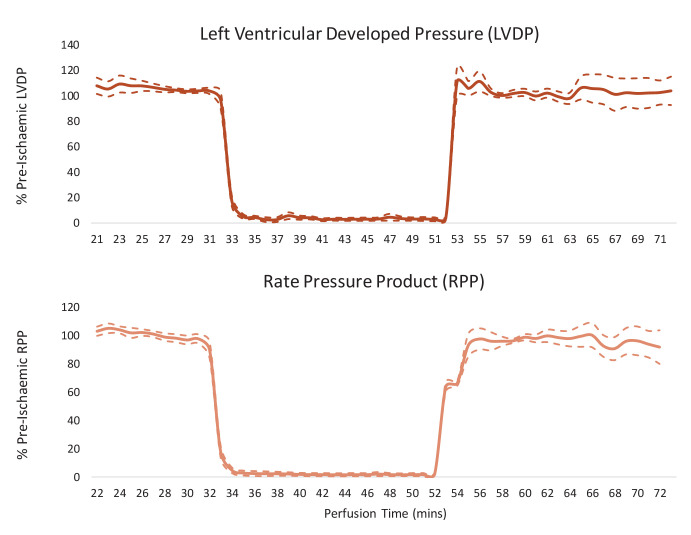
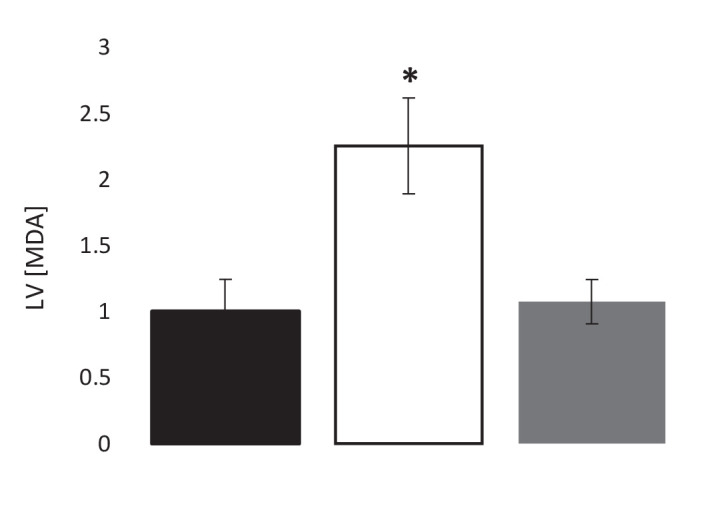
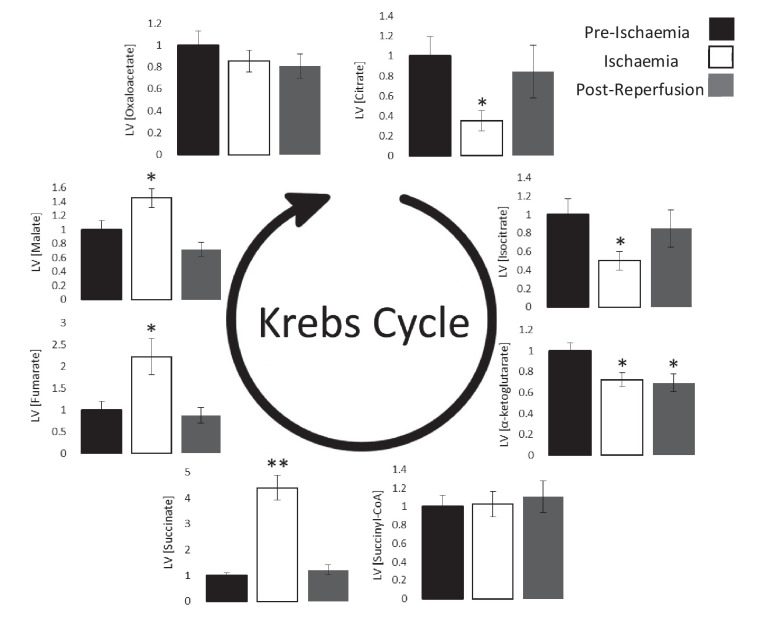
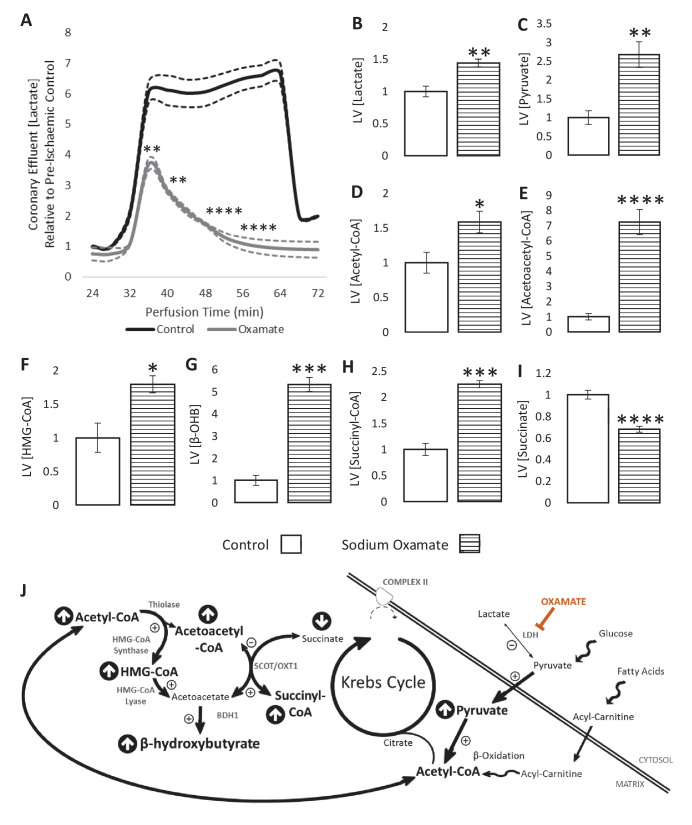
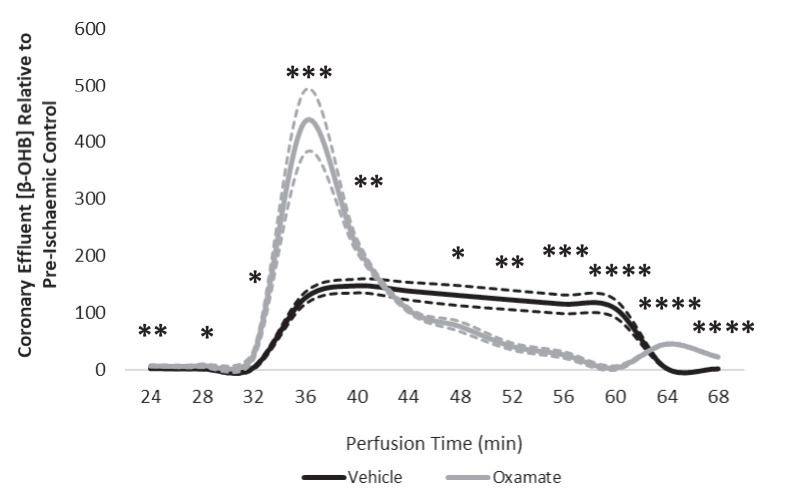
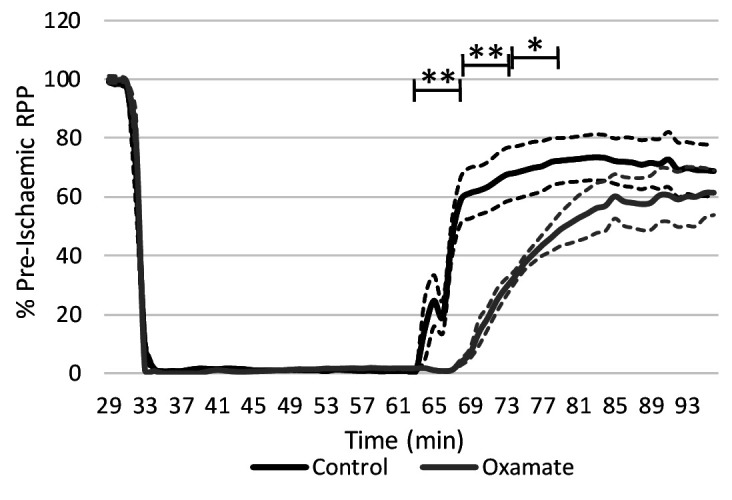
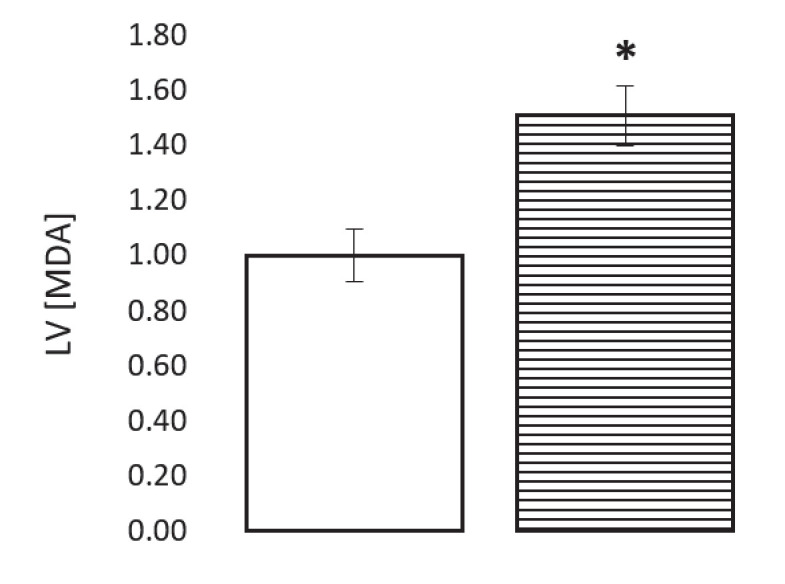
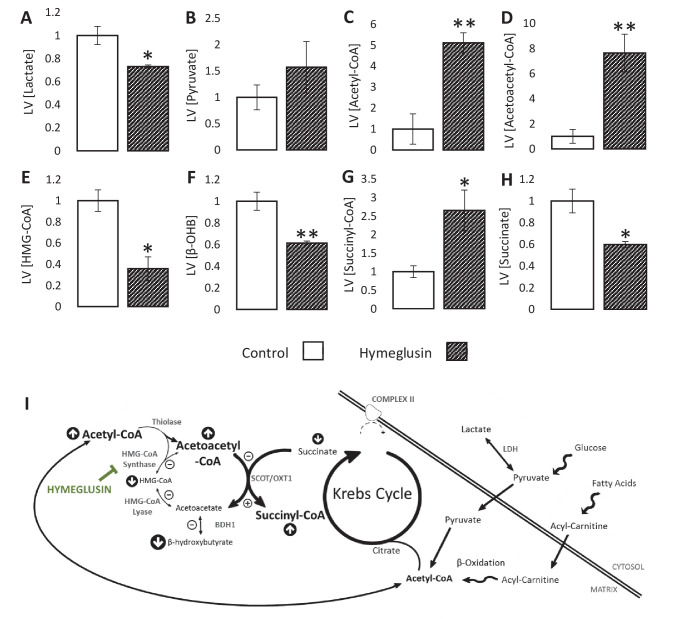
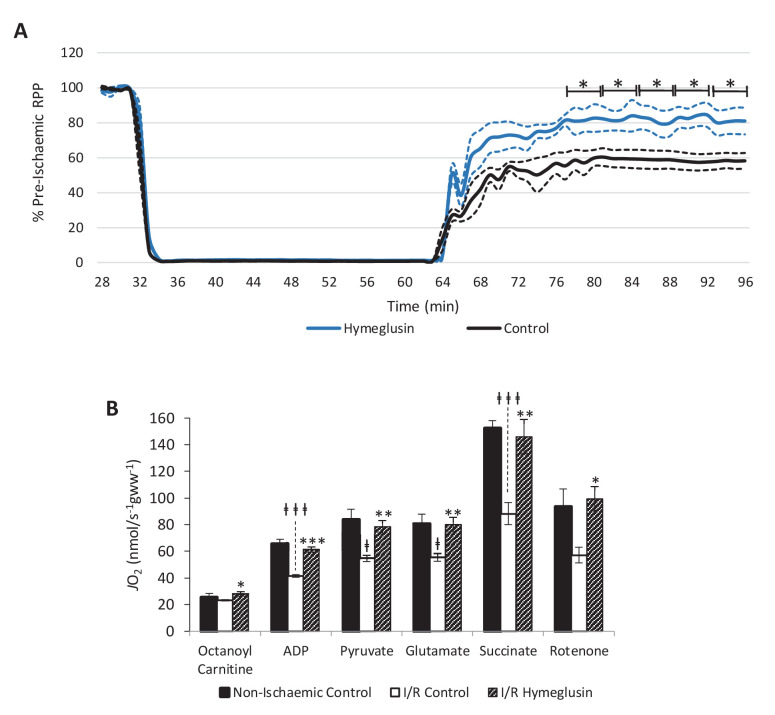
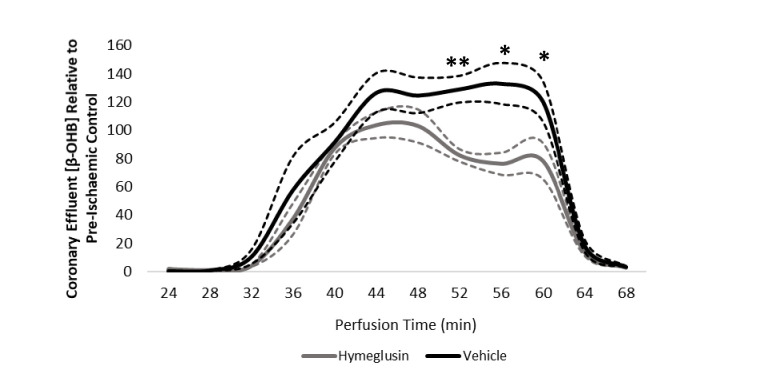
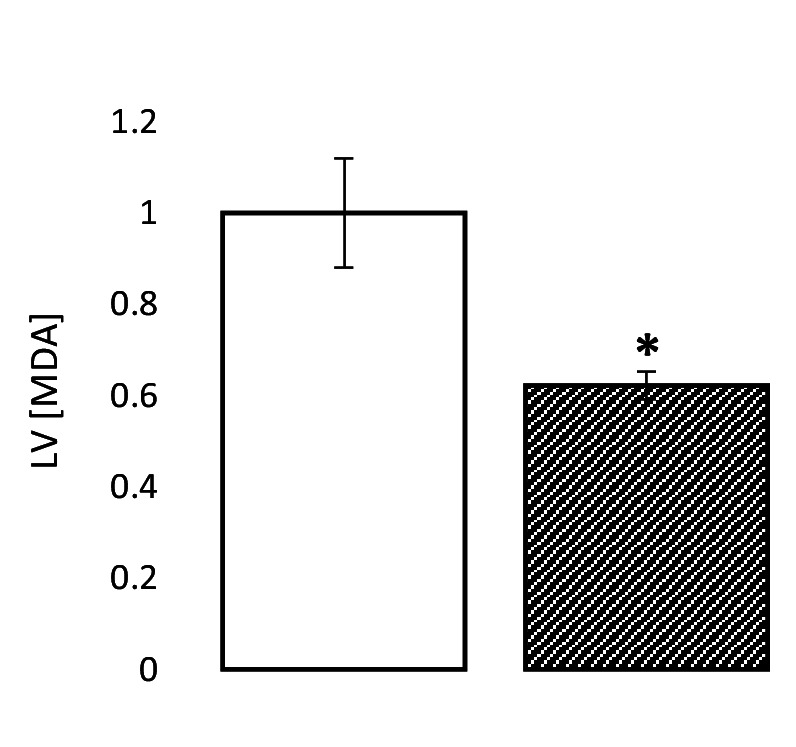
Extrahepatic tissues which oxidise ketone bodies also have the capacity to accumulate them under particular conditions. We hypothesised that acetyl-coenzyme A (acetyl-CoA) accumulation and altered redox status during low-flow ischaemia would support ketone body production in the heart. Combining a Langendorff heart model of low-flow ischaemia/reperfusion with liquid chromatography coupled tandem mass spectrometry (LC-MS/MS), we show that β-hydroxybutyrate (β-OHB) accumulated in the ischaemic heart to 23.9 nmol/gww and was secreted into the coronary effluent. Sodium oxamate, a lactate dehydrogenase (LDH) inhibitor, increased ischaemic β-OHB levels 5.3-fold and slowed contractile recovery. Inhibition of β-hydroxy-β-methylglutaryl (HMG)-CoA synthase (HMGCS2) with hymeglusin lowered ischaemic β-OHB accumulation by 40%, despite increased flux through succinyl-CoA-3-oxaloacid CoA transferase (SCOT), resulting in greater contractile recovery. Hymeglusin also protected cardiac mitochondrial respiratory capacity during ischaemia/reperfusion. In conclusion, net ketone generation occurs in the heart under conditions of low-flow ischaemia. The process is driven by flux through both HMGCS2 and SCOT, and impacts on cardiac functional recovery from ischaemia/reperfusion.

Keywords: Heart; Ischaemia; Langendorff; biochemistry; cardiomyocyte; cell biology; chemical biology; rat.


Conflict of interest statement

RL Ross T. Lindsay is affiliated with BioPharmaceuticals R&D, AstraZeneca Ltd. The author has no financial interests to declare. SD, DK, DM, JW, CC, JG, AM No competing interests declared

Figures

Figure 1.
Figure 1.. β-OHB metabolism.
Catabolism of both fatty acids and glucose yields acetyl-coenzyme A (acetyl-CoA), following uptake to the mitochondria via acyl-carnitines and pyruvate, respectively. In the liver, ketogenesis involves the conversion of acetyl-CoA to acetoacetyl-CoA, β-hydroxy-β-methylglutaryl-CoA (HMG-CoA), acetoacetate, and then β-hydroxybutyrate in a series of reversible reactions. The enzymes which catalyse this are HMG-CoA synthase, HMG-CoA lyase, and β-hydroxybutyrate dehydrogenase (BDH1). In extrahepatic tissues, HMG-CoA can be bypassed through conversion of acetoacetate to acetoacetyl-CoA in conjunction with the conversion of succinyl-CoA to succinate, catalysed by succinyl-CoA-3-oxaloacid CoA transferase (SCOT). Rather than being oxidised in the mitochondria, under anaerobic conditions such as ischaemia, pyruvate can instead be converted to lactate by the enzyme lactate dehydrogenase (LDH). For bidirectional enzymes involved in both ketolysis and ketogenesis, the direction of ketogenic flux is represented by blue arrows, while ketolytic reactions are represented in green.
Figure 2.
Figure 2.. β-hydroxybutyrate accumulates in the ischaemic rat heart.
Concentrations of β-hydroxybutyrate (β-OHB) in rat heart and the coronary effluent relative to pre-ischaemic levels (A and B), and those of lactate (C and D). Pre-ischaemic, ischaemic, and post-reperfusion concentrations of acetyl-coenzyme A (acetyl-CoA), acetoacetyl-CoA, and β-hydroxy-β-methylglutaryl-CoA (HMG-CoA) in the heart relative to pre-ischaemic levels (E, F, and G). All three groups contained n = 7 hearts. Results are displayed as mean ± SEM. *p<0.05, **p<0.01, ***p<0.001, and ****p<0.0001, relative to pre-ischaemic levels.
Figure 2—figure supplement 1.
Figure 2—figure supplement 1.. Cardiac contractile recovery of reperfused hearts for Figure 2.
Left ventricular developed pressure (LVDP) and rate pressure product (RPP) in hearts subjected to a 20-min 0.56-ml.min-1gww-1 ischaemic period, and then reperfused at 100 mmHg for 20 min following an initial 32-min pre-ischaemic perfusion period. Results are displayed as mean ± SEM (one group of n = 7 hearts).
Figure 2—figure supplement 2.
Figure 2—figure supplement 2.. Pre-ischaemic, post-ischaemic, and post-reperfusion LV levels of the lipid peroxidation marker malondialdehyde (MDA), relative to pre-ischaemic levels (three groups of n = 7).
Results are presented as mean ± SEM. *p<0.05 relative to pre-ischaemia.
Figure 2—figure supplement 3.
Figure 2—figure supplement 3.. Ischaemic β-OHB levels with and without Intralipid in the perfusion buffer.
The ischaemic LV concentrations of β-hydroxybutyrate (β-OHB) of hearts perfused with 11 mM glucose alone, relative to ischaemic hearts perfused with 11 mM glucose and 0.4 mM equivalent Intralipid. All hearts were perfused aerobically at 100 mmHg for 32 min before 32 min of 0.32 ml.min-1.gww-1 low-flow ischaemia before snap-freezing and β-OHB level assessment using liquid chromatography coupled mass spectrometry (LC-MS). n = 7 for both groups, presented as mean ± SEM.
Figure 3.
Figure 3.. Ischaemic Krebs cycle flux.
Concentrations of Krebs cycle intermediates in the left ventricle pre-ischaemia, at the end of the ischaemic period and post-reperfusion, all relative to pre-ischaemic levels. All three groups comprised n = 7 hearts. Results are displayed as mean ± SEM. *p<0.05, **p<0.01, relative to pre-ischaemic levels.
Figure 4.
Figure 4.. LDH inhibition enhances ketone flux in ischaemia.
(A) Coronary effluent lactate levels relative to control pre-ischaemic levels, with and without delivery of 50 mM of the lactate dehydrogenase (LDH) inhibitor sodium oxamate in the perfusion buffer (two groups of n = 5 hearts). Relative to ischaemic controls, the ischaemic LV concentrations of (B) lactate, (C) pyruvate, (D) acetyl-coenzyme A (acetyl-CoA), (E) acetoacetyl-CoA, (F) β-hydroxy-β-methylglutaryl-CoA (HMG-CoA), (G) β-hydroxybutyrate (β-OHB), (H) succinyl-CoA, and (I) succinate with and without delivery of 50 mM of the LDH inhibitor sodium oxamate in the perfusion buffer (two groups, n = 6 hearts each). (J) Schematic depicting the suggested diversion of pyruvate away from lactate production and into β-OHB synthesis. Bold text and upward pointing arrows indicate metabolites which accumulated to a greater level in the presence of oxamate, downward pointing arrows and smaller text indicate those which accumulated to a lesser extent. Bold arrows suggest pathways where flux may be increased in the presence of oxamate. Results are presented as mean ± SEM. *p<0.05, **p<0.01, ***p<0.001, and ****p<0.0001, relative to control.
Figure 4—figure supplement 1.
Figure 4—figure supplement 1.. Coronary effluent β-OHB levels relative to control pre-ischaemic levels, with and without delivery of 50 mM sodium oxamate in the perfusion buffer (two groups of n = 5 hearts each).
Results are presented as mean ± SEM. *p<0.05, **p<0.01, ***p<0.001, ****p<0.0001, relative to control.
Figure 4—figure supplement 2.
Figure 4—figure supplement 2.. Inhibition of lactate dehydrogenase delays functional recovery.
Rate pressure product (RPP) as a percentage of pre-ischaemic levels following 32 min of 0.3 ml.min−1gww−1 low-flow ischaemia and 32 min of aerobic reperfusion at 100 mmHg (two groups, n = 5 hearts each). Results are presented as mean ± SEM. *p<0.05, **p<0.01, relative to control.
Figure 4—figure supplement 3.
Figure 4—figure supplement 3.. The ischaemic LV MDA concentration with and without treatment with 50 mM of the LDH inhibitor sodium oxamate in the perfusion buffer, relative to ischaemic controls (two groups of n = 6 hearts each).
Results are presented as mean ± SEM. *p<0.05, relative to control.
Figure 5.
Figure 5.. Inhibition of the ketogenic enzyme HMG-CoA synthase impairs ketone flux.
Relative to ischaemic controls, the ischaemic LV concentrations of (A) lactate, (B) pyruvate, (C) acetyl-coenzyme A (acetyl-CoA), (D) acetoacetyl-CoA, (E) β-hydroxy-β-methylglutaryl-CoA (HMG-CoA), (F) β-hydroxybutyrate, (G) succinyl-CoA, and (H) succinate, with and without delivery of 2.5 µM of the HMG-CoA synthase (HMGCS) inhibitor hymeglusin in the perfusion buffer (two groups, n = 6 hearts each). (I) Schematic depicting how the inhibition of HMGCS is associated with metabolite level changes. Bold text and upward pointing arrows indicate metabolites that accumulated to a greater level in the presence of hymeglusin, downward pointing arrows and smaller text indicate those that accumulated to a lesser extent. Bold arrows suggest pathways where flux may be increased in the presence of hymeglusin. Results are presented as mean ± SEM. *p<0.05, **p<0.01, relative to ischaemic control.
Figure 6.
Figure 6.. Inhibition of HMG-CoA synthase improves functional recovery.
(A) Rate pressure product (RPP), as a percentage of pre-ischaemic levels, following 32 min of 0.3 ml.min-1gww-1 low-flow ischaemia, with or without delivery of 2.5 µM of the β-hydroxy-β-methylglutaryl (HMG)-CoA synthase (HMGCS) inhibitor hymeglusin in the perfusion buffer (two groups, n = 5 hearts each). (B) Respiration rates corrected for wet mass. Malate and octanoyl carnitine were added initially to stimulate leak respiration, then, sequentially, adenosine diphosphate (ADP) to stimulate β-oxidation-supported OXPHOS, pyruvate, and glutamate to support electron flux through complex I, succinate to additionally support electron flux through complex II, and finally rotenone to inhibit complex I- and isolate complex II-supported respiration. The non-ischaemic control group consisted of n = 5 hearts perfused aerobically for 96 min. The I/R control and I/R hymeglusin groups consisted of n = 5 hearts per group subjected to 32 min of aerobic perfusion at 100 mmHg, 32 min of 0.3 ml.min-1gww-1 low-flow ischaemia, then 32 min of aerobic reperfusion at 100 mmHg, with either vehicle or 2.5 µM hymeglusin administered in the perfusion buffer. Results are presented as mean ± SEM. *p<0.05, **p<0.01, relative to ischaemic control. p<0.05, #p<0.01, and ‡‡‡p<0.001, relative to non-ischaemic control.
Figure 6—figure supplement 1.
Figure 6—figure supplement 1.. Coronary effluent β-OHB levels relative to control pre-ischaemic levels, with and without delivery of hymeglusin in the perfusion buffer (two groups of n = 5 hearts).
Results are presented as mean ± SEM. *p<0.05, **p<0.01, ***p<0.001, and ****p<0.0001, relative to control.
Figure 6—figure supplement 2.
Figure 6—figure supplement 2.. The ischaemic LV MDA concentration with and without treatment with 2.5 µM of the HMG-CoA synthase (HMGCS) inhibitor hymeglusin in the perfusion buffer, relative to ischaemic controls (two groups of n = 6 hearts each).
Results are presented as mean ± SEM. *p<0.05, relative to control.

References

    1. Arima Y, Izumiya Y, Ishida T, Takashio S, Ishii M, Sueta D, Fujisue K, Sakamoto K, Kaikita K, Tsujita K. Myocardial ischemia suppresses ketone body utilization. Journal of the American College of Cardiology. 2019;73:246–247. doi: 10.1016/j.jacc.2018.10.040. - DOI - PubMed
    1. Chen Q, Vazquez EJ, Moghaddas S, Hoppel CL, Lesnefsky EJ. Production of reactive oxygen species by mitochondria: central role of complex III. The Journal of Biological Chemistry. 2003;278:36027–36031. doi: 10.1074/jbc.M304854200. - DOI - PubMed
    1. Chouchani ET, Pell VR, Gaude E, Aksentijević D, Sundier SY, Robb EL, Logan A, Nadtochiy SM, Ord ENJ, Smith AC, Eyassu F, Shirley R, Hu CH, Dare AJ, James AM, Rogatti S, Hartley RC, Eaton S, Costa ASH, Brookes PS, Davidson SM, Duchen MR, Saeb-Parsy K, Shattock MJ, Robinson AJ, Work LM, Frezza C, Krieg T, Murphy MP. Ischaemic accumulation of succinate controls reperfusion injury through mitochondrial ROS. Nature. 2014;515:431–435. doi: 10.1038/nature13909. - DOI - PMC - PubMed
    1. Comte B, Vincent G, Bouchard B, Jetté M, Cordeau S, Rosiers CD. A 13C mass isotopomer study of anaplerotic pyruvate carboxylation in perfused rat hearts. Journal of Biological Chemistry. 1997;272:26125–26131. doi: 10.1074/jbc.272.42.26125. - DOI - PubMed
    1. Cook GA, Lavrentyev EN, Pham K, Park EA. Streptozotocin diabetes increases mRNA expression of ketogenic enzymes in the rat heart. Biochimica et Biophysica Acta (BBA) - General Subjects. 2017;1861:307–312. doi: 10.1016/j.bbagen.2016.11.012. - DOI - PMC - PubMed

Publication types

Substances