. 2021 Oct 4;218(10):e20210915.
doi: 10.1084/jem.20210915. Epub 2021 Sep 7.

Blood transcriptomics reveal the evolution and resolution of the immune response in tuberculosis

Affiliations

Blood transcriptomics reveal the evolution and resolution of the immune response in tuberculosis

Olivier Tabone et al. J Exp Med. .

Abstract

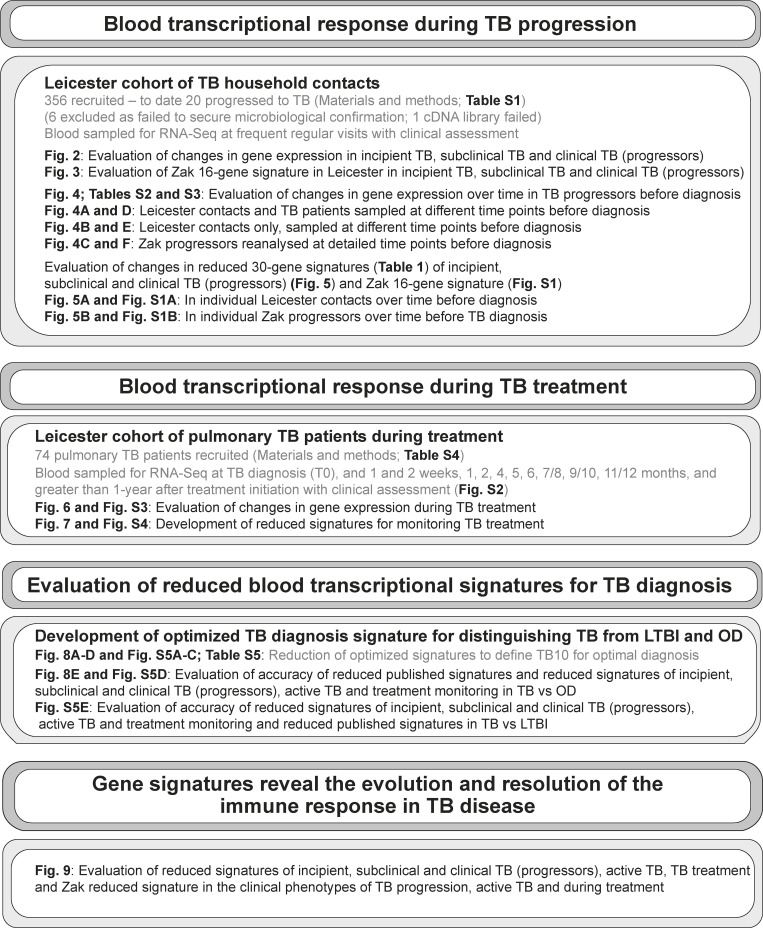
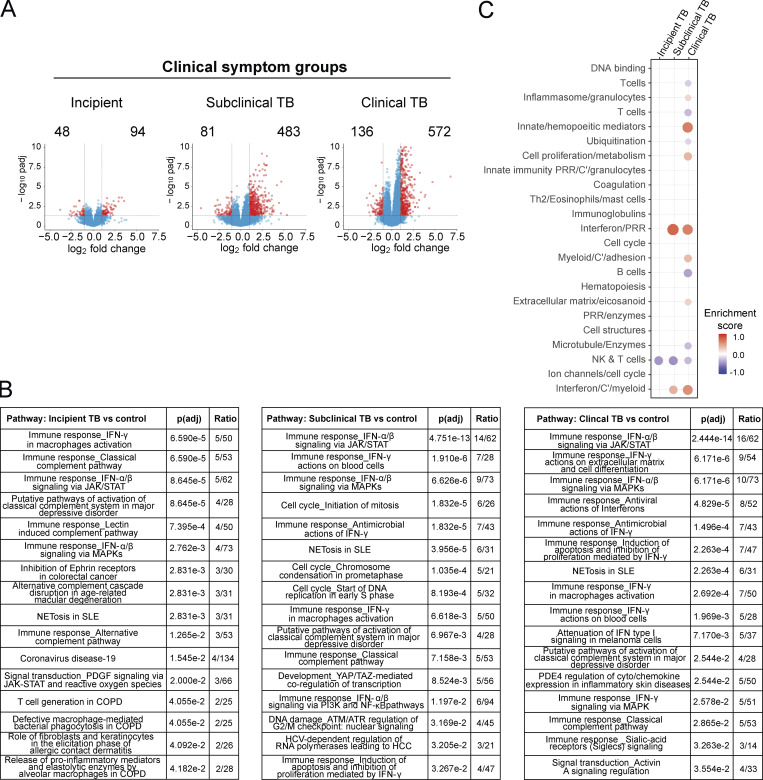
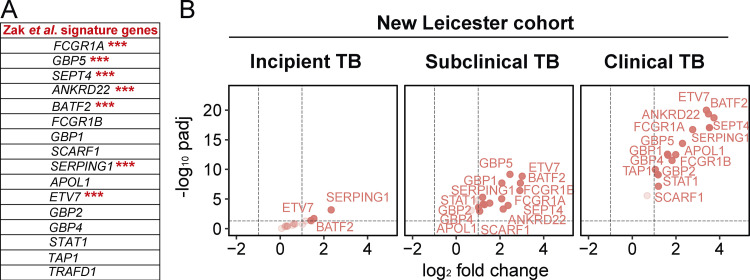
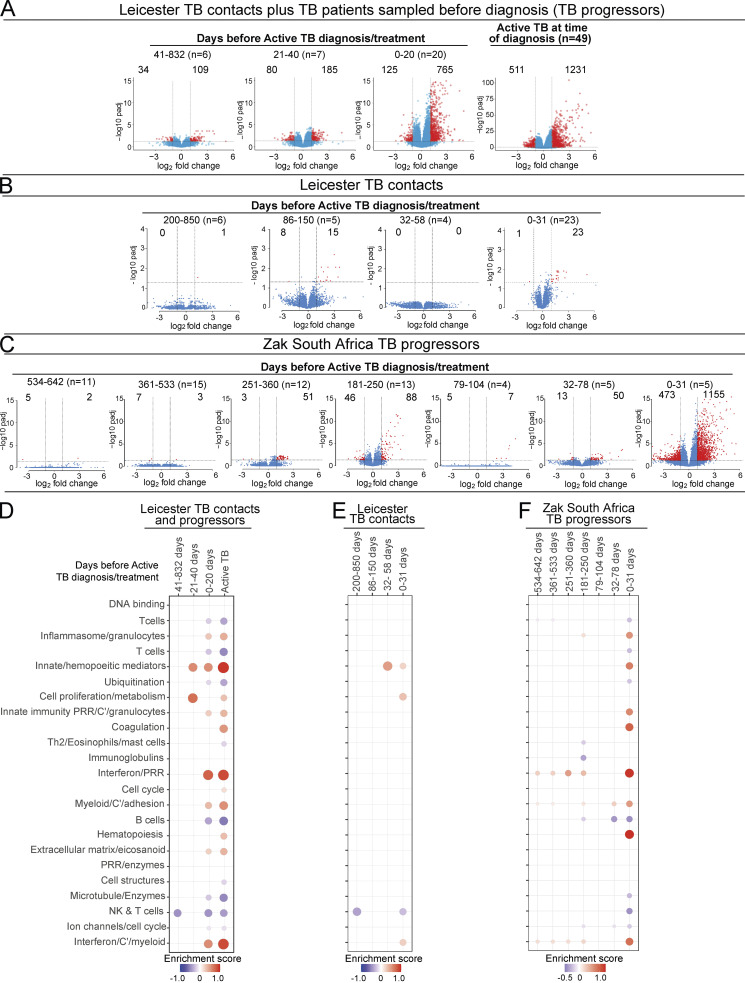
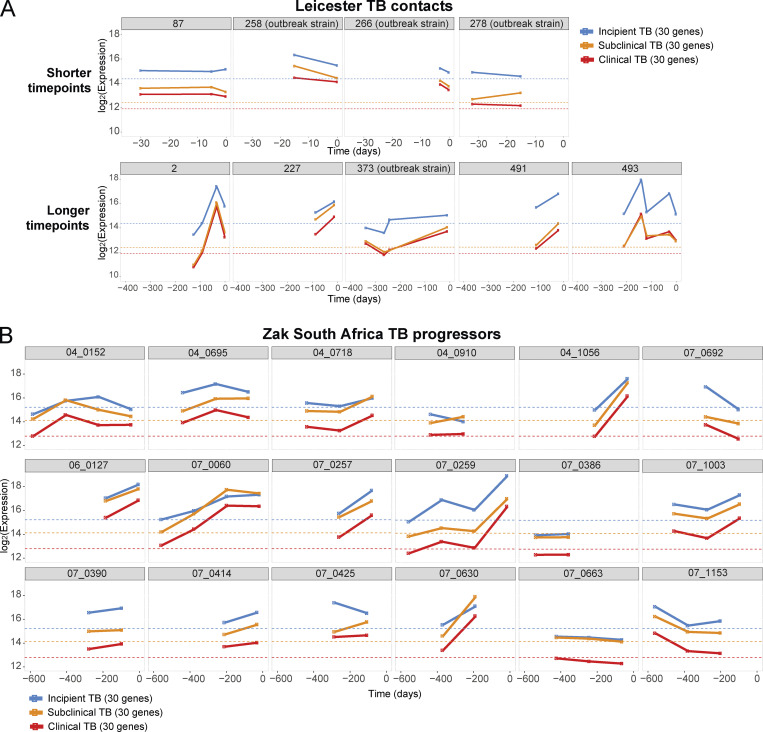
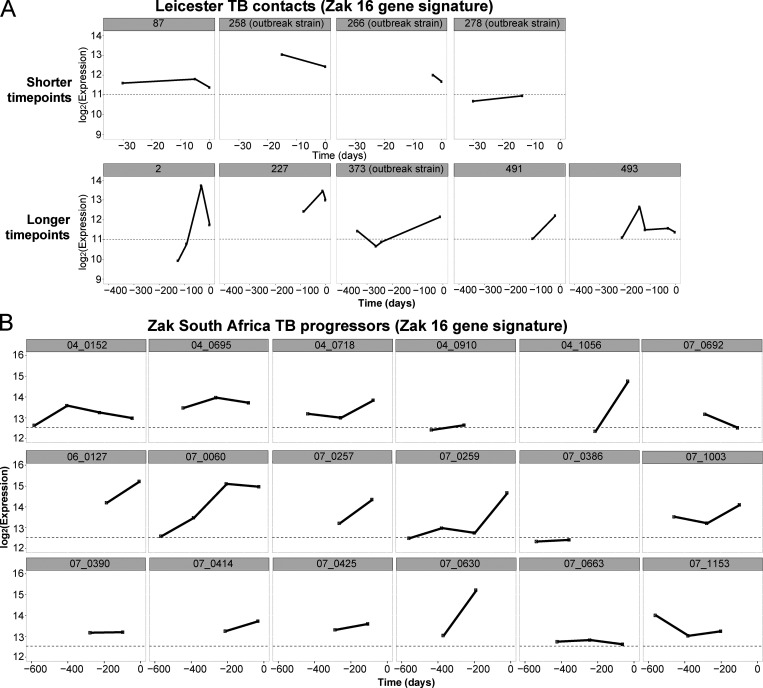
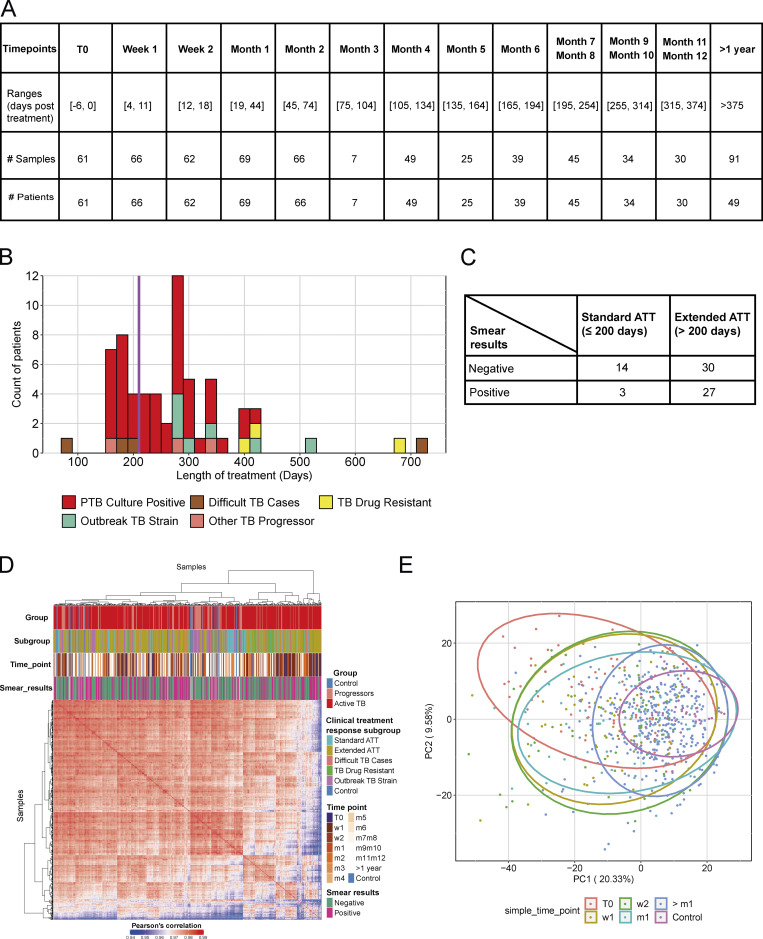
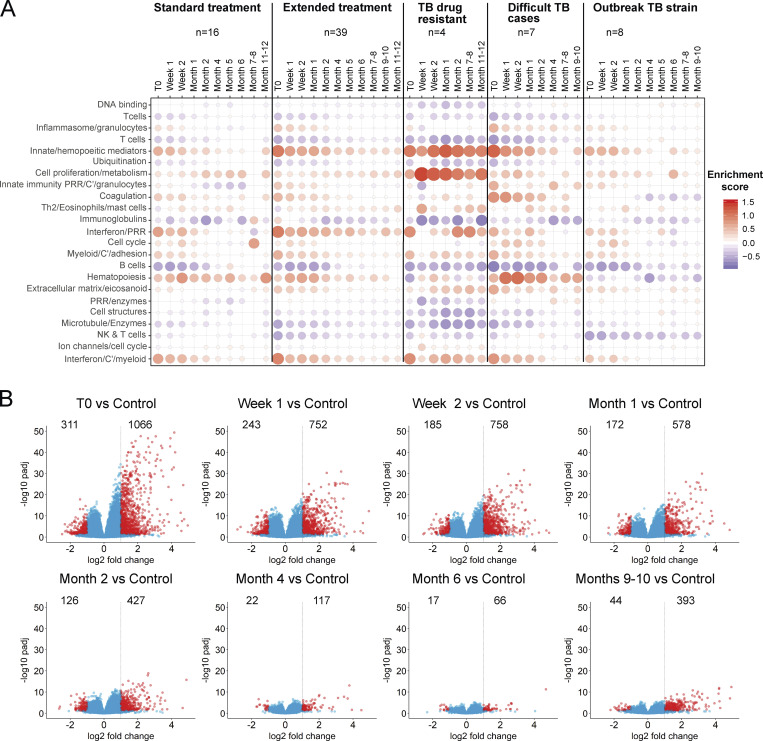
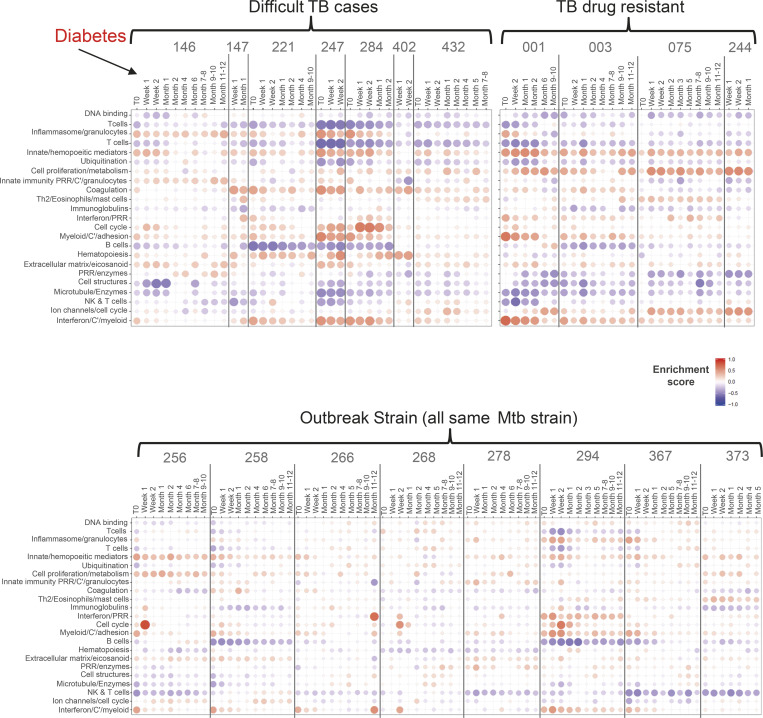
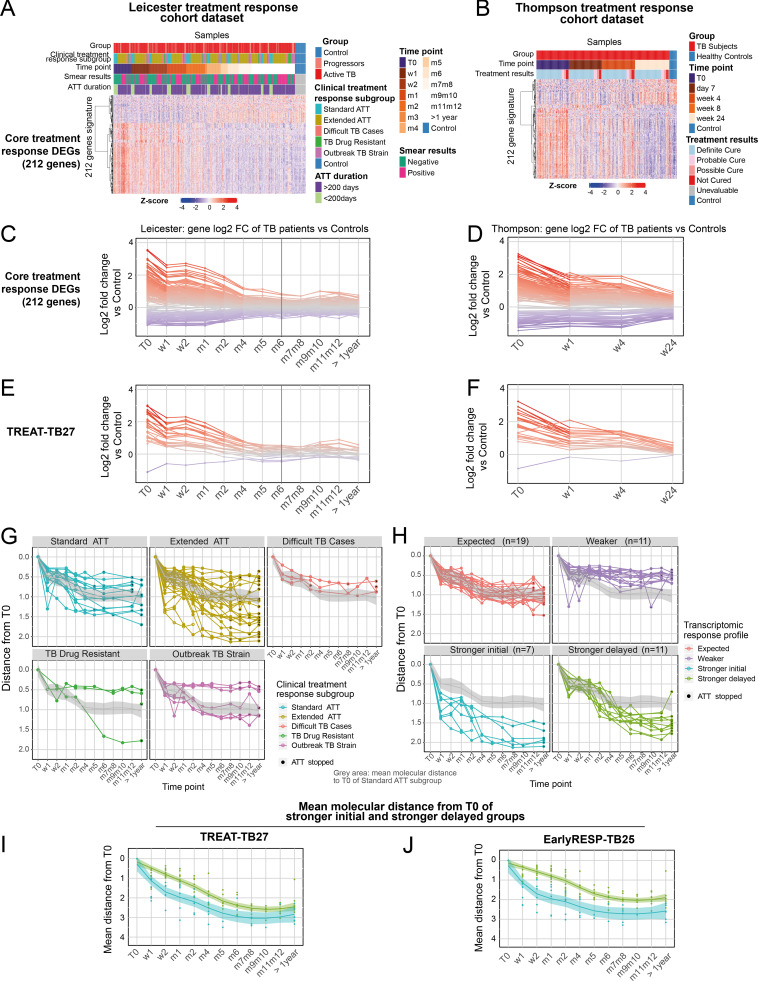
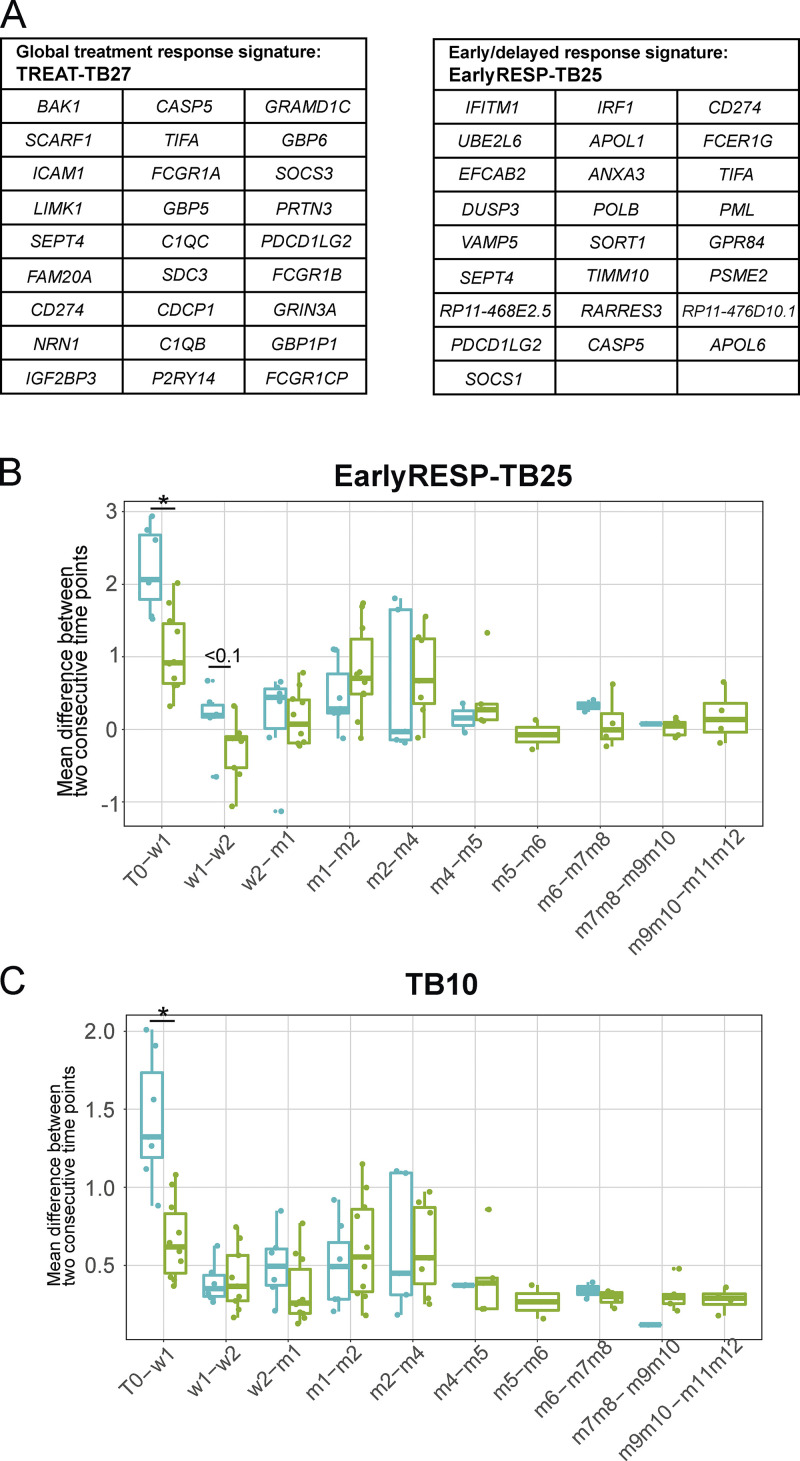
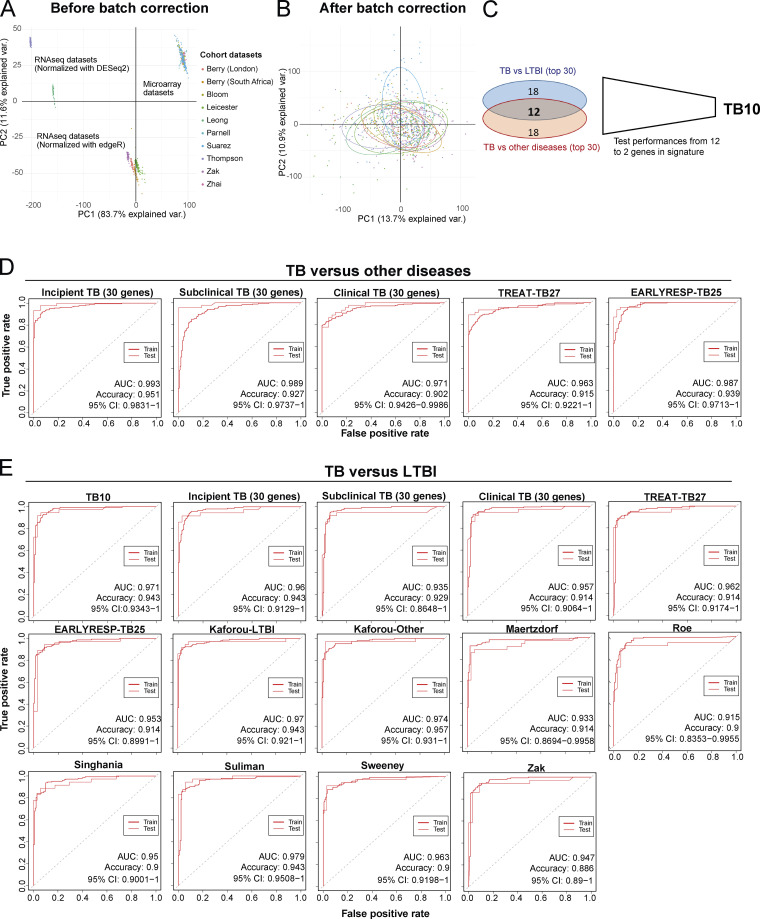
Blood transcriptomics have revealed major characteristics of the immune response in active TB, but the signature early after infection is unknown. In a unique clinically and temporally well-defined cohort of household contacts of active TB patients that progressed to TB, we define minimal changes in gene expression in incipient TB increasing in subclinical and clinical TB. While increasing with time, changes in gene expression were highest at 30 d before diagnosis, with heterogeneity in the response in household TB contacts and in a published cohort of TB progressors as they progressed to TB, at a bulk cohort level and in individual progressors. Blood signatures from patients before and during anti-TB treatment robustly monitored the treatment response distinguishing early and late responders. Blood transcriptomics thus reveal the evolution and resolution of the immune response in TB, which may help in clinical management of the disease.


Conflict of interest statement

Disclosures: W.J. Branchett reported their postdoctoral position is funded by a Wellcome Trust Investigator Award to Professor Anne O'Garra. M. Rodrigue reported they are a bioMérieux employee. No other disclosures were reported.

Figures

Figure 1.
Figure 1.
Study plan.
Figure 2.
Figure 2.
Blood signature of gene expression changes in incipient, subclinical, and clinical TB. Analysis of RNA-Seq in blood from Leicester contacts, incipient; subclinical TB; clinical TB. (A) Volcano plots of DEGs (number down-modulated, right, up-modulated, left; x axis, log2 fold change of patients compared with controls; y axis −log10 of adjusted P value [padj], Benjamini–Hochberg; genes with absolute (abs) [log2 fold change] >1 and adjusted P value <0.05 are considered statistically significantly differentially expressed, red dots). (B) Statistically significant top pathways derived from Metacore analysis (Data S1). (C) Modular transcriptional analysis (red and blue indicate modules over- or under-abundant compared with controls; color intensity and size of dots represent degree of perturbation; FDR P value <0.05 considered significant; name indicates biological processes associated with modular genes).
Figure 3.
Figure 3.
Genes from a reduced published signature of TB risk are increasingly differentially expressed in incipient, subclinical, and clinical TB patients. (A) List of published TB 16-gene risk signature from Zak et al. (2016) where *** indicates the presence of a 30-gene signature from Leicester incipient, subclinical TB, and clinical TB from Table 1. (B) Volcano plots showing differential expression of the Zak 16 gene signature in blood of Leicester clinical symptoms groups compared with healthy controls (left to right: incipient TB, subclinical TB, and clinical TB; x axis represents log2 fold change of patients as compared with healthy controls; y axis represents the −log10 of adjusted P value (padj), Benjamini–Hochberg; genes with abs(log2 fold change) >1 and adjusted P value <0.05 are considered statistically significantly differentially expressed and depicted on the colored plots.
Figure 4.
Figure 4.
Blood signature reveals differential gene expression changes over time in patients before TB diagnosis. Volcano plots of DEGs in blood at detailed time points for TB progressors compared with healthy controls. (A) Leicester cohorts including TB contacts who progressed to active TB (Table S1, top; n = 12 contacts; 21 samples) and individuals sampled before active TB diagnosis (Table S1, bottom; progressors, n = 11; 12 samples) at indicated time points before diagnosis; active TB patients at time of diagnosis (n = 49; healthy matched controls n = 38 samples). (B) Leicester TB household contacts only who progressed to active TB (Table S3; n = 14 contacts; 38 samples) at indicated time points before diagnosis. (C) Zak TB progressors (Zak et al., 2016) at indicated detailed time points before diagnosis (n = 65 samples) compared with matched LTBI controls. Numbers of DEGs (down-modulated, right; up-modulated, left; x axis log2 fold change of patients compared with controls; y axis −log10 of adjusted P value, Benjamini–Hochberg; abs(log2 fold change) >1 and adjusted P value (padj) <0.05 were considered statistically significantly differentially expressed genes, red dots. n= in parentheses in A–C represents number of samples per time point. (D–F) Modular transcriptional analysis of human blood TB modules in TB progressors at time points before diagnosis as in A–C, against controls. (D) Leicester contacts together with active TB patients before TB diagnosis, and active TB patients at time of diagnosis (far right; modules with fold enrichment scores FDR P value <0.05 are considered significant). (E) Leicester TB contacts only who progressed to active TB. (F) Zak TB progressors (red and blue indicate modules over- or under-abundant compared with the controls; color intensity and size of dots represent degree of perturbation; module name indicates biological processes associated with modular genes. (E and F) Modular analysis was performed similarly but using a nominal P value of 0.05. Th2, T helper cell.
Figure 5.
Figure 5.
Expression of the 30-gene signature of incipient, subclinical, and clinical TB over time before diagnosis in individual TB progressors from Leicester contacts and Zak TB progressors. (A) The average expression value against baseline controls (dotted line) for the Leicester 30-gene incipient, subclinical, and clinical TB signatures are shown per individual over time where samples were available for two or more time points per patient in Leicester TB contacts, time points 1–30 (named shorter time points, n = 4) or 1–350 (named longer time points, n = 5) d before diagnosis. (B) Zak et al. (2016) progressors, time points 4–600 (n = 18) d before diagnosis/treatment.
Figure S1.
Figure S1.
Expression of the 30-gene signature of incipient and subclinical TB at different time points before diagnosis in TB progressors from Leicester and Zak et al. (2016) cohorts. (A and B) The published Zak 16-gene TB signature is shown per individual (A) Leicester TB contacts at time points of 1–30 (designated as shorter time points; n = 4) or of 1–350 (designated as longer time points; n = 5) d before diagnosis as in Fig. 5; and (B) Zak et al., 2016 progressors at time points of 4–600 (n = 18) d before diagnosis/treatment where progressors were selected from GEO accession no. GSE79362 (Zak et al., 2016, in individuals where two or more sampling time points were evident; from Zak paper training set n = 18; SupTab1; SupTab6_RNASeqMetadata).
Figure S2.
Figure S2.
Description of the Leicester treatment response cohort dataset. (A) The table depicts all the time points when samples have been collected, from T0 (before ATT initiation) to weeks (w) 1 and 2, months (m) 1, 2, 3, 4, 5, 6, 7–8, 9–10, 11–12, or >1 yr after ATT initiation. Below are represented the exact range of days used for making time point categories, then the corresponding number of samples collected and distinct number of patients at each time points. (B) ATT duration and treatment response samples. The graphic shows the distribution of treatment duration of patients included in the study. x axis shows the treatment duration in range of 20 d; the y axis represents the number of patients with a treatment duration of corresponding treatment duration. Each bar is colored according to the clinical subgroup of each patient: pulmonary TB culture positive (red), difficult TB cases (brown), TB drug–resistant (yellow), outbreak TB strain (light green), or other TB progressor (salmon). Patients have then been classified in two groups based on treatment duration (purple vertical bar): ≤200 d of treatment, which corresponds to the standard treatment duration, >200 d of treatment, which corresponds to extended ATT group. (C) The table shows the crossed table of number of patients with either negative or positive smear results at time of diagnosis and either standard or extended ATT duration. (D) Sample-to-sample correlation after data processing with DESeq2 (normalization, log2 scaled) of the Leicester treatment response cohort dataset. Pearson’s correlation values are going from 0.94 (blue) to 1 (red). Samples are annotated, from top to bottom, according to the group, clinical subgroup, time points, and smear results. Clustering has been made with the Ward method and Euclidean distance. (E) PCA of the top 1,000 most variable genes. Each dot represents a sample and is colored according to its corresponding simplified time point, T0 before ATT starts (red), week 1 (gold), week 2 (green), month 1 (sky blue), >1 mo after ATT initiation (blue), or healthy controls (purple). PTB, pulmonary TB.
Figure 6.
Figure 6.
Transcriptional blood signature reveals differential responses after treatment in clinically defined TB subgroups. (A) Modular blood RNA-Seq analysis of the clinical subgroups: standard treatment, extended treatment, TB drug–resistant, difficult TB cases, and outbreak TB strain for all confirmed active TB patients compared with healthy controls, at different time points relative to the start of treatment (ATT). T0 = before ATT (from 6 to 0 d before treatment starts), week 1, 2; month 1, 2, 4, 6, 7–8, and month 9–10, 11–12 (in some groups) after ATT (red and blue indicate modules over- or under-abundant compared with controls; color intensity and size of dots represent degree of perturbation; FDR P value <0.05 considered significant; name indicates biological processes associated with modular genes). (B) Volcano plots showing the DEGs of all confirmed active TB patients compared with healthy controls, at different time points relative to ATT. T0 = ATT (from 6 to 0 d before treatment starts) as in A. Number of differentially expressed genes, down-modulated, right, up-modulated, left; x axis log2 fold change of patients as compared with controls; y axis −log10 of adjusted P value (padj), Benjamini–Hochberg; genes with abs(log2 fold change) >1 and adjusted P value <0.05 are considered statistically significantly differentially expressed, red dots.
Figure S3.
Figure S3.
Modular treatment response in individuals of the nonclassical clinical TB subgroups. Modular analysis of samples of all individuals included in nonclassical clinical TB subgroups (difficult TB cases, TB drug–resistant, or outbreak strain TB groups). Patient IDs are shown on the top of the plots, and columns represent samples ordered chronologically according to times of collection and analysis before or after treatment starts. Human blood TB modules are tested in those individuals compared with healthy controls. Red and blue indicate modules over- or under-abundant compared with the controls. Color intensity and size of the dots represent the degree of perturbation. Module name indicates biological processes associated with the genes within the module. Only modules with fold enrichment scores with FDR P value <0.05 are considered significant.
Figure 7.
Figure 7.
Development of improved treatment response signatures across TB patient cohorts. (A and B) Expression heatmaps of the full treatment response signature (TREAT-TB212) in (A) Leicester cohort and in (B) validation in published cohort (Thompson et al., 2017). Expression values are centered and scaled; rows (genes) clustered with Ward method and Euclidean distance; columns (samples) ordered according to time points, clinical subgroup, smear results for Leicester dataset, and according to time points and treatment results for Thompson’s dataset. (C and D) Full treatment response signature (TREAT-TB212; log2 fold change [FC]) of active TB patients (Leicester and Thompson cohorts) per treatment time point compared with controls. Each line represents a gene, colored according to log2 FC value; gene expression is shown as red, higher; gray, not differentially expressed; blue, lower in TB patients compared with controls. Vertical gray bar indicates 6 mo ATT. (E and F) Reduced global treatment response signature (TREAT-TB27). (G and H) Treatment response gene signature (TREAT-TB212) tested on individual responses compared with T0 of clinical subgroups. (G) Development of new transcriptomic definition shown in H. Treatment-course curves representing the mean molecular distance from T0 of individuals per time point in clinically defined subgroups: standard ATT patients (sky blue, fully sensitive TB, clinical cure <200 d); extended ATT patients (dark yellow, fully sensitive TB, requiring extended treatment >200 d due to clinical/radiological suspicion of TB); difficult TB cases (red, fully sensitive TB, requiring extended treatment due to treatment intolerance and/or adherence issues); TB drug resistance patients (green, active TB with genotypic and/or phenotypic evidence of resistance to one or more first-line drugs); outbreak TB strain (pink, active TB with genotypic evidence of infection with a fully sensitive M. tuberculosis strain responsible for a chronic local outbreak). y axis represents the mean molecular distance from T0 of TREAT-TB212 gene signature per individual, per time point; gray area = mean response profile of the standard ATT subgroup. Each line corresponds to an individual, with at least one sample collected before ATT, and three samples collected during treatment (n = 48). (H) Treatment-course curves representing the mean molecular distance from T0 of individuals per transcriptomic response group, per time point. Each line corresponds to an individual, with at least one sample collected before ATT and three samples collected during treatment at time points shown (n = 48). Each patient has been classified according to its transcriptional profile response, from TREAT-TB212 gene signature into expected (red, patients showing similar profiles to the mean standard ATT subgroup); weaker (purple, patients showing weaker responses than standard ATT subgroup); stronger initial (sky blue, patients showing a stronger response than standard ATT subgroup within the first 2 wk after ATT); stronger delayed (green, patients showing an initial similar response compared with standard ATT but a stronger response from 1 mo after ATT); gray area = mean response profile of the standard ATT subgroup. (I and J) Reduced early treatment response of signature TREAT-TB27 and a new EarlyRESP-TB25 signature from reduction of signature in H; curves represent the mean molecular distance from T0 at every time point for each of the reduced signatures. The curves represent the mean of stronger initial (blue); stronger delayed (green). In G–J, the y axis scale is reversed, with the highest point showing a minimal and lowest point showing a maximal molecular distance from T0. w, week; m, month.
Figure S4.
Figure S4.
Ultra-reduced EarlyRESP-TB25 signature and TB10 diagnosis signature for treatment monitoring response. (A) The tables show the list of genes from global treatment response reduced signature (TREAT-TB27, left) and early response reduced signature (EarlyRESP-TB25, right). (B and C) Box plots representing the mean difference of expression (log2 fold change; y axis) between two consecutive time points (x axis) of (B) the early response reduced signature EarlyRESP-TB25, or (C) the optimal TB diagnosis signature TB10. Each box is colored according to the initial or delayed strength of the transcriptional response group (stronger initial in sky blue and stronger delayed in green). Comparisons between the two groups have been made at each interval of time- point (Wilcoxon tests). w, week; m, month. * signifies significant difference.
Figure S5.
Figure S5.
Initial development of TB10 signature for diagnosis and testing against signatures from this study and published signatures. (A) PCA of the pooled 10 cohort datasets before batch correction. Each dot represents a sample and is colored according to its dataset of origin. Principal component 1 (PC1) and PC2 represent 83.7% and 11.6% of the total variance (var.), respectively. (B) PCA of the pooled 10 cohort datasets after batch correction with reference COMBAT algorithm. Each dot represents a sample and is colored according to its dataset of origin. PC1 and PC2 represent 13.7% and 10.9% of total variance, respectively. (C) Venn diagram that shows the number of genes that are shared between the two top 30 lists from random forest importance gene ranking for TB versus LTBI (blue) and TB versus ODs (red) and depicts the reduction of the optimal signature for diagnosis from 12 to 10 genes (TB10; Table S5). (D) Comparison of performances of our new TB10 signature against our 30-gene signatures of incipient, subclinical TB, and clinical TB, and our treatment response–reduced signatures TREAT-TB27 and EarlyRESP-TB25, for distinguishing TB versus ODs. (E) Comparison of performances of our new TB10 signature against our 30-gene signatures of incipient, subclinical TB, and clinical TB, and our treatment response–reduced signatures TREAT-TB27 and EarlyRESP-TB25, and published signatures for distinguishing TB versus LTBI. Receiver operating characteristic curves of training (dashed) and test (plain) sets of random forest models are shown, with AUC and accuracy and 95% CI depicted from the test set.
Figure 8.
Figure 8.
Development of TB10 signature to distinguish TB from ODs. (A and B) Top 50 ranking of the most important genes determined with random forest for distinction between (A) active TB and LTBI patients, and (B) active TB and ODs. x axis represents the mean decrease accuracy (importance) from random forest algorithm for each comparison. y axis depicts the gene names and the reduced signature it comes from. (C) TB10 gene names, signature(s) of origin, and rankings from random forest algorithm importance (mean decrease accuracy) for TB versus LTBI and TB versus OD comparisons. (D) TB10 signature expression profiles from pooled dataset. Box plots depicting the log2 normalized expression values of each gene from TB10 signature, of control, LTBI, active TB, and ODs, with active TB shown to be statistically significant from controls, LTBI, and ODs by ANOVA (Data S4). (E) Comparison of performances of our new TB10 signature against published signatures for TB versus ODs. Receiver operating characteristic curves of training (dashed) and test (plain) sets of random forest models are shown, with AUC and accuracy and 95% CI depicted from the test set. norm., normalized.
Figure 9.
Figure 9.
Immune signatures reveal the evolution and resolution of TB disease. Each row shows a different gene signature. Volcano plots depict the DEG in contacts of TB patients that subsequently progressed to TB, at different stages of the disease, incipient TB, subclinical TB, and clinical TB stages (left); active TB patients, from T0 before treatment starts (middle), to week 1, month 2, and month 6 after T0 (right); all were compared to their respective controls; time-course curves show the average expression value per signature versus controls in each of the previously mentioned stages of disease/time point of ATT (far right). padj, adjusted P value.

References

    1. Anders, S., Pyl P.T., and Huber W.. 2015. HTSeq--a Python framework to work with high-throughput sequencing data. Bioinformatics. 31:166–169. 10.1093/bioinformatics/btu638 - DOI - PMC - PubMed
    1. Barry, C.E. III, Boshoff H.I., Dartois V., Dick T., Ehrt S., Flynn J., Schnappinger D., Wilkinson R.J., and Young D.. 2009. The spectrum of latent tuberculosis: rethinking the biology and intervention strategies. Nat. Rev. Microbiol. 7:845–855. 10.1038/nrmicro2236 - DOI - PMC - PubMed
    1. Behr, M.A., Edelstein P.H., and Ramakrishnan L.. 2018. Revisiting the timetable of tuberculosis. BMJ. 362:k2738. 10.1136/bmj.k2738 - DOI - PMC - PubMed
    1. Behr, M.A., Edelstein P.H., and Ramakrishnan L.. 2019. Is Mycobacterium tuberculosis infection life long? BMJ. 367:l5770. 10.1136/bmj.l5770 - DOI - PMC - PubMed
    1. Behr, M.A., Kaufmann E., Duffin J., Edelstein P.H., and Ramakrishnan L.. 2021. Latent Tuberculosis: Two Centuries of Confusion. Am. J. Respir. Crit. Care Med. 204:142–148. - PMC - PubMed

Publication types

Substances