. 2021 Oct 22;6(20):e151911.
doi: 10.1172/jci.insight.151911.

Phospholipase A2 enzymes represent a shared pathogenic pathway in psoriasis and pityriasis rubra pilaris

Affiliations

Phospholipase A2 enzymes represent a shared pathogenic pathway in psoriasis and pityriasis rubra pilaris

Shuai Shao et al. JCI Insight. .

Abstract

Altered epidermal differentiation along with increased keratinocyte proliferation is a characteristic feature of psoriasis and pityriasis rubra pilaris (PRP). However, despite this large degree of overlapping clinical and histologic features, the molecular signatures these skin disorders share are unknown. Using global transcriptomic profiling, we demonstrate that plaque psoriasis and PRP skin lesions have high overlap, with all differentially expressed genes in PRP relative to normal skin having complete overlap with those in psoriasis. The major common pathway shared between psoriasis and PRP involves the phospholipases PLA2G2F, PLA2G4D, and PLA2G4E, which were found to be primarily expressed in the epidermis. Gene silencing each of the 3 PLA2s led to reduction in immune responses and epidermal thickness both in vitro and in vivo in a mouse model of psoriasis, establishing their proinflammatory roles. Lipidomic analyses demonstrated that PLA2s affect mobilization of a phospholipid-eicosanoid pool, which is altered in psoriatic lesions and functions to promote immune responses in keratinocytes. Taken together, our results highlight the important role of PLA2s as regulators of epidermal barrier homeostasis and inflammation, identify PLA2s as a shared pathogenic mechanism between PRP and psoriasis, and as potential therapeutic targets for both diseases.

Keywords: Autoimmune diseases; Dermatology; Immunology; Innate immunity; Skin.


Conflict of interest statement

Conflict of interest: The authors have declared that no conflict of interest exists.

Figures

Figure 1
Figure 1. DEGs are overlapped between PRP and psoriatic lesions.
(A) Number of genes significantly regulated in skin lesions of psoriasis (PP) and PRP patients demonstrating complete overlap of PRP genes with those of psoriasis. (B) Enriched Biologic Process GO terms for genes regulated consistently in psoriasis and PRP. (C) The metabonomics biomarker-enzyme network shared between PRP and psoriasis. DEGs, differentially expressed genes.
Figure 2
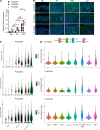
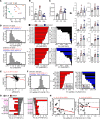
Figure 2. PLA2s are highly expressed in the epidermis of psoriatic lesions and TNF- and IL-17A–induced keratinocytes.
(A) Quantitative RT-PCR of PLA2G2F, PLA2G4D, and PLA2G4E expression in psoriasis (PP, n = 8), PRP (n = 16), and normal controls (n = 8) (shown with SD). Two-way ANOVA. *P < 0.05, **P < 0.01, ***P < 0.001. NS, not significant. (B) Representative immunofluorescence staining of PLA2G2F, PLA2G4D, and PLA2G4E in skin tissues from PRP, psoriasis (PP), atopic dermatitis (AD), and normal controls (n = 3). Scale bar: 100 μm. (C) scRNA-seq analysis of psoriasis skin lesions demonstrates expression of the 3 PLA2s primarily within the 3 epidermal keratinocytes compartments. (D) Violin plots show the expression levels of PLA2G2F, PLA2G4D, and PLA2G4E in cytokine-treated keratinocytes, which were detected by RNA-seq (n = 38).
Figure 3
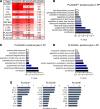
Figure 3. scRNA-seq analysis of PLA2G2F+, PLA2G4D+, and PLA2G4E+ keratinocytes in psoriatic lesions.
(A) Heatmap showing genes that are expressed in PLA2G2F+, PLA2G4D+, and PLA2G4E+ keratinocytes (compared with PLA2G2F, PLA2G4D, and PLA2G4E keratinocytes, respectively) in psoriatic lesions, analyzed by scRNA-seq (n = 14). Changes are shown as log2(fold change). (BD) GO analysis of biological process of the genes that are overexpressed in PLA2G2F+, PLA2G4D+, and PLA2G4E+ keratinocytes in psoriatic lesions. (E) The predicted upstream regulators for each the PLA2-positive populations. ND, not detected.
Figure 4
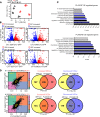
Figure 4. PLA2 overexpression promotes altered immune responses and keratinocyte differentiation.
(A) Hierarchical cluster analysis of samples (CTL, control; CYT, TNF + IL-17A stimulation; G2F, PLA2G2F overexpression; G4D, PLA2G4D overexpression). (B) Volcano plots. The number of DEGs identified is indicated in the upper margin (red: increased DEGs; blue: decreased DEGs; FDR < 0.10; FC > 2.00 or FC < 0.50). (C) GO analysis of biological process of PLA2G2F- and PLA2G4D-overexpressing keratinocytes compared with controls. (D) Comparison of expression of genes in response to IL-17A plus TNF stimulation in WT KCs and KCs overexpressing PLA2G2F (upper) or PLA2G4D (lower). OE, overexpression; DEGs, differentially expressed genes.
Figure 5
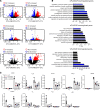
Figure 5. Silencing PLA2 dampens inflammatory responses and normalizes differentiation responses.
(A) Volcano plots for each differential expression analysis in the indicated groups (CTL-G2F, PLA2G2F-silenced keratinocytes without any stimulus; CTL-CTL, control siRNA–transfected keratinocytes without any stimulus; CYT-CTL, control siRNA–transfected keratinocytes with TNF + IL-17A stimulation; CYT-G2F, PLA2G2F-silenced keratinocytes with TNF + IL-17A stimulation). (B) GO term analysis of biological process of the PLA2G2F-, PLA2G4D-, or PLA2G4E-silenced keratinocytes compared with controls. (C) qRT-PCR of select inflammatory genes and differentiation markers in PLA2-silenced keratinocytes with/without TNF plus IL-17A stimulation. Two-way ANOVA. Data are presented as mean ± SEM (n = 3). #P < 0.05, ##P < 0.01, ##P < 0.001, ####P < 0.0001 for comparisons between control groups; *P < 0.05, **P < 0.01, ****P < 0.0001 for TNF + IL-17A groups compared with si-NC.
Figure 6
Figure 6. PLA2s modulate phospholipid/eicosanoid profiles in keratinocytes.
(A) Principal component analysis performed based on the abundance of 266 phospholipid and eicosanoids in PLA2G2F- or PLA2G4D-overexpressing keratinocytes. (B) The average total eicosanoid abundance (± 1 SEM) in each group (n = 6/group). Data are expressed as pmol/mL supernatant. Groups without the same letter differ significantly from one another (P < 0.05; Fisher’s least significant difference). (C) The average total phospholipid abundance (± 1 SEM) in each group averaging across all phospholipid categories (LPC + PC + LPE + PE + LPI + PI + LPG + PG + LPS + PS + LPS + PA) (n = 6/group). LPC, lyso-phosphatidylcholine; PC, phosphatidylcholine; LPE, lyso-phosphatidylethanolamine; PE, phosphatidylethanolamine; PI, phosphatidylinositol; PG, phosphatidylglycerol; PS, phosphatidylserine; PA, phosphatidic acid. Data are expressed as normalized intensities and constitute relative abundances per 1 × 10⁶ cells (relative to internal standards). (D) Phospholipids most strongly altered by PLA2G2F and PLA2G4D overexpression. (E) Changes in eicosanoid abundance following PLA2G2F siRNA knockdown and correlation with changes observed in PLA2G2F-overexpressing keratinocytes. (F) Lipids with most strongly altered abundance following PLA2G2F siRNA knockdown in keratinocytes. (G) Lipids with the most siRNA-dependent IL-17A and TNF responses. (H) Changes in eicosanoid abundance following PLA2G2F siRNA knockdown and correlation with changes observed in lesional (psoriasis, PP), uninvolved (PN), and normal (NN) skin biopsies. *P < 0.05, **P < 0.01, ***P < 0.001, ****P < 0.0001 by 1-way ANOVA (B and C) or Pearson’s correlation coefficient (H).
Figure 7
Figure 7. PLA2 inhibition alleviates psoriasis-like inflammation in vivo.
Chemical inhibitors targeting sPLA2 and cPLA2 were topically applied to IMQ-induced psoriasis-like mice (n = 5) to block PLA2 function. (A) H&E staining of ear sections from IMQ-induced mice with sPLA2 inhibitor treatment on day 6. Scale bar: 50 μm. (B) Dynamic changes in ear thickness at the indicated time points. (C) Epidermal thickness was evaluated based on the data in A. (D) qRT-PCR results showing mRNA expression of various cytokines and differentiation-related genes in the ears of IMQ mice on day 6. (E) H&E staining of ear sections from IMQ-induced mice with sPLA2 inhibitor treatment on day 6. Scale bar: 50 μm. (F) Dynamic changes in ear thickness at the indicated time points. (G) Epidermal thickness was evaluated based on the data in E. (H) qRT-PCR results showing mRNA expression of Defb4 and differentiation-related genes in the ears of each indicated group on day 6. Two-way ANOVA. Data are presented as mean ± SEM. *P < 0.05, **P < 0.01, ***P < 0.001, ****P < 0.0001.

References

    1. Dainichi T, et al. The epithelial immune microenvironment (EIME) in atopic dermatitis and psoriasis. Nat Immunol. 2018;19(12):1286–1298. doi: 10.1038/s41590-018-0256-2. - DOI - PubMed
    1. Gudjonsson JE, et al. Mechanisms of skin autoimmunity: cellular and soluble immune components of the skin. J Allergy Clin Immunol. 2020;146(1):8–16. doi: 10.1016/j.jaci.2020.05.009. - DOI - PubMed
    1. Wang D, et al. A review on pityriasis rubra pilaris. Am J Clin Dermatol. 2018;19(3):377–390. doi: 10.1007/s40257-017-0338-1. - DOI - PubMed
    1. Craiglow BG, et al. CARD14-associated papulosquamous eruption: a spectrum including features of psoriasis and pityriasis rubra pilaris. J Am Acad Dermatol. 2018;79(3):487–494. doi: 10.1016/j.jaad.2018.02.034. - DOI - PMC - PubMed
    1. Israel L, Mellett M. Clinical and genetic heterogeneity of CARD14 mutations in psoriatic skin disease. Front Immunol. 2018;9:2239. doi: 10.3389/fimmu.2018.02239. - DOI - PMC - PubMed

Publication types

Substances