
Cell-targeted PD-1 agonists that mimic PD-L1 are potent T cell inhibitors

Adam P Curnock et al. JCI Insight. .

Abstract

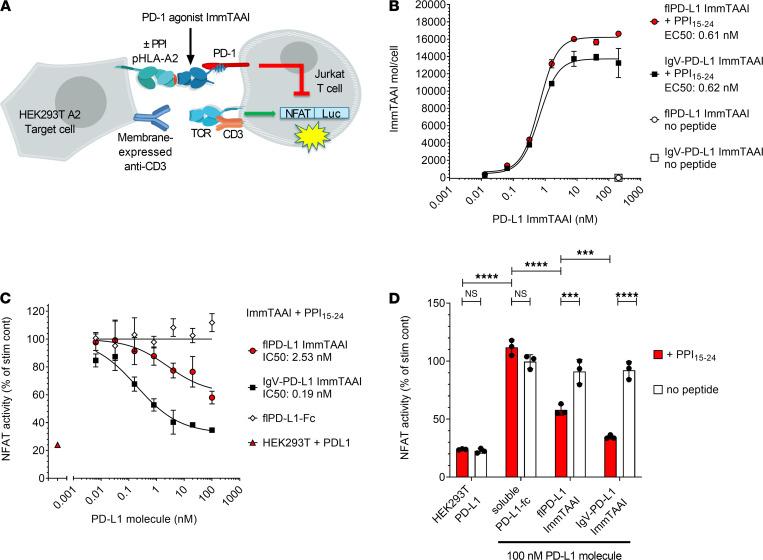
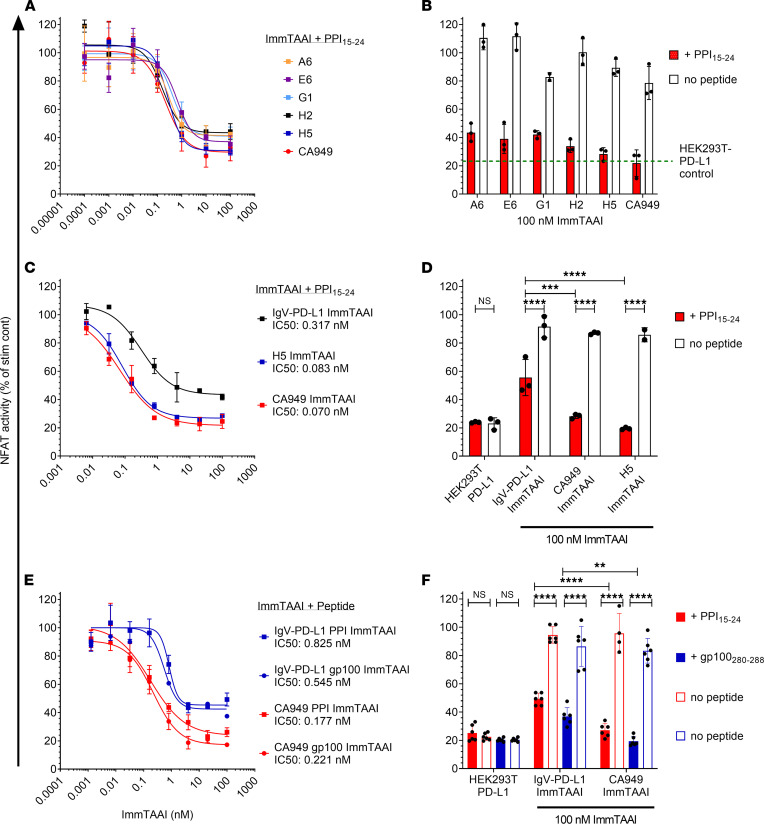
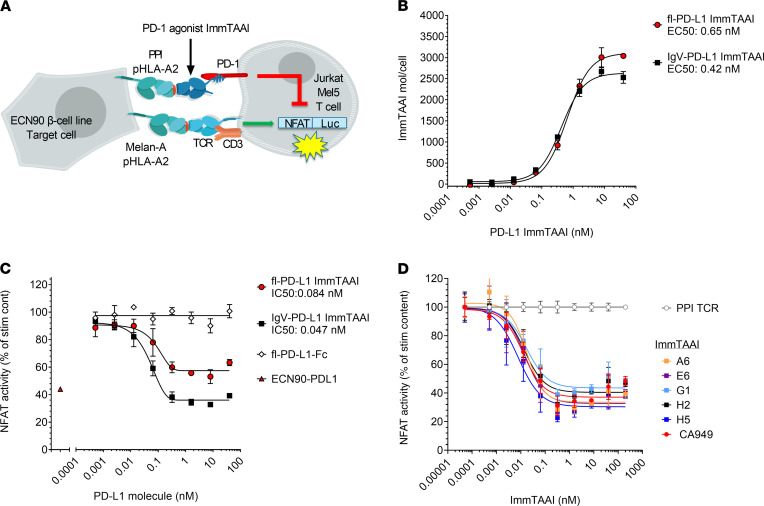
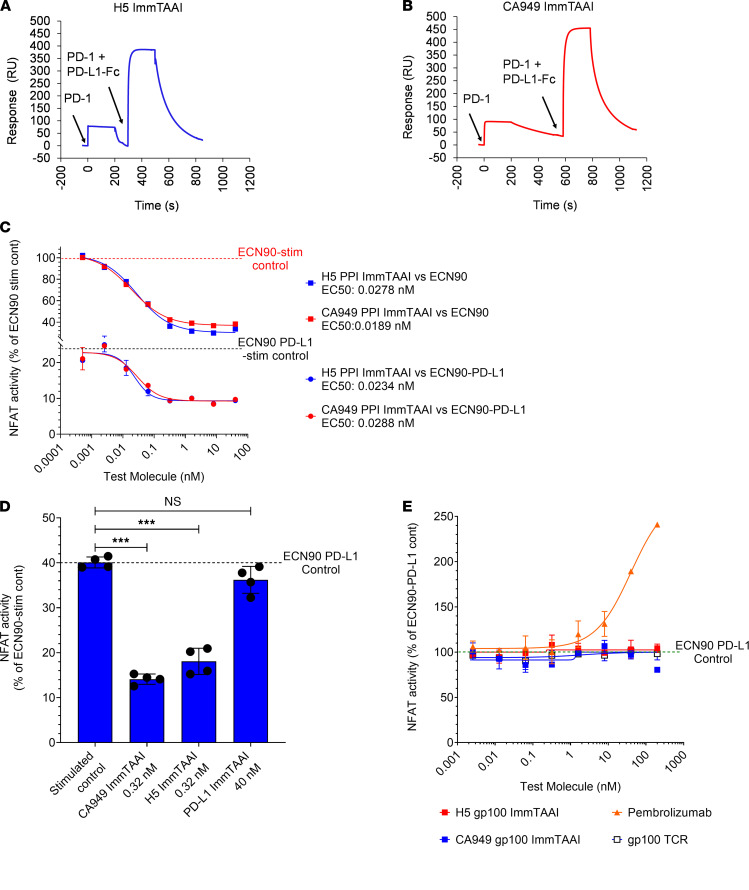
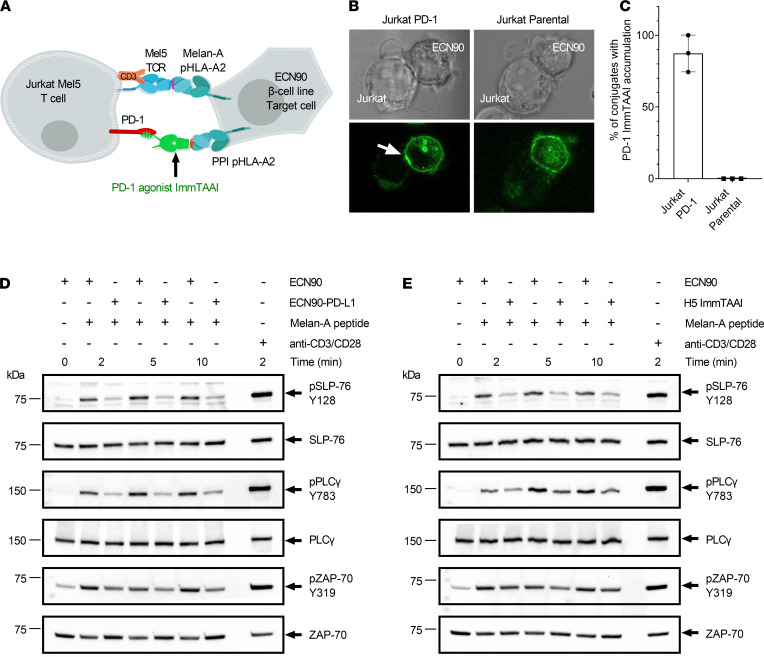
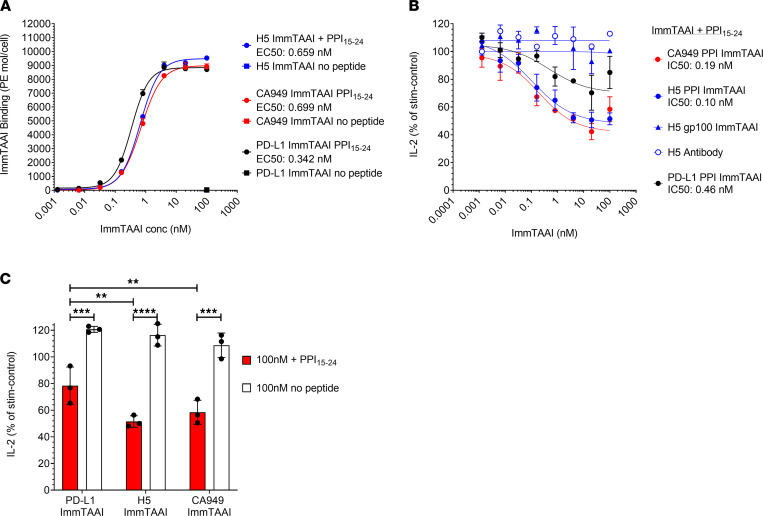
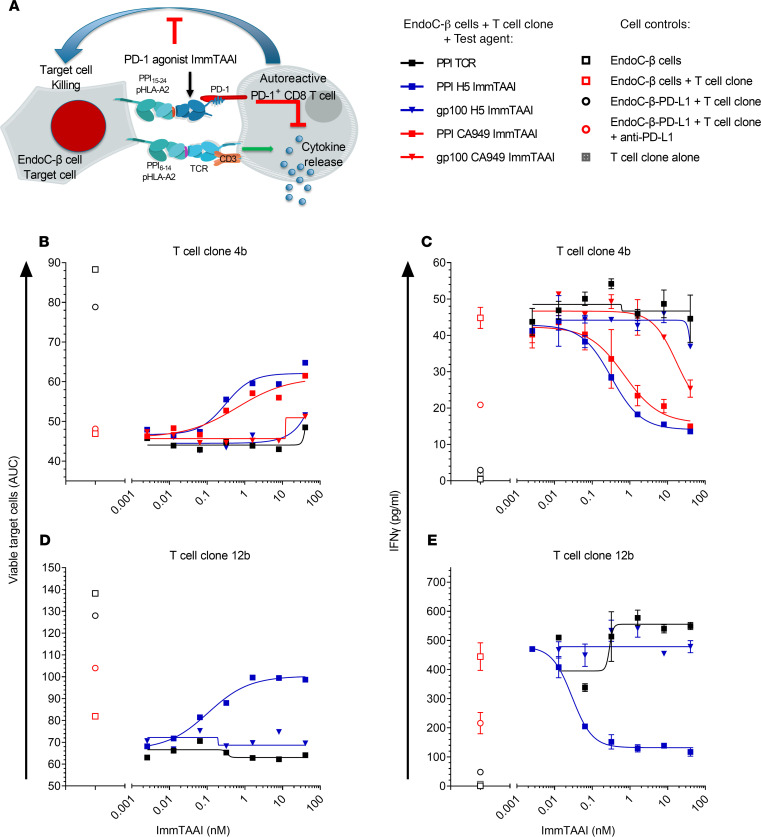
The PD-1/PD-L1 pathway is a key immune checkpoint that regulates T cell activation. There is strong rationale to develop PD-1 agonists as therapeutics against autoimmunity, but progress in this area has been limited. Here, we generated T cell receptor (TCR) targeting, PD-1 agonist bispecifics called ImmTAAI molecules that mimic the ability of PD-L1 to facilitate the colocalization of PD-1 with the TCR complex at the target cell-T cell interface. PD-1 agonist ImmTAAI molecules specifically bound to target cells and were highly effective in activating the PD-1 receptor on interacting T cells to achieve immune suppression. Potent PD-1 antibody ImmTAAI molecules closely mimicked the mechanism of action of endogenously expressed PD-L1 in their localization to the target cell-T cell interface, inhibition of proximal TCR signaling events, and suppression of T cell function. At picomolar concentrations, these bispecifics suppressed cytokine production and inhibited CD8+ T cell-mediated cytotoxicity in vitro. Crucially, in soluble form, the PD-1 ImmTAAI molecules were inactive and, hence, could avoid systemic immunosuppression. This study outlines a promising new route to generate more effective, potent, tissue-targeted PD-1 agonists that can inhibit T cell function locally with the potential to treat autoimmune and chronic inflammatory diseases of high unmet need.

Keywords: Adaptive immunity; Autoimmune diseases; Autoimmunity; Drug therapy; Immunology.


Conflict of interest statement

Conflict of interest: The authors have declared that no conflict of interest exists.

Figures

Figure 1
Figure 1. Target cell–bound PD-L1 ImmTAAI molecules inhibit TCR complex signaling.
(A) Schematic of the HEK293T-A2–Jurkat NFL PD-1 reporter assay. (B) PD-L1 ImmTAAI titrations were incubated with PPI15–24 peptide–pulsed or nonpulsed HEK293T-A2 target cells. ImmTAAI binding was quantified by flow cytometry, and dose-response curves were plotted (n = 3 and representative of 3 independent experiments). (C) Dose responses of the PD-L1 ImmTAAIs and PD-L1 Fc were tested in the HEK293T-A2–Jurkat NFL PD-1 reporter assay. Normalized NFAT activity was plotted against ImmTAAI concentration to calculate IC50 values (n = 3 and representative of 3 independent experiments). (D) Relative NFAT activity at 100 nM ImmTAAI was plotted for pulsed (+ PPI15–24) versus nonpulsed (no peptide) target cells (n = 3 and representative of 3 independent experiments). All data are plotted as mean ± SD and were compared by 2-way ANOVA with repeated measures and Tukey’s or Sidak’s multiple-comparison test. ***P ≤ 0.001, ****P ≤ 0.0001. IgV, immunoglobulin-like variable domain; fl, full-length.
Figure 2
Figure 2. Target cell–bound PD-1 antibody ImmTAAI molecules exhibit superior inhibition of TCR complex signaling over PD-L1 ImmTAAI molecules.
(A and B) PD-1 antibody ImmTAAI molecules constructed using a panel of VHH PD-1 antibodies and an scFv PD-1 antibody (CA949) were tested in the HEK293T-A2/anti-CD3: Jurkat NFL PD-1 reporter assay as described in Figure 1 (n = 3 and representative of 3 independent experiments). (C and D) Representative VHH-based (H5) and scFv-based (CA949) ImmTAAI molecules were tested alongside the IgV–PD-L1 ImmTAAI in the HEK293T-A2/anti-CD3: Jurkat NFL PD-1 reporter assay, and data are plotted as described above (n = 3 and representative of 3 independent experiments). (E and F) PD-1 agonist ImmTAAI molecules were generated by fusing CA949 scFV antibody and IgV–PD-L1 to different TCRs against either gp100280–288 pHLA-A2 or PPI15–24 pHLA-A2. The ImmTAAI molecules were tested in the HEK293T-A2/anti-CD3: Jurkat NFL PD-1 reporter assay, using HEK293T-A2 target cells pulsed with the appropriate targeting peptide (n = 6 and representative of 2 independent experiments). All data are plotted as mean ± SD and were compared by 2-way ANOVA with repeated measures and Tukey’s or Sidak’s multiple-comparison test. **P ≤ 0.01, ***P ≤ 0.001, ****P ≤ 0.0001.
Figure 3
Figure 3. β Cell–targeted PD-1 agonist ImmTAAI molecules inhibit TCR complex signaling.
(A) Schematic of the ECN90 β cell line: Jurkat NFL Mel5 PD-1 reporter assay. ECN90 cells were pulsed with Melan-A activating peptide, and titrations of PD-L1 or PD-1 Ab ImmTAAI molecules, PD-L1 Fc, or PPI TCR alone added. (BD) Either ECN90 cells were incubated for 3 hours and analyzed for PD-L1 ImmTAAI binding (n = 3 and representative of 3 independent experiments) (B), or Jurkat NFL Mel5 PD-1 cells were immediately added to test activity in the PD-1 reporter assay (n = 3 and representative of 3 independent experiments) (C and D). All data are plotted as mean ± SD. Abbreviations: IgV, Immunoglobulin-like variable domain; fl, full length
Figure 4
Figure 4. PD-1 antibody ImmTAAI molecules are noncompetitive with PD-L1 for PD-1 binding and are additive with PD-L1 in inhibiting TCR complex signaling.
(A and B) SPR competition binding studies were conducted as described in Methods and Supplemental Figure 3. Response units (RU) were plotted over time to characterize the binding of H5- and CA949-ImmTAAI molecules to PD-1 in the presence of PD-L1–Fc (representative sensorgrams from 3 independent experiments). (C) Parental ECN90 (upper curves) or PD-L1 transduced ECN90 cells (lower curves) were pulsed with Melan-A activating peptide and titrations of PD-1 antibody ImmTAAI molecules added. Jurkat NFL Mel5 PD-1 cells were immediately added to run the PD-1 reporter assay (n = 2 and representative of 4 independent experiments). (D) Cell assay using PD-L1 transduced ECN90 cells was done as described above using titrations of PD-1 antibody ImmTAAI or PD-L1 ImmTAAI molecules. Relative NFAT activity is plotted against the concentrations where maximal inhibition was observed (n = 4 and representative of 4 independent experiments). (E) Titrations of soluble PD-1 antibody ImmTAAI molecules (with an irrelevant TCR) and a PD-1 blocking antibody (pembrolizumab) were tested in the ECN90–PD-L1: Jurkat NFL Mel5 PD-1 reporter assay (n = 2 and representative of 2 independent experiments). Data are plotted as mean ± SD and were compared by 1-way ANOVA and Dunnett’s multiple-comparison test. ***P ≤ 0.001.
Figure 5
Figure 5. H5 ImmTAAI localizes at the target cell–T cell interface and inhibits proximal TCR signaling.
(A) Schematic of the cell assay used to visualize H5 ImmTAAI localization. (B) Phase contrast and confocal fluorescence images of H5 ImmTAAI localization on ECN90 β cell target cells cocultured with either PD-1+ or PD-1 Jurkat cells. Upper panel: phase contrast. Lower panel: fluorescence images, a white arrow indicates ImmTAAI accumulation (representative images from 3 independent studies). Total original magnification, ×100. (C) The numbers of ECN90 β cell: Jurkat conjugates with ImmTAAI accumulation (white arrow) were counted and plotted as a percentage of the total number of cell conjugates (n = 100 conjugates for conditions using Jurkat Mel5 PD-1 cells and n = 96 for Jurkat Mel5 cells, plotted as mean data from 3 independent studies). (D) Jurkat Mel5 PD-1 cells were stimulated with Melan-A–pulsed ECN90 or ECN90 PD-L1 cells for the indicated times. Whole cell lysates for each condition and time point were resolved by SDS-PAGE, transferred to PVDF membranes, and probed by Western blotting for phospho–SLP-76 (pSLP-76), total SLP-76 (SLP-76), phospho-PLCγ (pPLCγ), total PLCγ (PLCγ), phospho–ZAP-70 (pZAP-70), and total ZAP-70 (representative blots from 3 independent experiments). (E) Jurkat Mel5 PD-1 cells were stimulated with Melan-A–pulsed ECN90 cells, in the presence or absence of H5 ImmTAAI, and Western blots were performed as above (representative blots from 3 independent experiments).
Figure 6
Figure 6. PD-1 antibody ImmTAAI molecules bound to antigen-presenting cells inhibit primary human CD4+ T cells.
(A) PD-1 agonist ImmTAAI binding to Raji-A2 target cells was analyzed by flow cytometry (n = 2 and representative of 3 independent experiments). (B and C) PD-1 agonist ImmTAAI titrations were preincubated for 1 hour with PPI15–24 peptide–pulsed or nonpulsed SEB-loaded Raji-A2 cells. Preactivated T cells were added to the Raji-A2 cells and incubated for 48 hours. Supernatants were collected and IL-2 levels measured by ELISA. Dose response curves plotted to obtain IC50 values and relative inhibition of IL-2 release at 100 nM ImmTAAI was plotted for pulsed (+ PPI15–24) versus nonpulsed target cells (n = 3 and representative of 3 independent experiments). Data are plotted as mean ± SD and were compared by 2-way ANOVA with repeated measures and Tukey’s or Sidak’s multiple-comparison test. **P ≤ 0.01, ***P ≤ 0.001, ****P ≤ 0.0001.
Figure 7
Figure 7. PD-1 antibody ImmTAAI molecules inhibit autoreactive human CD8+ T cells and protect target cells from T cell killing.
(A) Schematic of the EndoC-β Red cell–CD8+ T cell clone killing assay. (B and D) PPI6–14-HLA-A2-specific autoreactive T cell clones 4b (B) or 12b (D) were added to EndoC-β Red cells in the presence of PPI antibody or gp100 PD-1 antibody ImmTAAI titrations or TCR only controls. PD-L1–transduced EndoC-β Red target cells with or without anti–PD-L1 blocking antibody were used as additional controls. For each sample EndoC-β Red target cell number, relative to cells at (t = 0) was measured over time by imaging and growth curves generated. AUC was calculated for each curve and EC50 data generated by plotting AUC over ImmTAAI concentration (representative data from 3 independent experiments). (C and E) Supernatants were collected from the killing assays at 24 hours. IFN-γ levels were measured by MSD ELISA, and dose-response curves were plotted to generate EC50 values. Nonstimulated T cells alone were assessed as additional controls (n = 2, data are plotted as mean ± SD and representative of 3 independent experiments).

References

    1. Okazaki T, et al. A rheostat for immune responses: the unique properties of PD-1 and their advantages for clinical application. Nat Immunol. 2013;14(12):1212–1218. doi: 10.1038/ni.2762. - DOI - PubMed
    1. Sharpe AH, Pauken KE. The diverse functions of the PD1 inhibitory pathway. Nat Rev Immunol. 2018;18(3):153–167. doi: 10.1038/nri.2017.108. - DOI - PubMed
    1. Patsoukis N, et al. Revisiting the PD-1 pathway. Sci Adv. 2020;6(38):eabd2712. doi: 10.1126/sciadv.abd2712. - DOI - PMC - PubMed
    1. Freeman GJ, et al. Engagement of the PD-1 immunoinhibitory receptor by a novel B7 family member leads to negative regulation of lymphocyte activation. J Exp Med. 2000;192(7):1027–1034. doi: 10.1084/jem.192.7.1027. - DOI - PMC - PubMed
    1. Latchman Y, et al. PD-L2 is a second ligand for PD-1 and inhibits T cell activation. Nat Immunol. 2001;2(3):261–268. doi: 10.1038/85330. - DOI - PubMed

MeSH terms

Substances