. 2021 Nov 1;131(21):e141964.
doi: 10.1172/JCI141964.

Macrophage monocarboxylate transporter 1 promotes peripheral nerve regeneration after injury in mice

Affiliations

Macrophage monocarboxylate transporter 1 promotes peripheral nerve regeneration after injury in mice

Mithilesh Kumar Jha et al. J Clin Invest. .

Abstract

Peripheral nerves have the capacity for regeneration, but the rate of regeneration is so slow that many nerve injuries lead to incomplete recovery and permanent disability for patients. Macrophages play a critical role in the peripheral nerve response to injury, contributing to both Wallerian degeneration and nerve regeneration, and their function has recently been shown to be dependent on intracellular metabolism. To date, the impact of their intracellular metabolism on peripheral nerve regeneration has not been studied. We examined conditional transgenic mice with selective ablation in macrophages of solute carrier family 16, member 1 (Slc16a1), which encodes monocarboxylate transporter 1 (MCT1), and found that MCT1 contributed to macrophage metabolism, phenotype, and function, specifically in regard to phagocytosis and peripheral nerve regeneration. Adoptive cell transfer of wild-type macrophages ameliorated the impaired nerve regeneration in macrophage-selective MCT1-null mice. We also developed a mouse model that overexpressed MCT1 in macrophages and found that peripheral nerves in these mice regenerated more rapidly than in control mice. Our study provides further evidence that MCT1 has an important biological role in macrophages and that manipulations of macrophage metabolism can enhance recovery from peripheral nerve injuries, for which there are currently no approved medical therapies.

Keywords: Cytokines; Innervation; Macrophages; Metabolism; Neuroscience.


Conflict of interest statement

Conflict of interest: The authors have declared that no conflict of interest exists.

Figures

Figure 1
Figure 1. Selective ablation of MCT1 in macrophages impairs axon regeneration.
(A) MCT1fl/fl mice were bred with LysM-Cre mice to generate macrophage-specific MCT1-knockout (LysM-Cre MCT1fl/fl) and littermate control (MCT1fl/fl) mice. (B) Schematic representation of the sciatic nerve crush site and electrode setups for the electrophysiological studies. (C) Motor NCV and (D) CMAP amplitude recovery of crushed nerves (percentage relative to the pre-crush value). n = 13 for MCT1fl/fl mice; n = 11 for LysM-Cre MCT1fl/fl mice. *P < 0.05, **P < 0.01, and ***P < 0.001, by 2-way ANOVA with Bonferroni’s multiple-comparison test (C and D). The vertical lines in C and D represent the overall statistical comparison between the data sets from mice of the 2 genotypes. (E and G) Representative photomicrographs of fluorescently labeled NMJs in gastrocnemius muscles after nerve crush. Muscles were stained with α-bungarotoxin (BTX, red) and antibodies against neurofilaments (SMI312; green) and synaptophysin (blue) to visualize acetylcholine receptors (AChRs) and nerve terminals, respectively. Scale bars: 100 μm. (F and H) Percentage of fully reinnervated (Full inn), partially reinnervated (Partial inn), and denervated (Den) AChR clusters in LysM-Cre MCT1fl/fl mice compared with their littermate MCT1fl/fl controls, (F) 3 and (H) 6 weeks after nerve crush. n = 3–4 per group. *P < 0.05, by 2-way ANOVA with Bonferroni’s multiple-comparison test. (I and N) Photomicrographs (scale bars: 20 μm), (J and O) scatter plot graph displaying the g ratios in relation to the axon diameters of individual myelinated axons, (K and P) g ratios, (L and Q) myelinated axon diameters, and (M and R) myelinated axon counts of sural nerves from LysM-Cre MCT1fl/fl and MCT1fl/fl mice after sciatic nerve crush. Light microscope photomicrographs and subsequent analysis were completed on toluidine blue–stained sections. n = 3–4 per group. *P < 0.05 and **P < 0.01, by unpaired, 2-tailed t test (JM and OR). All data indicate the mean ± SEM.
Figure 2
Figure 2. Selective ablation of MCT1 in SCs, DRG neurons, or perineurial cells has no effect on peripheral nerve regeneration.
MCT1fl/fl mice were bred with transgenic mice with Cre recombinase driven by P0-Cre, Adv-Cre, or Gli1-CreERT2 to generate SC-, DRG neuron–, or perineurial cell–specific MCT1-knockout mice, respectively, and littermate control mice (upper schematic panels). (A, C, and E) Motor NCV and (B, D, and F) CMAP amplitude recovery of nerves were measured after injury. Recoveries are presented as a percentage relative to the pre-crush conditions. No significant difference in NCV or CMAP recovery was found at any time point to be the result of any cell-specific MCT1 deficiency. n = 6–10 per group. Two-way ANOVA with Bonferroni’s multiple-comparison test. All data indicate the mean ± SEM.
Figure 3
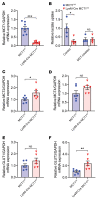
Figure 3. Validation of macrophage-specific MCT1-deficient mice.
Expression of the MCT1 mRNAs (A) MCT1, (C) MCT2, and (D) MCT4, and the glucose transporter mRNAs (E) GLUT1 and (F) GLUT3 was evaluated in cultures of peritoneal exudate macrophages from LysM-Cre MCT1fl/fl and littermate control (MCT1fl/fl) mice. mRNA levels are shown as the fold change compared with mRNA levels in MCT1fl/fl mice, normalized to the corresponding GAPDH mRNA levels. n = 5–9 per group. *P < 0.05, **P < 0.01, and ***P < 0.001, by unpaired, 2-tailed t test. (B) Lactate uptake and blockade by a selective MCT1 inhibitor in cultures of peritoneal exudate macrophages from LysM-Cre MCT1fl/fl and MCT1fl/fl mice. Lactate uptake is shown as the fold change relative to uptake in littermate control mice. n = 4–5 per group. *P < 0 .05, by 2-way ANOVA with Bonferroni’s multiple-comparison test. All data indicate the mean ± SEM.
Figure 4
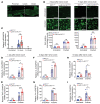
Figure 4. MCT1 ablation in macrophages does not affect the infiltration of Iba1-positive cells but critically modulates inflammatory cytokine expression in injured sciatic nerves.
On day 3 (A and B, left panels) and day 7 (B, right panels) after nerve crush, the number of Iba1-positive macrophages infiltrating into the nerves (B shows representative images from at least 4 independent experiments) from mice of both genotypes was unchanged. Total Iba1-positive macrophage counts were obtained from Z-stack images of 20 μm thick complete nerve cross-sections. n = 4–7 per group. Two-way ANOVA with Bonferroni’s multiple-comparison test. Scale bars: 200 μm (A) and 50 μm (B). (C) No change in mRNA Ly6G expression in uncrushed and crushed sciatic nerves (distal to the site of injury) was detected in LysM-Cre MCT1fl/fl mice compared with expression in littermate control MCT1fl/fl mice, as evaluated by real-time reverse transcriptase PCR (RT-PCR). Day-1 post-crush (1 d crush) mRNA levels are shown as the fold change compared with mRNA levels in crushed sciatic nerves isolated from MCT1fl/fl mice, normalized to the corresponding GAPDH mRNA levels. n = 5–8 per group. ND, not detected. Unpaired, 2-tailed t test. (DI) mRNA expression levels of (D) IL-1β and (E) TNF-α on day 1 after crush; (F) IL-1β and (G) Ym-1 on day 3 after crush; and (H) Ym-1 and (I) Arg-1 on day 10 after crush in uncrushed and crushed sciatic nerves (distal to the site of injury) were evaluated by real-time RT-PCR. mRNAs levels are shown as the fold change compared with uncrushed sciatic nerves isolated from MCT1fl/fl mice, normalized to their corresponding GAPDH mRNA levels. n = 3–9 per group. *P < 0.05, **P < 0.01, and ***P < 0.001, by 2-way ANOVA with Bonferroni’s multiple-comparison test. All data indicate the mean ± SEM.
Figure 5
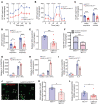
Figure 5. MCT1 ablation impairs metabolic functions, alters the expression of inflammatory cytokines, and worsens the phagocytic activity of macrophages in vitro.
The ECAR (A) and OCR (B) were measured in peritoneal exudate macrophages isolated from LysM-Cre MCT1fl/fl and MCT1fl/fl mice with the Seahorse extracellular flux analyzer. (C) Comparison of ECARs during basal conditions and following oligomycin treatment. (D) Comparison of OCRs during basal respiration and FCCP-induced maximal respiration. (E) The SRC (maximal minus basal respiration) was calculated. (F) Total ATP generated by oxidative metabolism and glycolysis. n = 10 per group. *P < 0.05 and ***P < 0.001, by 2-way ANOVA with Bonferroni’s multiple-comparison test (C and D) and unpaired, 2-tailed t test (E and F). (GI) Peritoneal exudate macrophages were treated with (G and H) LPS (100 ng/mL) plus IFN-γ (50 U/mL) or (I) IL-4 for 3 hours, and (G) IL-1β, (H) IL-6, and (I) Arg-1 mRNA levels were assessed by real-time RT-PCR (fold change relative to littermate controls). n = 3 per group. *P < 0.05 and ***P < 0.001, by 2-way ANOVA with Bonferroni’s multiple-comparison test. (JL) Peritoneal exudate macrophages (30,000 cells/well for the 8-well chamber slide) were incubated with fluorescent microspheres (red) for 2 hours, visualized by immunostaining with anti-CD68 antibody (green), and (J) imaged by confocal microscopy (representative images) to (K) determine the percentage of cells with internalized fluorescent microspheres. n = 5–7 per group. Scale bars: 50 μm (zoom, ×2). (L) Expression of MGF-E8 mRNA was assessed in peritoneal exudate macrophages (fold change relative to littermate controls). n = 10–12 per group. *P < 0.05, by unpaired, 2-tailed t test (K and L). All data indicate the mean ± SEM. R+A, rotenone and antimycin.
Figure 6
Figure 6. MCT1 determines the immune responses of macrophages potentially through ATF3.
Cultures of peritoneal exudate macrophages from LysM-Cre MCT1fl/fl and littermate control MCT1fl/fl mice were treated with a M1 phenotype–inducer mixture (100 ng/mL LPS plus 50 U/mL IFN-γ) for 6 and 24 hours. (A) Protein levels of ATF3 were assessed by Western blotting. The full-length Western blots were used for densitometric quantification, and (B) ATF3 expression, normalized to β-actin, is presented as the fold change relative to untreated macrophages from MCT1fl/fl mice. n = 3 per group. **P < 0.01, by 2-way ANOVA with Bonferroni’s multiple-comparison test. (C and D) mRNA expression of Atf3 on post-injury days (C) 1 and (D) 10 in uncrushed and crushed sciatic nerves (distal to the site of injury) was evaluated by real-time RT-PCR. mRNA levels are shown as the fold change compared with uncrushed sciatic nerves isolated from MCT1fl/fl mice, normalized to their corresponding GAPDH mRNA levels. n = 3–7 per group. *P < 0 .05 and ***P < 0.001, by 2-way ANOVA with Bonferroni’s multiple-comparison test. (E) Schematic representation of the potential role of MCT1 in nerve regeneration after injury, suggesting that MCT1 deletion in macrophages decreases the expression of ATF3, which leads to increases in the expression of proinflammatory cytokines and impaired nerve regeneration. All data indicate the mean ± SEM.
Figure 7
Figure 7. Adoptive cell transfer of macrophages with intact MCT1 ameliorates delayed nerve regeneration in macrophage-specific MCT1-deficient mice.
(A) Schematic showing i.v. tail-vein injection of BMDMs genetically manipulated to express GFP 3 days after sciatic nerve crush and processing of the nerves for immunohistochemical analysis 7 days after injection. Both donor and recipient mice used in these studies were on a C57BL/BJ background. BMDMs targeted the injured sciatic nerve (B, lower panel), but not the uninjured sciatic nerve (B, upper panel) following the i.v. injection. Scale bars: 100 μm. (C) High-magnification images of nerve samples harvested 7 days after tail-vein injection showed that many of the GFP-positive cells (left panel) expressed F4/80 (red; middle panel), a specific macrophage marker, as shown in merged image (right panel). Images are representative confocal micrographs of 3 independent experiments. Scale bars: 20 μm. (D) Schematic showing i.v. tail-vein injection of BMDMs from wild-type mice with intact MCT1 (Mϕ with MCT1) 3 days after sciatic nerve crush and quantification of nerve regeneration by electrophysiology over a 6-week period in C57Bl6 macrophage–selective MCT1-null (B6 LysM-Cre MCT1fl/fl) and wild-type (B6 MCT1WT) mice. Both donor and recipient mice used in these studies were on a C57BL/6J background. (E) Motor NCV and (F) CMAP amplitude recovery of nerves after injury in B6 MCT1WT, B6 LysM-Cre MCT1fl/fl, and B6 MCT1WT mice following tail-vein injection of BMDMs isolated from B6 MCT1WT mice (B6 MCT1WT + Mϕ with MCT1), and after injury in B6 LysM-Cre MCT1fl/fl mice following tail-vein injection of BMDMs isolated from MCT1WT mice (B6 LysM-Cre MCT1fl/fl + Mϕ with MCT1). Recoveries are presented as the percentage relative to pre-crush conditions. n = 4 per group. *P < 0.05, **P < 0.01, and ***P < 0.001, by 2-way ANOVA with Bonferroni’s multiple-comparison test. All data indicate the mean ± SEM.
Figure 8
Figure 8. Tet-inducible selective overexpression of MCT1 in macrophages promotes the regeneration of injured peripheral nerves.
(A) Transgenic mice with upregulation of MCT1 selectively in macrophages (LysM-Cre tTA+/– MCT1Over/+) were produced by crossing LysM-Cre mice with lox-stop-lox tTA mice (tet-off) and a tet-responsive MCT1-overexpressing mouse. (B) MCT1 overexpression was confirmed by evaluating MCT1 mRNA expression in peritoneal exudate macrophages using real-time RT-PCR (fold change relative to MCT1Over/WT littermate controls). n = 3–8 per group. ***P < 0.001, by unpaired, 2-tailed t test. (C) Lactate uptake in peritoneal exudate macrophages was assessed and is shown as the fold change relative to MCT1Over/WT mice. n = 3 per group. *P < 0.05, by unpaired, 2-tailed t test. (D) Motor NCV and (E) CMAP amplitude recoveries (percentage relative to pre-crush) of nerves after injury. n = 8 for MCT1Over/WT mice; n = 6 for LysM-Cre tTA+/– MCT1Over/WT mice. *P < 0.05, **P < 0.01, and ***P < 0.001, by 2-way ANOVA with Bonferroni’s multiple-comparison test. Vertical lines in D and E represent the overall statistical comparison between the data sets from mice of the 2 genotypes. (F) Representative photomicrographs of fluorescently labeled NMJs in gastrocnemius muscles 6 weeks after crush. Muscles were stained with BTX (red) and antibodies against neurofilaments (green) and synaptophysin (blue) to visualize AChRs and nerve terminals, respectively. Scale bars: 50 μm. (G) Fully reinnervated, partially reinnervated, and denervated AChR clusters 6 weeks after crush. n = 5 per group. **P <0 .01, by 2-way ANOVA with Bonferroni’s multiple-comparison test. (H) Representative photomicrographs and (I) myelinated axon counts in sural nerves from LysM-Cre tTA+/– MCT1Over/+ and MCT1Over/WT mice 6 weeks after sciatic nerve crush. Light microscope photomicrographs and subsequent analysis were done on toluidine blue–stained sections. n = 4–5 per group. *P < 0.05, by unpaired, 2-tailed t test. Scale bars: 20 μm. All data indicate the mean ± SEM.

References

    1. Conforti L, et al. Wallerian degeneration: an emerging axon death pathway linking injury and disease. Nat Rev Neurosci. 2014;15(6):394–409. - PubMed
    1. Cattin AL, Lloyd AC. The multicellular complexity of peripheral nerve regeneration. Curr Opin Neurobiol. 2016;39:38–46. doi: 10.1016/j.conb.2016.04.005. - DOI - PubMed
    1. Stierli S, et al. Schwann cell plasticity-roles in tissue homeostasis, regeneration, and disease. Glia. 2019;67(11):2203–2215. doi: 10.1002/glia.23643. - DOI - PubMed
    1. Godzik K, Coleman MP. The axon-protective WLD(S) protein partially rescues mitochondrial respiration and glycolysis after axonal injury. J Mol Neurosci. 2015;55(4):865–871. doi: 10.1007/s12031-014-0440-2. - DOI - PMC - PubMed
    1. Geisler S, et al. Gene therapy targeting SARM1 blocks pathological axon degeneration in mice. J Exp Med. 2019;216(2):294–303. doi: 10.1084/jem.20181040. - DOI - PMC - PubMed

Publication types

Substances