. 2021 Sep 7;19(9):e3001352.
doi: 10.1371/journal.pbio.3001352. eCollection 2021 Sep.

The antiviral state has shaped the CpG composition of the vertebrate interferome to avoid self-targeting

Affiliations

The antiviral state has shaped the CpG composition of the vertebrate interferome to avoid self-targeting

Andrew E Shaw et al. PLoS Biol. .

Abstract

Antiviral defenses can sense viral RNAs and mediate their destruction. This presents a challenge for host cells since they must destroy viral RNAs while sparing the host mRNAs that encode antiviral effectors. Here, we show that highly upregulated interferon-stimulated genes (ISGs), which encode antiviral proteins, have distinctive nucleotide compositions. We propose that self-targeting by antiviral effectors has selected for ISG transcripts that occupy a less self-targeted sequence space. Following interferon (IFN) stimulation, the CpG-targeting antiviral effector zinc-finger antiviral protein (ZAP) reduces the mRNA abundance of multiple host transcripts, providing a mechanistic explanation for the repression of many (but not all) interferon-repressed genes (IRGs). Notably, IRGs tend to be relatively CpG rich. In contrast, highly upregulated ISGs tend to be strongly CpG suppressed. Thus, ZAP is an example of an effector that has not only selected compositional biases in viral genomes but also appears to have notably shaped the composition of host transcripts in the vertebrate interferome.


Conflict of interest statement

The authors have declared that no competing interests exist.

Figures

Fig 1
Fig 1. Compositional features predict expression class following IFN treatment.
(A–C) Accuracy of classifiers trained to distinguish the top 50 most DE ISGs from the top 50 most DE IRGs (A), ISGs from 50 random genes (from each species) (B), or IRGs from 50 random genes (from each species) (C). Bars show the average proportion of genes in each class that were accurately identified across 50 replicates of 5-fold cross-validation, while error bars show the region containing 95% of observed accuracy values. Dashed lines indicate the expected performance of a null (i.e., uninformative) model. (D, E) The 15 most important features used by classifiers to distinguish ISGs from IRGs (D) or ISGs from random genes (E). The equivalent panel with the features used by classifiers to distinguish IRGs from random genes is shown in S3 Fig. Feature importance was quantified for individual genes using the SHAP approach [23,24], before summing their magnitude across all genes from a given species. All classifiers were trained and evaluated on 500 genes from each class, representing the top 50 ISGs or IRGs, or 50 random genes, from each species. Three-letter codes of the form “CpG” indicate measures of dinucleotide composition, single letters followed by the word “bias” (e.g., S-Bias) indicate amino acid composition biases, and 3 letters followed by the word “bias” (e.g., AGA-Bias) indicate codon usage biases. (F) The CAI of the 50 most DE ISGs and IRGs calculated as described previously [25]. The CAI is a measure of optimal codon usage; a higher CAI indicates a more optimal usage of codons. The horizontal dotted line represents the median for all transcripts in the human genome. Statistical significance was assessed using the Wilcoxon rank sum test with continuity correction. (G) The fold change in median dinucleotide composition between the top 50 most DE ISGs and IRGs in humans (summarising S2 Fig). The underlying RNA-seq data analysed in (A–G) were our previously published open-access data [4]. Briefly, primary fibroblasts derived from human, rat, cow, sheep, pig, horse, dog, little brown bat, and chicken, as well as immortalised large flying fox cells, were treated with type I IFNs (1,000 U/ml universal IFN, 200 ng/ml canine IFNα, 1,000 U/ml porcine IFNα, or 200 ng/ml chicken IFNα) for 4 hours before being analysed using RNA-seq [4]. (H) Accuracy of classifiers trained to distinguish the top 50 most DE ISGs from the top 50 most DE IRGs in a microarray dataset from a species not used to develop the model (murine NIH 3T3 cells +/− 100 units IFN [26], extracted from the interferome database [2]). The underlying data from this figure are openly available (http://dx.doi.org/10.5525/gla.researchdata.1159). CAI, Codon Adaptation Index; DE, differentially expressed; IFN, interferon; IRG, interferon-repressed gene; ISG, interferon-stimulated gene; RNA-seq, RNA sequencing; SHAP, SHapley Additive exPlanations.
Fig 2
Fig 2. The vertebrate interferome has a CpG bias.
(A) The length-normalised (cDNA) CpG frequency (see Materials and methods) of the top 50 most DE human ISGs and IRGs (ranked by mean Log2FC) is shown. The dashed line represents the median CpG frequency of all transcripts in the relevant genome, a random sample of non-DE genes is included for reference, and whiskers represent the median and interquartile range for the analysed group. (B) The interferomes of the remaining 9 vertebrate species are plotted as in (A). The underlying RNA-seq data used were previously published open-access data [4] and were also described in the Fig 1 legend. Significance was determined using the Wilcoxon rank sum test with continuity correction. The underlying data from this figure are openly available (http://dx.doi.org/10.5525/gla.researchdata.1159). DE, differentially expressed; IRG, interferon-repressed gene; ISG, interferon-stimulated gene; RNA-seq, RNA sequencing.
Fig 3
Fig 3. Type I IFNs exhibit extreme CpG suppression.
(A) Significantly enriched GO processes and functions identified through GOrilla enrichment analysis of the 1,000 most CpG-suppressed cDNAs >100 bp (compared to all cDNAs >100 bp). (B) The CpG frequency in immune genes, ISGs, IRGs, and type I IFNs (for ISGs and IRGs, all significantly DE genes and the top 50 most DE genes are plotted). Matrices highlighting the significance (Kruskal–Wallis rank sum test) of potential comparisons in Fig 3B are displayed in S6 Fig. (C) A phylogenetic tree of the 9 primate species used to quantify CpG conservation in Figs 3D, 3E, and 5D. (D, E) Conservation is plotted as the number of CpGs per kb, binned by the number of species that possess that specific CpG, where 1:1 orthologs exist. Bin “1” represents CpGs present in only 1 of the species, whereas bin “9” represents CpGs conserved in all of the 9 species considered. CpG conservation is plotted for (D) type I IFNs (4 1:1 orthologs) and (E) top 50 ISGs (30 1:1 orthologs) and IRGs (34 1:1 orthologs). * Full GO process names: “positive regulation of peptidyl-serine phosphorylation of STAT protein” and “negative regulation of adaptive immune response based on somatic recombination of immune receptors built from immunoglobulin superfamily domains.” Arrow indicates a function enriched by genes other than the IFN genes IFNA2 and IFNA14. The underlying data from this figure are openly available (http://dx.doi.org/10.5525/gla.researchdata.1159). DE, differentially expressed; dsRNA, double-stranded RNA; GO, gene ontology; IFN, interferon; IRG, interferon-repressed gene; ISG, interferon-stimulated gene.
Fig 4
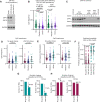
Fig 4. ZAP mediates the IFN-induced repression of a subset of IRGs.
(A) WB analysis of ZAP and GAPDH expression in human “bulk populations” of A549 cells transduced with ZAP-targeting CRISPR sgRNAs or transduced Cas-9 expressing “No guide” controls. ZAP-L (PARP13.1) and ZAP-S (PARP13.2) bands are indicated [34]. (B) The CpG content of significantly DE genes (identified using RNA-seq in the absence of IFN using edgeR and an FDR <0.05), comparing triplicate “bulk” KO cells and transduced controls or unmodified cells. A random selection of 50 genes is included for comparison. Bars represent the median values, and whiskers represent the interquartile ranges. Horizontal dotted lines represent the median of all transcripts in the human genome. Significance was determined using a Kruskal–Wallis rank sum test (only significant comparisons are shown). (C) WB analysis (as in A) of clonal lines modified with ZAP-targeting CRISPR sgRNAs or parallel clonal lines derived from Cas-9 expressing transduced “No guide” controls. (D, E) The CpG content (D) or the normalised CpG content (E) of the 50 most significantly DE ISGs and IRGs (ranked by mean Log2FC), determined using RNA-seq of the 10 clones in (C) stimulated with 1,000 units/ml of IFNβ (4 hours) are shown, alongside 50 random genes. Where fewer than 50 significantly DE genes were detected, all significantly DE genes are plotted. Significance was assessed using the Wilcoxon rank sum test with continuity correction. (F) The predicted probability that the IRGs classified in the presence of ZAP or the absence of ZAP, from (D and E), are IRGs based on their nucleotide composition. Significance was assessed using the Kruskal–Wallis rank sum test (only insignificant comparisons are shown). (G, H) Numbers of significantly DE IRGs (G) or ISGs (H) from the RNA-seq of cells in either (A) (“bulk”) or (C) (“clones”) stimulated with 1,000 units/ml of IFNβ (4 hours). The underlying data from this figure are openly available (http://dx.doi.org/10.5525/gla.researchdata.1159). DE, differentially expressed; FDR, false discovery rate; IFN, interferon; IRG, interferon-repressed gene; ISG, interferon-stimulated gene; KO, knockout; RNA-seq, RNA sequencing; sgRNA, single-guide RNA; WB, western blot; ZAP, zinc-finger antiviral protein.
Fig 5
Fig 5. Identification of host transcripts consistently targeted by IFN-stimulated ZAP.
(A) The identity and differential expression of the 15 IRGs identified in Shaw et al. [4], as well as in bulk and clone NO GUIDE controls (derived from the overlapping populations, left-hand side of panel B in S8 Fig). Shaded genes represent IRGs whose repression is not observed following ZAP KO. (B) WB of FAM171A1, ZAP, P-STAT1, and GAPDH in A549 NO GUIDE or ZAP KO clones stimulated with 1,000 units/ml of IFNβ (24 hours). (C) The CpG contents of 10 ZAP-dependent (ZAP-DEP) IRGs and 5 ZAP-independent (ZAP-IN) IRGs (identified in A) are shown alongside the most DE ISGs and IRGs from Fig 2A. Significance was assessed using the Kruskal–Wallis rank sum test; significant differences are shown (all comparisons listed in S9 Fig). (D) CpG conservation among 9 primate species (as in Fig 3C–3E) is plotted as the number of CpGs per kb, binned by the number of species that possess that specific CpG, where 1:1 orthologs exist (ZAP-DEP n = 5). “1” represents CpGs present in only 1 of the species, whereas “9” represents CpGs conserved in all of the 9 species considered (top 50 ISGs includes 30 1:1 orthologs and top 50 IRGs includes 34 1:1 orthologs). (E) The 10 putative ZAP targets (identified in A) encoded by lentiviral vectors were used to transduce human cells prior to serially diluted challenge with a GFP-expressing virus. The resulting titres were calculated using flow cytometry and normalised to the empty vector control. These data were plotted as the fold change in titre (y-axis) relative to the empty vector control cells (yellow circles represent each cDNA). (F) The impact of ZAP KO (see Materials and methods) on the replication of Indiana vesiculovirus in the presence and absence of IFNβ. (G) WB for ZAP in bulk A549 cells KO’d for ZAP (ZAP KO guide 1) compared to mock treated cells (No guide). (H) WB of A549 ZAP KO cells (guide 1, clone 2; Fig 4C) transduced with an empty lentiviral vector or a lentiviral vector encoding CRISPR-resistant ZAP-S. (I) The transcriptomes of the transduced cells in (H) were defined using RNA-seq and the CpG compositions of the 50 most downregulated transcripts are shown. Significance was determined using the Wilcoxon rank sum test with continuity correction. (J) The predicted probability that the most reduced transcripts in (I) are IRGs. A sample of 50 random genes (not used for training) are included as a comparator. Significance was determined as in (I). (K) The transcript abundance of the 10 ZAP targets identified in (A) in the cells from (H) and (I) is shown. (L) The CpG frequency and (M) normalised CpG frequency of the 7ZAP-DEP IRGs and 5 ZAP-independent (ZAP-IN) IRGs (identified in A and J) are shown alongside the most DE ISGs and IRGs from Fig 2A. Significance was assessed as in (C). The dashed line in (C), (I), (L) and (M) represents the median CpG frequency of all transcripts in the genome, a random sample of non-DE genes is included for reference, and whiskers represent the median and interquartile range for the analysed group. The underlying data from this figure are openly available (http://dx.doi.org/10.5525/gla.researchdata.1159). BUNV, Bunyamwera orthobunyavirus; CHNV, Chandipura vesiculovirus; DE, differentially expressed; HIV-1, Human immunodeficiency virus 1; HSV-1, Human alphaherpesvirus 1 (formerly known as herpes simplex virus 1); IAV, Influenza A virus; IFN, interferon; IRG, interferon-repressed gene; ISG, interferon-stimulated gene; KO, knockout; P-STAT1, phosphorylated STAT1; PIV-3, Human respirovirus 3 (formerly parainfluenza virus 3); PIV-5, Mammalian orthorubulavirus 5 (formerly parainfluenza virus 5 or simian virus 5); RNA-seq, RNA sequencing; RVFV, Rift Valley fever phlebovirus; SeV, Murine respirovirus (formerly Sendai virus); SFV, Semliki Forest virus; VSV, Indiana vesiculovirus (formerly vesicular stomatitis virus); WB, western blot; ZAP, zinc-finger antiviral protein; ZAP-DEP, ZAP-dependent.

Comment in

Similar articles

Cited by

References

    1. Der SD, Zhou AM, Williams BRG, Silverman RH. Identification of genes differentially regulated by interferon alpha, beta, or gamma using oligonucleotide arrays. Proc Natl Acad Sci U S A. 1998;95(26):15623–8. doi: 10.1073/pnas.95.26.15623 WOS:000077697200087. - DOI - PMC - PubMed
    1. Rusinova I, Forster S, Yu S, Kannan A, Masse M, Cumming H, et al.. INTERFEROME v2.0: an updated database of annotated interferon-regulated genes. Nucleic Acids Res. 2013;41(D1):D1040–D6. doi: 10.1093/nar/gks1215 WOS:000312893300148. - DOI - PMC - PubMed
    1. Schneider WM, Chevillotte MD, Rice CM. Interferon-Stimulated Genes: A Complex Web of Host Defenses. Annu Rev Immunol. 2014;32:513–45. doi: 10.1146/annurev-immunol-032713-120231 WOS:000336427400017. - DOI - PMC - PubMed
    1. Shaw AE, Hughes J, Gu Q, Behdenna A, Singer JB, Dennis T, et al.. Fundamental properties of the mammalian innate immune system revealed by multispecies comparison of type I interferon responses. PLoS Biol. 2017;15(12). ARTN e2004086.10.1371/journal.pbio.2004086. WOS:000418943900021. doi: 10.1371/journal.pbio.2004086 - DOI - PMC - PubMed
    1. Gebhardt A, Laudenbach BT, Pichlmair A. Discrimination of Self and Non-Self Ribonucleic Acids. J Interferon Cytokine Res. 2017;37(5):184–97. doi: 10.1089/jir.2016.0092 WOS:000400694200002. - DOI - PMC - PubMed

Publication types