. 2021 Sep 7;19(9):e3001377.
doi: 10.1371/journal.pbio.3001377. eCollection 2021 Sep.

A systemic cell cycle block impacts stage-specific histone modification profiles during Xenopus embryogenesis

Affiliations

A systemic cell cycle block impacts stage-specific histone modification profiles during Xenopus embryogenesis

Daniil Pokrovsky et al. PLoS Biol. .

Abstract

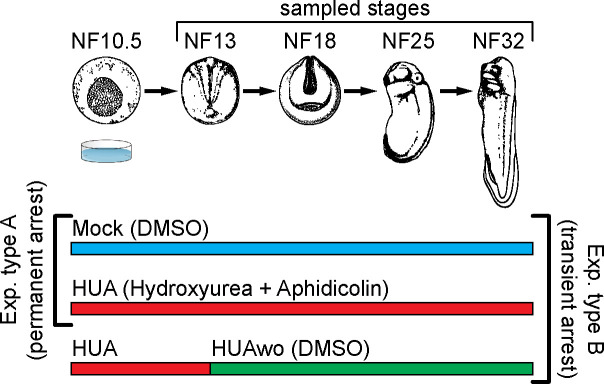
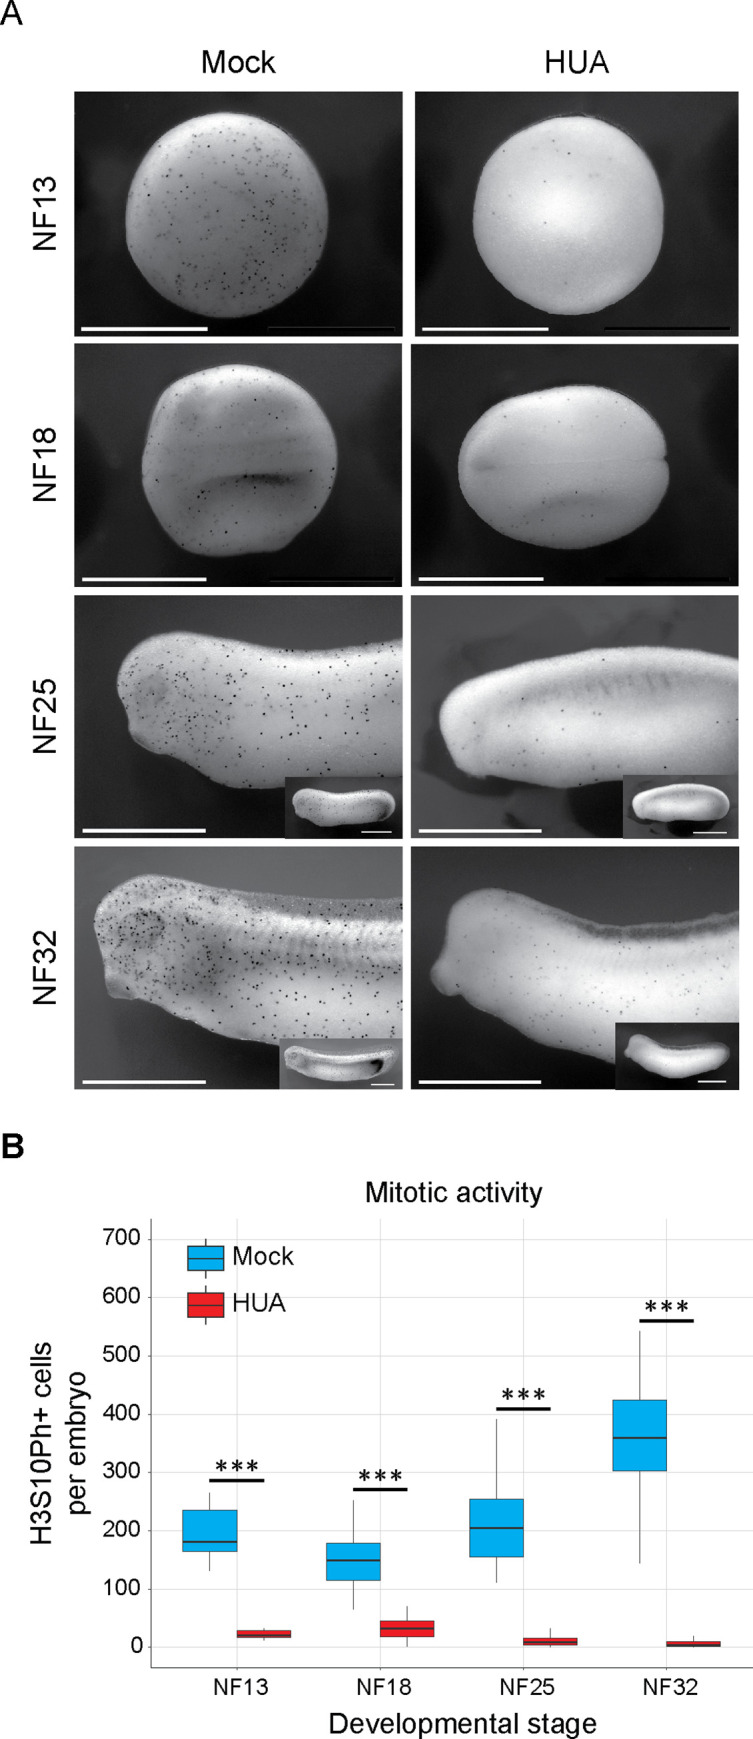
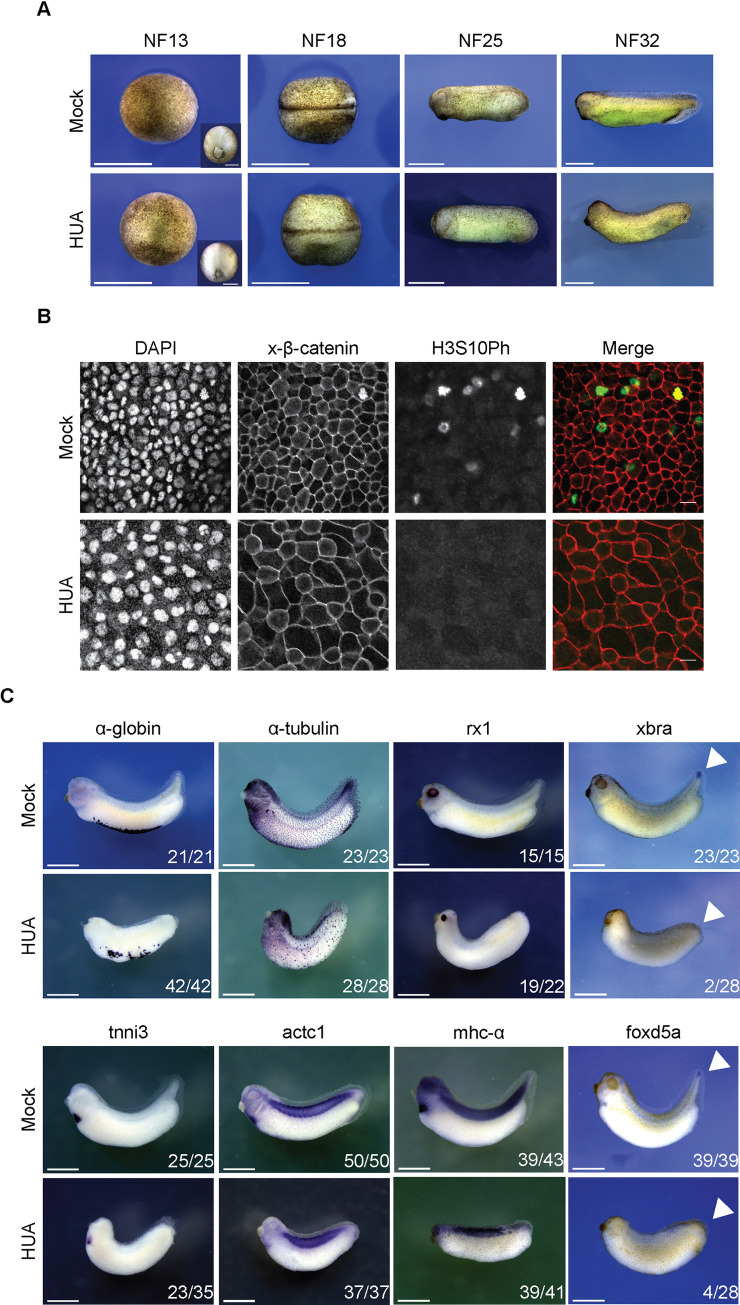
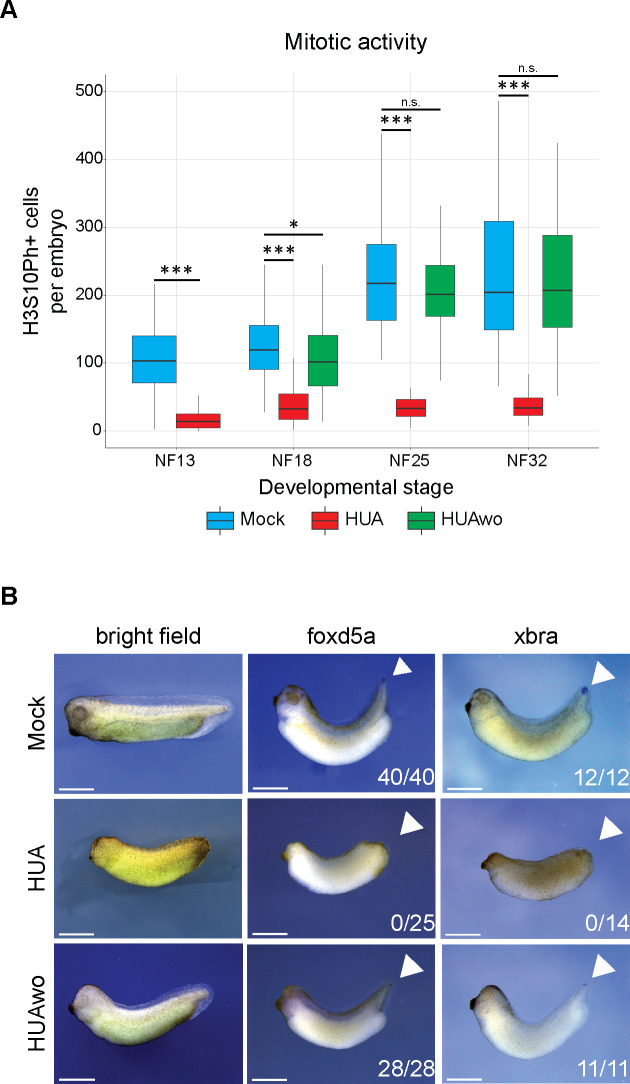
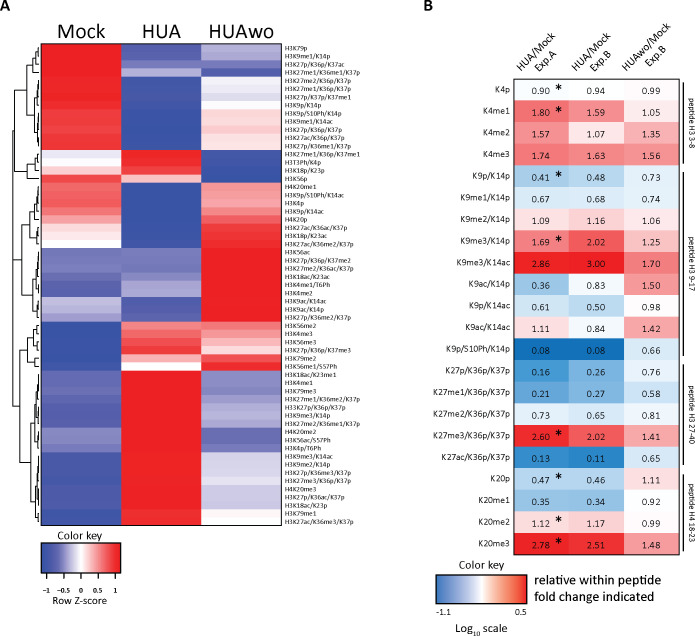
Forming an embryo from a zygote poses an apparent conflict for epigenetic regulation. On the one hand, the de novo induction of cell fate identities requires the establishment and subsequent maintenance of epigenetic information to harness developmental gene expression. On the other hand, the embryo depends on cell proliferation, and every round of DNA replication dilutes preexisting histone modifications by incorporation of new unmodified histones into chromatin. Here, we investigated the possible relationship between the propagation of epigenetic information and the developmental cell proliferation during Xenopus embryogenesis. We systemically inhibited cell proliferation during the G1/S transition in gastrula embryos and followed their development until the tadpole stage. Comparing wild-type and cell cycle-arrested embryos, we show that the inhibition of cell proliferation is principally compatible with embryo survival and cellular differentiation. In parallel, we quantified by mass spectrometry the abundance of a large set of histone modification states, which reflects the developmental maturation of the embryonic epigenome. The arrested embryos developed abnormal stage-specific histone modification profiles (HMPs), in which transcriptionally repressive histone marks were overrepresented. Embryos released from the cell cycle block during neurulation reverted toward normality on morphological, molecular, and epigenetic levels. These results suggest that the cell cycle block by HUA alters stage-specific HMPs. We propose that this influence is strong enough to control developmental decisions, specifically in cell populations that switch between resting and proliferating states such as stem cells.


Conflict of interest statement

The authors have declared that no competing interests exist.

Figures

Fig 1
Fig 1. Experimental design.
Top part: a schematic representation of Xenopus laevis embryonic development. Developmental stages (NF) according to Nieuwkoop and Faber (1994). Stages used for mass spectrometry of histone modifications and embryonic analyses are characterized by the following features: NF13—late gastrula, germ layer specified; NF18—neurula, germ layer patterning and differentiation; NF25—tailbud stage, organogenesis; NF32—early tadpole, body plan established. Bottom part: We perform 2 types of experiments: Experiment type A (G1/S block)—embryos are split in 2 groups, which from NF10.5 on are continuously incubated in HUA solution or control solution (DMSO as carrier). Experiment type B (transient arrest)—embryos are split in 3 groups: continuous Mock, continuous HUA, and transient HUA. In the last group, HUA solution is replaced at NF13 with DMSO solution. DMSO, dimethyl sulfoxide; HUA, hydroxyurea and aphidicolin; HUAwo, HUA washout.
Fig 2
Fig 2. Continuous HUA treatment inhibits mitotic activity from gastrula to tadpole stages.
(A) ICC for the mitotic histone mark H3S10Ph. Black dots represent mitotic cells. Elongated, older embryos are recorded as anterior halves, i.e., at the same magnification as younger stages, and in whole mount views as inserts. Scale bars: 1 mm. (B) Abundance of mitotic cells in Mock- and HUA-treated embryos. Box plots based on H3S10Ph-positive cells present on the recorded surface of embryos (n = 3 biological replicates/condition; Student t test [unpaired, two-tailed]; *** p < 0.001). The individual quantitative observations can be found in S1 Data. HUA, hydroxyurea and aphidicolin; ICC, immunocytochemical staining.
Fig 3
Fig 3. Morphological development of HUA-arrested embryos.
(A) During gastrulation, Mock and HUA embryos are indistinguishable. At NF18, the latter show a delay in neural tube closure. More severe malformations are detectable at stages NF25 and NF32, most notably reduced eye formation and absence of tail bud. Scale bars: 1 mm. (B) Cell size at the tailbud stage. Flattened Z-stack images show fields from embryonic skin at constant magnification (scale bars: 20 μm). Immunofluorescence detects cell borders (beta-catenin), nuclei (DAPI), and mitotic cells (H3S10Ph). GIFs from Z-stacks are presented in the Supporting information (S1 and S2 Videos). (C) Whole mount RNA in situ hybridization for indicated marker genes. Images are representative for the majority of Mock- or HUA-treated embryos from 3 biological experiments. While mRNAs of α-tubulin and rx1 (skin, neuronal), α-globin, tnni3, actc1, and mhc-α (mesodermal) are detected in both conditions, xbra and foxd5a (tail blastema) are absent in HUA embryos. Numbers indicate embryos positive for the marker over the total number of analyzed embryos. Scale bars: 1 mm. HUA, hydroxyurea and aphidicolin.
Fig 4
Fig 4. Mitotic activity shapes stage-specific HMPs.
(A) Heatmap of the absolute histone modification states abundance, normalized to the corresponding R10 spiketides. Data in columns represent an average from 3 biological replicates/condition. Color key: row Z-score. The individual quantitative observations can be found in S2 Data. (B) Ratio heatmap of relative histone modifications abundance for selected histone marks. In the first step, relative distributions of the indicated modification states were calculated in percentages within each tryptic peptide (see S4 Fig). Then, HUA values were divided by Mock values to produce the relative change for each histone modification state between the 2 conditions. Color key is based on the Log10 scale. Numerical values in the cells indicate the fold-change. Values greater than 1.0 indicate an increase in HUA condition; values smaller than 1.0 indicate a higher abundance in Mock condition. NA, not applicable, when values in Mock were 0. Asterisks (*), adj.p < 0.1 (Benjamini–Hochberg procedure). “p,” propionylated (naturally unmodified); “un,” tryptic peptide, which has no modification state. The direct comparison of relative histone PTMs abundance is shown in S4 Fig, with p-values indicated in S5 Table. HMP, histone modification profile; HUA, hydroxyurea and aphidicolin; PTM, posttranslational modification of histone.
Fig 5
Fig 5. The HUA effects on embryogenesis are reversible.
Embryos, which were transiently incubated in HUA solution and thus mitotically arrested, were returned to Mock solution at NF13. (A) Abundance of mitotic cells in Mock, HUA-treated, and HUAwo embryos. Box plots based on H3S10Ph-positive cells present on the recorded surface of embryos, displayed in S5 Fig (n ≥ 3 biological replicates/condition; Student t test [unpaired, two-tailed]; *** p < 0.001; * p < 0.05; n.s., not significant). The individual quantitative observations can be found in S3 Data. (B) Morphological and molecular features of embryos at the early tadpole stage. In contrast to continuous HUA-treated embryos, HUAwo embryos regain eye cups, fin, and tailbud structures. In addition, they express foxd5a and xbra mRNAs in the growth zone of the tailbud, comparable to Mock embryos. Numbers indicate embryos positive for the marker over the total number of analyzed embryos (n = 3 biological replicates/condition). Scale bars: 1 mm. HUA, hydroxyurea and aphidicolin; HUAwo, HUA washout.
Fig 6
Fig 6. HUA effects on stage-specific HMPs are reversible.
(A) Heatmap of the relative histone modification states abundance under the indicated conditions. As before, the relative distributions of the indicated modification states are calculated in percentages within each tryptic peptide. Data in columns are collected from early tadpole stage embryos NF32 (n = 1 biological replicate), independently from the data of experiment type A. Note: Relative differences between Mock and HUA samples of experiment type B are highly similar to the results of experiment type A (S6 Fig). Color key, row Z-score. The individual quantitative observations can be found in S4 Data. (B) Ratio heatmap of relative histone modification abundance for selected histone marks. First, the relative distributions of the indicated modification states are calculated as percentages within each tryptic peptide (S6 Fig). Then, the relative values are presented as ratios between sample pairs indicated on top, showing the relative change for each histone modification state between the 2 conditions. Color key is based on the Log10 scale. Numerical values in the cells indicate the fold-change. “p,” propionylated (naturally unmodified). Values greater than 1.0 indicate an increase in HUA condition; values smaller than 1.0 indicate a higher abundance in Mock condition. NA, not applicable, when values in Mock were 0. The first 2 columns illustrate the similarity between experiment types A and B; the information in the third column shows the similarity between HUAwo and Mock samples. Asterisks (*), adj.p < 0.1 (Benjamini–Hochberg procedure) between indicated conditions. The direct comparison of relative histone PTMs abundance is shown in S6 Fig. HMP, histone modification profile; HUA, hydroxyurea and aphidicolin; HUAwo, HUA washout.

Similar articles

Cited by

References

    1. Lawrence M, Daujat S, Schneider R. Lateral Thinking: How Histone Modifications Regulate Gene Expression [Internet]. Trends Genet. 2016;32:42–56. doi: 10.1016/j.tig.2015.10.007 - DOI - PubMed
    1. Kebede AF, Schneider R, Daujat S. Novel types and sites of histone modifications emerge as players in the transcriptional regulation contest. FEBS J. 2015. May;282(9):1658–74. doi: 10.1111/febs.13047 - DOI - PubMed
    1. Creyghton MP, Cheng AW, Welstead GG, Kooistra T, Carey BW, Steine EJ, et al.. Histone H3K27ac separates active from poised enhancers and predicts developmental state. Proc Natl Acad Sci U S A. 2010. Dec 14;107(50):21931–6. doi: 10.1073/pnas.1016071107 - DOI - PMC - PubMed
    1. Barrera LO, Li Z, Smith AD, Arden KC, Cavenee WK, Zhang MQ, et al.. Genome-wide mapping and analysis of active promoters in mouse embryonic stem cells and adult organs. Genome Res. 2008. Jan;18(1):46–59. doi: 10.1101/gr.6654808 - DOI - PMC - PubMed
    1. Myers FA, Evans DR, Clayton AL, Thorne AW, Crane-Robinson C. Targeted and extended acetylation of histones H4 and H3 at active and inactive genes in chicken embryo erythrocytes. J Biol Chem. 2001. Jun 8;276(23):20197–205. doi: 10.1074/jbc.M009472200 - DOI - PubMed

Publication types