

Pathway analysis in metabolomics: Recommendations for the use of over-representation analysis
- PMID: 34492007
- PMCID: PMC8448349
- DOI: 10.1371/journal.pcbi.1009105
Pathway analysis in metabolomics: Recommendations for the use of over-representation analysis
Abstract
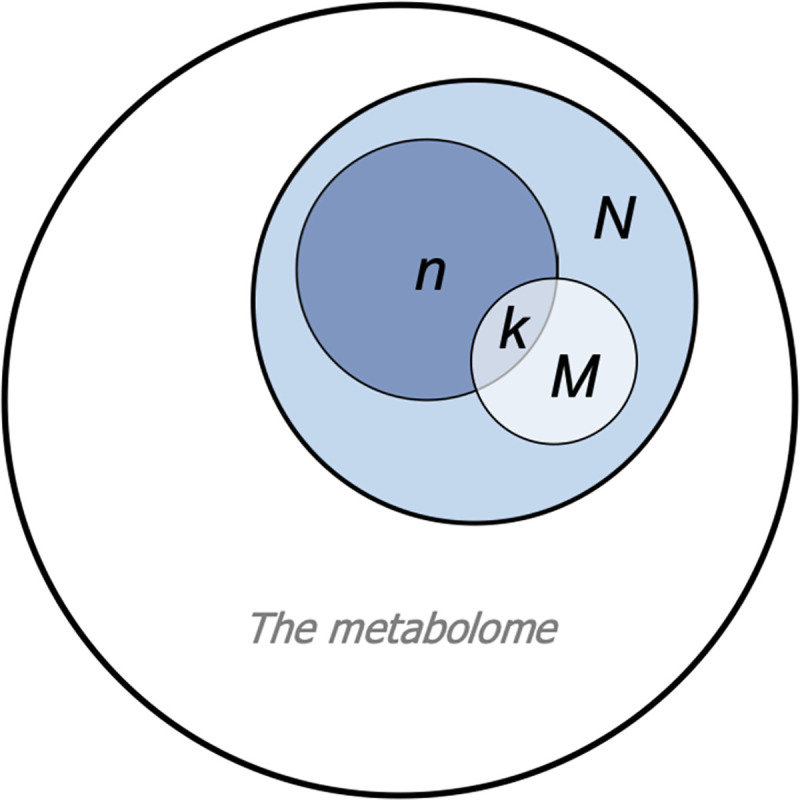
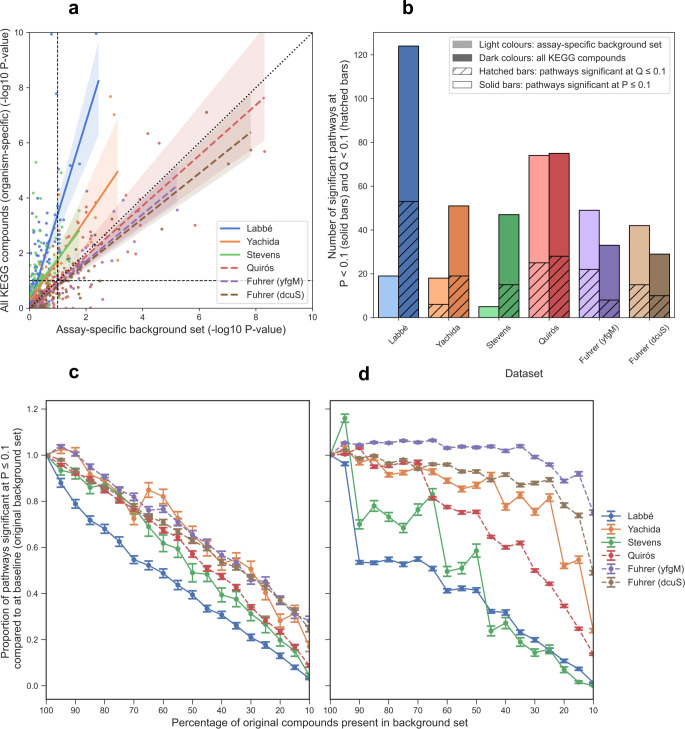
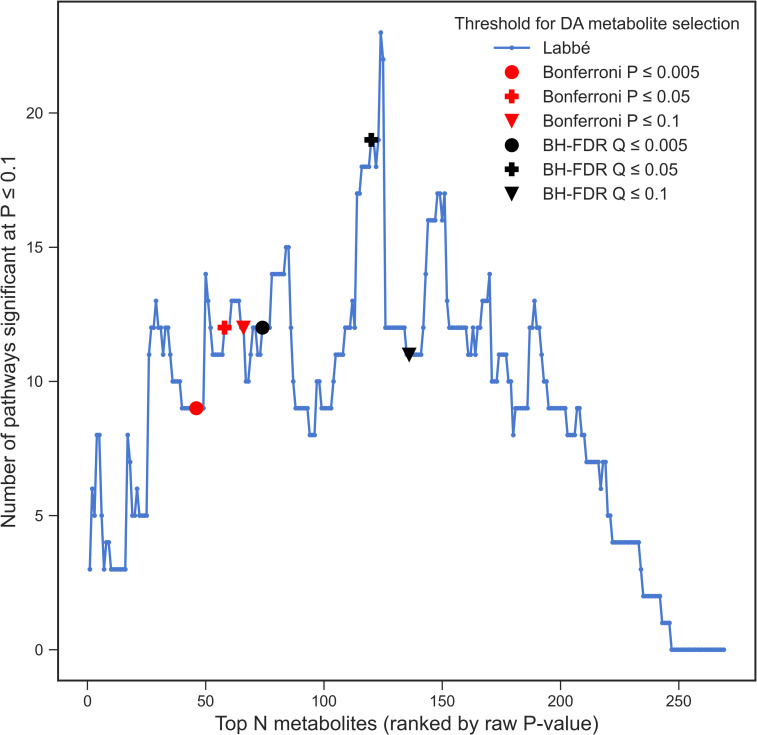
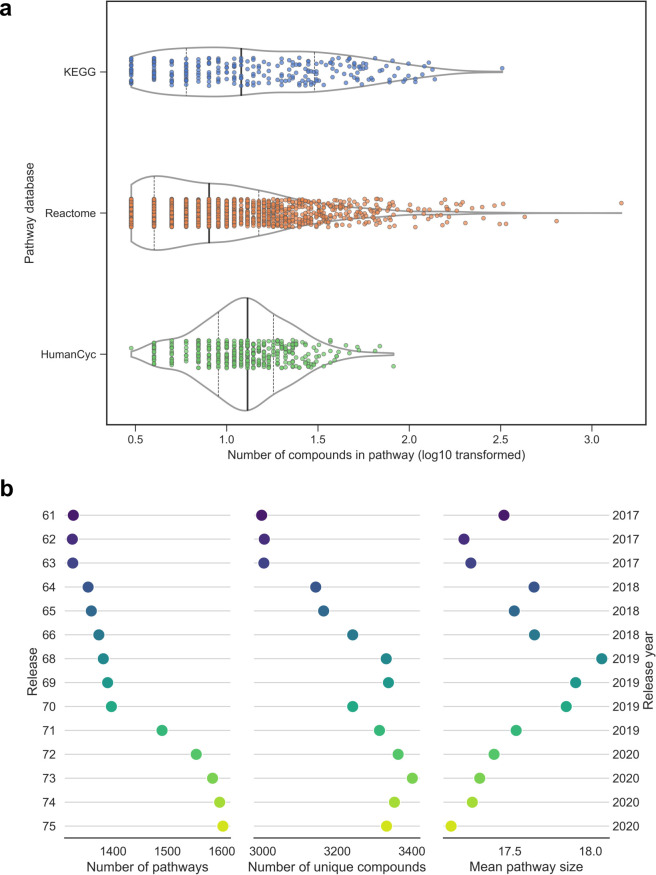
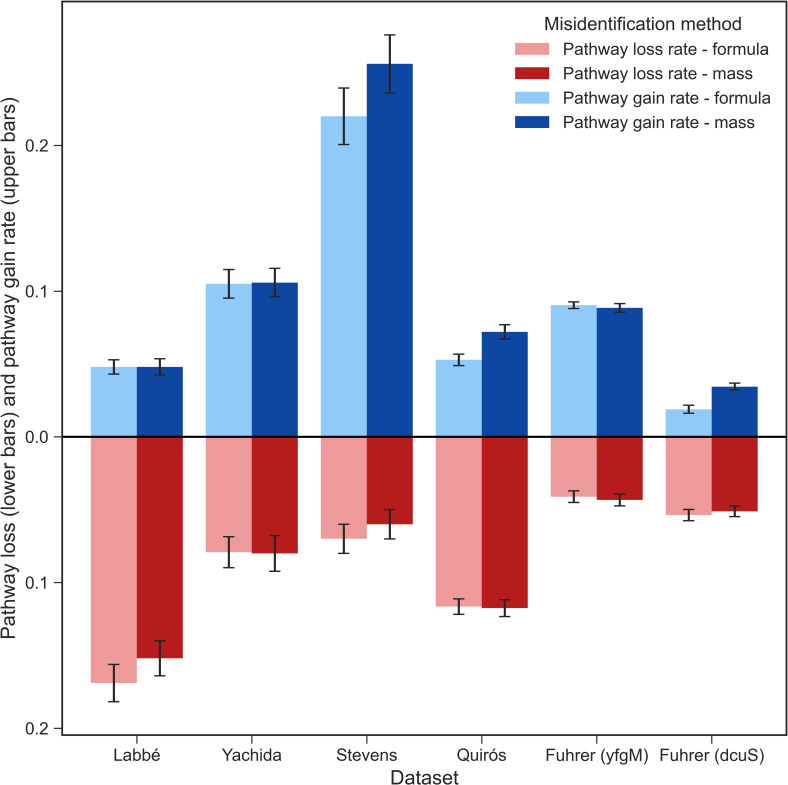
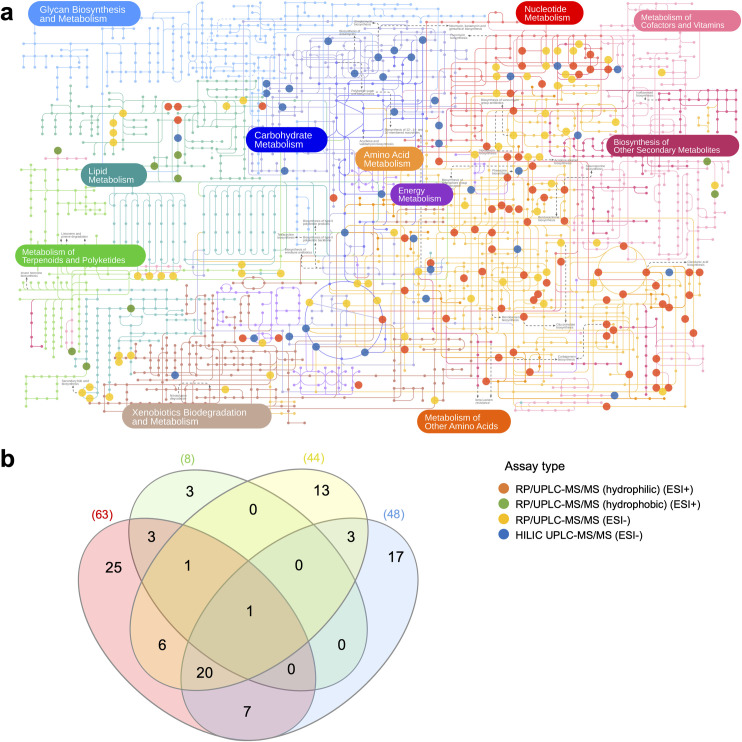
Over-representation analysis (ORA) is one of the commonest pathway analysis approaches used for the functional interpretation of metabolomics datasets. Despite the widespread use of ORA in metabolomics, the community lacks guidelines detailing its best-practice use. Many factors have a pronounced impact on the results, but to date their effects have received little systematic attention. Using five publicly available datasets, we demonstrated that changes in parameters such as the background set, differential metabolite selection methods, and pathway database used can result in profoundly different ORA results. The use of a non-assay-specific background set, for example, resulted in large numbers of false-positive pathways. Pathway database choice, evaluated using three of the most popular metabolic pathway databases (KEGG, Reactome, and BioCyc), led to vastly different results in both the number and function of significantly enriched pathways. Factors that are specific to metabolomics data, such as the reliability of compound identification and the chemical bias of different analytical platforms also impacted ORA results. Simulated metabolite misidentification rates as low as 4% resulted in both gain of false-positive pathways and loss of truly significant pathways across all datasets. Our results have several practical implications for ORA users, as well as those using alternative pathway analysis methods. We offer a set of recommendations for the use of ORA in metabolomics, alongside a set of minimal reporting guidelines, as a first step towards the standardisation of pathway analysis in metabolomics.
Conflict of interest statement
The authors have declared that no competing interests exist.
Figures
Similar articles
-
Evaluation and comparison of bioinformatic tools for the enrichment analysis of metabolomics data.BMC Bioinformatics. 2018 Jan 2;19(1):1. doi: 10.1186/s12859-017-2006-0. BMC Bioinformatics. 2018. PMID: 29291722 Free PMC article.
-
Translational Metabolomics of Head Injury: Exploring Dysfunctional Cerebral Metabolism with Ex Vivo NMR Spectroscopy-Based Metabolite Quantification.In: Kobeissy FH, editor. Brain Neurotrauma: Molecular, Neuropsychological, and Rehabilitation Aspects. Boca Raton (FL): CRC Press/Taylor & Francis; 2015. Chapter 25. In: Kobeissy FH, editor. Brain Neurotrauma: Molecular, Neuropsychological, and Rehabilitation Aspects. Boca Raton (FL): CRC Press/Taylor & Francis; 2015. Chapter 25. PMID: 26269925 Free Books & Documents. Review.
-
FELLA: an R package to enrich metabolomics data.BMC Bioinformatics. 2018 Dec 22;19(1):538. doi: 10.1186/s12859-018-2487-5. BMC Bioinformatics. 2018. PMID: 30577788 Free PMC article.
-
DNEA: an R package for fast and versatile data-driven network analysis of metabolomics data.BMC Bioinformatics. 2024 Dec 18;25(1):383. doi: 10.1186/s12859-024-05994-1. BMC Bioinformatics. 2024. PMID: 39695921 Free PMC article.
-
Pathway Analysis for Targeted and Untargeted Metabolomics.Methods Mol Biol. 2020;2104:387-400. doi: 10.1007/978-1-0716-0239-3_19. Methods Mol Biol. 2020. PMID: 31953827 Review.
Cited by
-
Knowledge Graphs for drug repurposing: a review of databases and methods.Brief Bioinform. 2024 Sep 23;25(6):bbae461. doi: 10.1093/bib/bbae461. Brief Bioinform. 2024. PMID: 39325460 Free PMC article. Review.
-
Exploration of Blood Metabolite Signatures of Colorectal Cancer and Polyposis through Integrated Statistical and Network Analysis.Metabolites. 2023 Feb 17;13(2):296. doi: 10.3390/metabo13020296. Metabolites. 2023. PMID: 36837915 Free PMC article.
-
Statistical analysis of high-dimensional biomedical data: a gentle introduction to analytical goals, common approaches and challenges.BMC Med. 2023 May 15;21(1):182. doi: 10.1186/s12916-023-02858-y. BMC Med. 2023. PMID: 37189125 Free PMC article. Review.
-
PathBank 2.0-the pathway database for model organism metabolomics.Nucleic Acids Res. 2024 Jan 5;52(D1):D654-D662. doi: 10.1093/nar/gkad1041. Nucleic Acids Res. 2024. PMID: 37962386 Free PMC article.
-
GINv2.0: a comprehensive topological network integrating molecular interactions from multiple knowledge bases.NPJ Syst Biol Appl. 2024 Jan 13;10(1):4. doi: 10.1038/s41540-024-00330-y. NPJ Syst Biol Appl. 2024. PMID: 38218959 Free PMC article.
References
Publication types
MeSH terms
Grants and funding
LinkOut - more resources
Full Text Sources
