. 2021 Sep 7;17(9):e1009365.
doi: 10.1371/journal.pcbi.1009365. eCollection 2021 Sep.

Ascension of Chlamydia is moderated by uterine peristalsis and the neutrophil response to infection

Affiliations

Ascension of Chlamydia is moderated by uterine peristalsis and the neutrophil response to infection

Torrington Callan et al. PLoS Comput Biol. .

Abstract

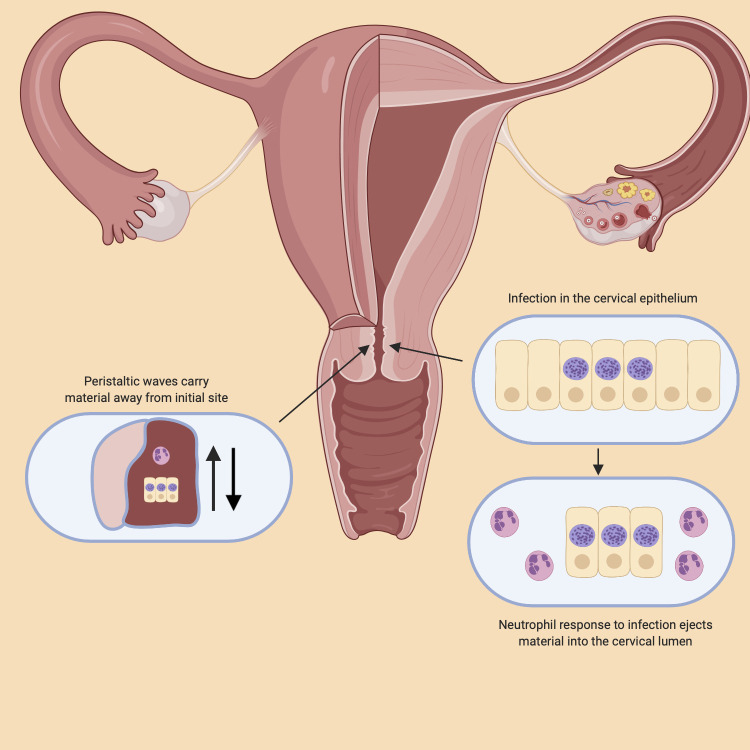
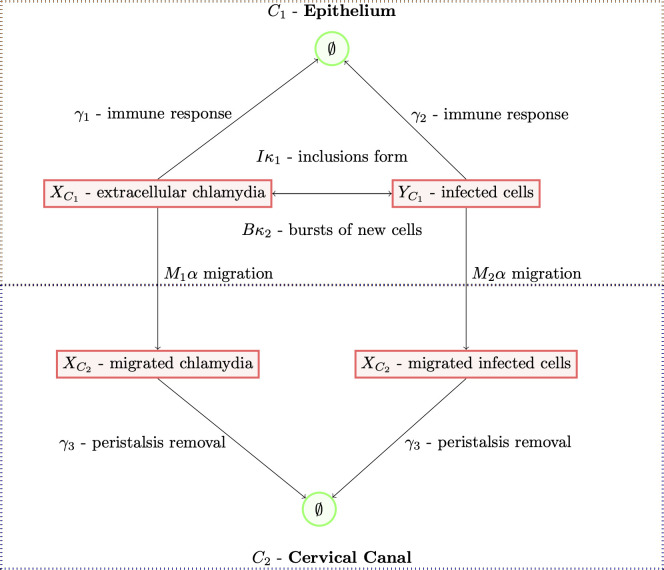
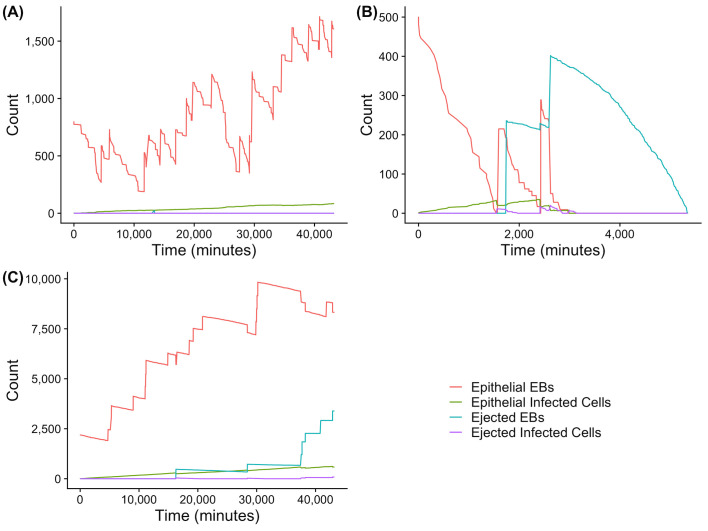
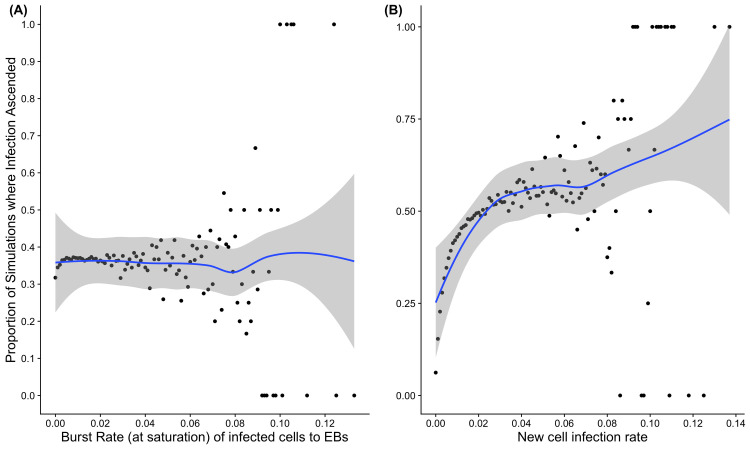
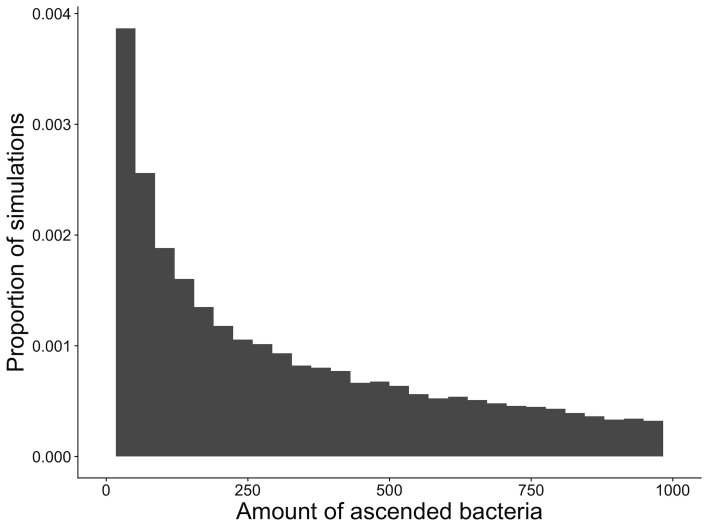
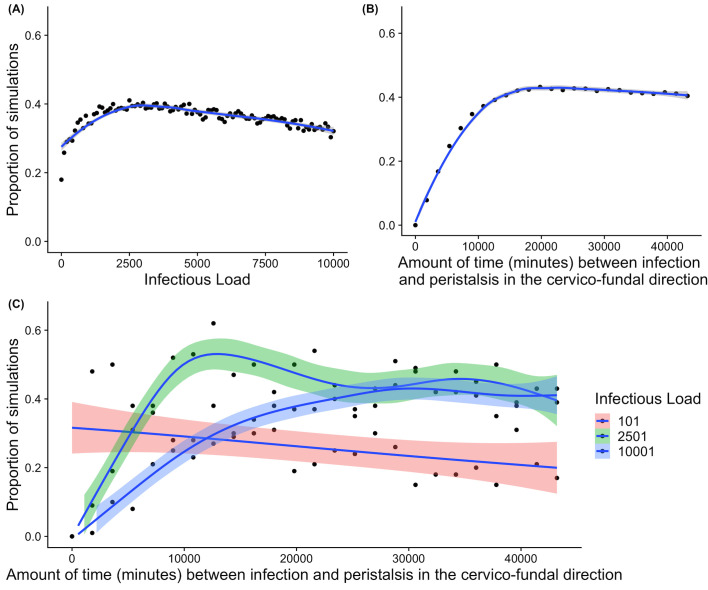
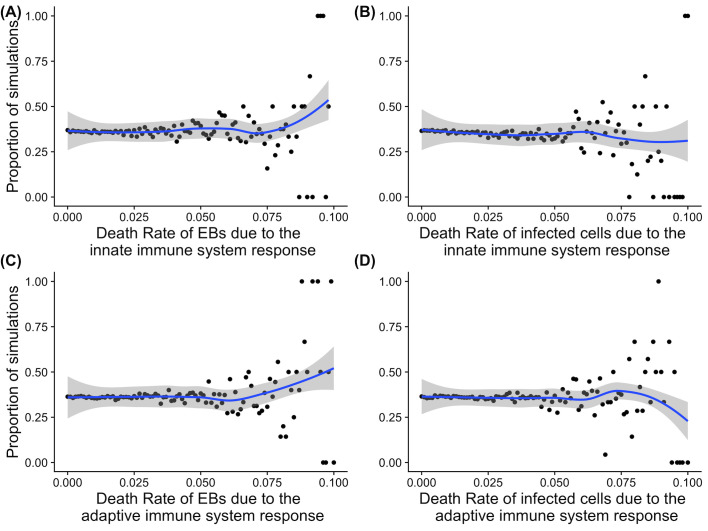
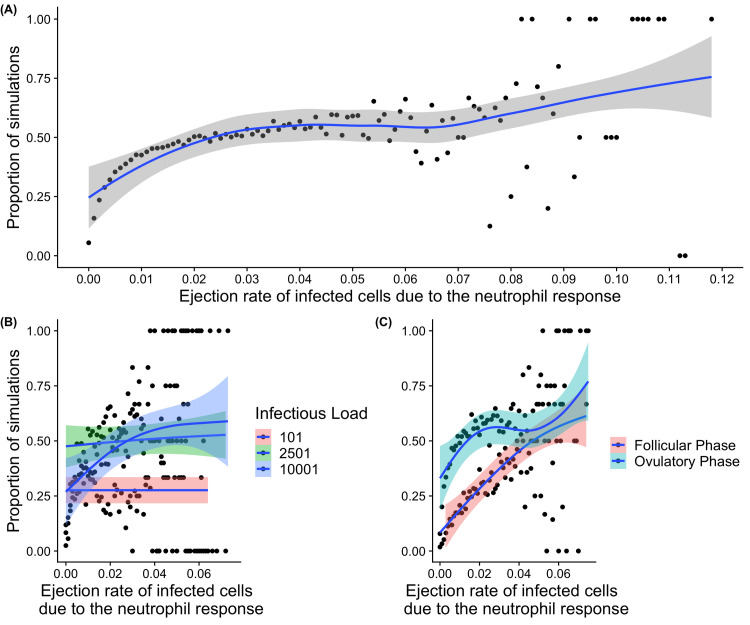
Chlamydia trachomatis is a common sexually transmitted infection that is associated with a range of serious reproductive tract sequelae including in women Pelvic Inflammatory Disease (PID), tubal factor infertility, and ectopic pregnancy. Ascension of the pathogen beyond the cervix and into the upper reproductive tract is thought to be necessary for these pathologies. However, Chlamydia trachomatis does not encode a mechanism for movement on its genome, and so the processes that facilitate ascension have not been elucidated. Here, we evaluate the factors that may influence chlamydial ascension in women. We constructed a mathematical model based on a set of stochastic dynamics to elucidate the moderating factors that might influence ascension of infections in the first month of an infection. In the simulations conducted from the stochastic model, 36% of infections ascended, but only 9% had more than 1000 bacteria ascend. The results of the simulations indicated that infectious load and the peristaltic contractions moderate ascension and are inter-related in impact. Smaller initial loads were much more likely to ascend. Ascension was found to be dependent on the neutrophil response. Overall, our results indicate that infectious load, menstrual cycle timing, and the neutrophil response are critical factors in chlamydial ascension in women.


Conflict of interest statement

The authors have declared that no competing interests exist.

Figures

Fig 1
Fig 1. The proposed model of chlamydial ascension.
The figure depicts the female reproductive tract and elements that were evaluated in their moderating impact of ascension. The factors evaluated were the chlamydial cell cycle, the host and pathogen interactions including the immune system response and the ejection of infectious material from the epithelium, and the effect of peristalsis in moving material either away or towards the upper reproductive tract depending on the stage of the menstrual cycle. Fig 1 was created with BioRender.com.
Fig 2
Fig 2. Flow diagram of the model.
The figure outlines each component of the model that are incorporated in the analysis. Extracellular chlamydia can form inclusions to created new infected cells, and infected cells can burst to create new extracellular chlamydia. Both extracellular chlamydia and infected cells can be removed by the immune system, and be migrated to the cervical canal via the neutrophil response. In the cervical canal, infected cells can burst to create new chlamydia, but not vice versa. Extracellular Chlamydia and infected cells in the cervical canal be removed via peristalsis. The parameters of each component from the model are drawn from distributions that represent host and pathogen specific factors. The impact of each factor is represented as the proportion of simulations where the infection ascended for each parameter in the model in the following figures, out of a total of 252,500 simulations that were run.
Fig 3
Fig 3. Graphical representation of the counts for each status of elementary bodies and cells in the model under three distinct scenarios over time.
The figure shows the outputs of simulated sample paths of the model where factors have been modified. Each figure is a demonstration showing selected representations from the 252, 500 simulations that were conducted. (A) An example output from the model that starter with a load in the range of 801 EBs. (B) An example output of the model starting with a low initial load of 501 EBs. (C) An output that commended with a higher load than A and B of 2201 EBs. Each figure shows a graphical representation of count of each cell/chlamydia form represented on the y axis with the actual counts of Chlamydia trachomatis in the different forms indicated by the coloured lines (see figure legend bottom right), and time in minutes (x axis).
Fig 4
Fig 4
Graphical representation of the proportion of ascension events in the simulations, as influenced by burst rate (A) and new cell infection rate (B).. (A) The relationship between burst rate (in cells per minute) and the simulated chances of ascension. (B) The relationship between new cell infection rate (cells per minute). The y axis shows the proportion of simulations where infections ascended (out of 252, 500 simulations conducted), and x axis shows the different parameters values of burst rate and new cell infection rate). Each dot represents simulations at a particular parameter value. These are simulated over a range of infectious loads (10 simulations at each value of infectious load from 1 to 10001 in steps of 100. The blue line represents a loess fit of ascension proportion against each parameter value, where shading is the 95% confidence interval of the fit.
Fig 5
Fig 5. Histogram of the proportion of simulations leading to ascension of bacteria, and the amount of bacteria predicted by the model to ascend.
The amount of bacteria predicted to ascend (x axis) and the proportions of each simulation that resulted in ascension (y axis) from 252, 500 simulations of the model. These are simulated over a range of infectious loads (10 simulations at each value of infectious load from 1 to 10001 in steps of 100.
Fig 6
Fig 6
Graphical summary of the proportions of simulations where ascension occurred and role of load (A), peristalsis (B), and both (C). (A) Simulations analysing the impact of infectious load (the count of initial bacteria) on the the chances of ascension. (B) The time (in minutes) prior to the onset of peristaltic contractions in the cervico-fundal direction and chances of ascension. (C) The relationship between infectious load, timing of infection with respect to peristaltic contractions, and the chances of ascension. Each figure shows the proportion of simulations from the model where the infection ascended (proportion of representations from 252, 500 simulations) on the y axis, where the x axis represents the factor being modified (A. infectious load, B. peristalsis, C. peristalsis and grouped by infectious load). These are simulated over a range of infectious loads (10 simulations at each value of infectious load from 1 to 10001 in steps of 100. The blue lines represent a loess regression against the proportion of simulations resulting in ascension, and the shaded regions are 95% confidence intervals of the regression. Dots represent simulations at a particular parameter value.
Fig 7
Fig 7. Graphical representation of the impact of the immune response and subsequent chlamydial death rate on the proportion of simulations that result in ascension.
The proportion of simulations where the infection ascends was computed (total 252,500 simulations represented in each figure). Each figure shows the proportion of simulations where the infection ascended on the y axis and on the x axis the death rate of EBs and infected cells due to different components of the immune system (represented as broad scales of response). (A) Impact of EB death rate due to the innate immune system on the proportion ascending, (B) Impact of infected cells death rate due to the innate immune system on the proportion ascending, (C) Impact of EB death rate due to the adaptive immune system on the proportion ascending, and (D) Impact of infected cells death rate due to the adaptive immune system on the proportion ascending. These are simulated over a range of infectious loads (10 simulations at each value of infectious load from 1 to 10001 in steps of 100.The solid blue line indicates a loess fit to the proportion of simulations the ascended and the shaded area represents 95% Confidence Intervals of the loess regression. Dots represent simulations at a particular parameter value from a total of 252, 500.
Fig 8
Fig 8. Graphical representation of the proportion of infections that ascend in the simulations from the model and the role of the neutrophil response.
The figure shows the proportions of simulations (total of 252, 200 conducted for each instance) where infection was predicted to ascend (y axis). The ejection rate (movement to the cervix from the epithelium) of infected cells related to the neutrophil response (x axis). (A) Ascension and the ejection rate due to the neutrophil response. (B) Impact of initial infectious load (pink represents a low infectious load of 101, green a moderate infectious load of 2501, and blue 10,001). (C) Time of infection relative to the menstrual cycle (follicular phase represented by pink, and ovulatory phase represented by blue). These are simulated over a range of infectious loads (10 simulations at each value of infectious load from 1 to 10001 in steps of 100. In each graph the solid blue line indicates a loess fit to proportion of simulations resulting in ascension, where the shaded area shows is the 95% confidence interval. Each dots are represents simulations at a particular parameter value, from a total of 252,500.

Similar articles

Cited by

References

    1. Oakeshott P, Kerry S, Aghaizu A, Atherton H, Hay S, Taylor-Robinson D, et al.. Randomised controlled trial of screening for Chlamydia trachomatis to prevent pelvic inflammatory disease: the POPI (prevention of pelvic infection) trial. BMJ. 2010;340. doi: 10.1136/bmj.c1642 - DOI - PMC - PubMed
    1. Low N, Egger M, Sterne JAC, Harbord RM, Ibrahim F, Lindblom B, et al.. Incidence of severe reproductive tract complications associated with diagnosed genital chlamydial infection: the Uppsala Women’s Cohort Study. Sex Transm Infect. 2006;82(3):212–8. doi: 10.1136/sti.2005.017186 - DOI - PMC - PubMed
    1. Westrom L, Joesoef R, Reynolds G, Hagdu A, Thompson SE. Pelvic Inflammatory Disease and Fertility. Sexually Transmitted Diseases. 1992;19(4):185–92. - PubMed
    1. Davies B, Turner KME, Frølund M, Ward H, May MT, Rasmussen S, et al.. Risk of reproductive complications following chlamydia testing: a population-based retrospective cohort study in Denmark. The Lancet Infectious Diseases. 2016;16(9):1057–64. doi: 10.1016/S1473-3099(16)30092-5 - DOI - PubMed
    1. Stacey C, Munday P, Thomas B, Gilchrist C, Taylor-Robinson D, Beard R. Chlamydia trachomatis in the fallopian tubes of women without laparoscopic evidence of salpingitis. International Journal of Gynecology & Obstetrics. 1991;35(3):287. - PubMed

Publication types

MeSH terms