. 2021 Sep 7;17(9):e1009347.
doi: 10.1371/journal.pcbi.1009347. eCollection 2021 Sep.

Improved estimation of time-varying reproduction numbers at low case incidence and between epidemic waves

Affiliations

Improved estimation of time-varying reproduction numbers at low case incidence and between epidemic waves

Kris V Parag. PLoS Comput Biol. .

Abstract

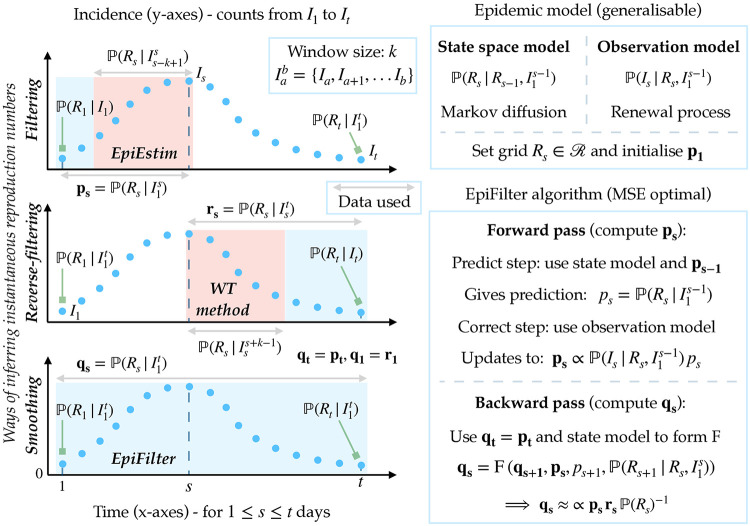
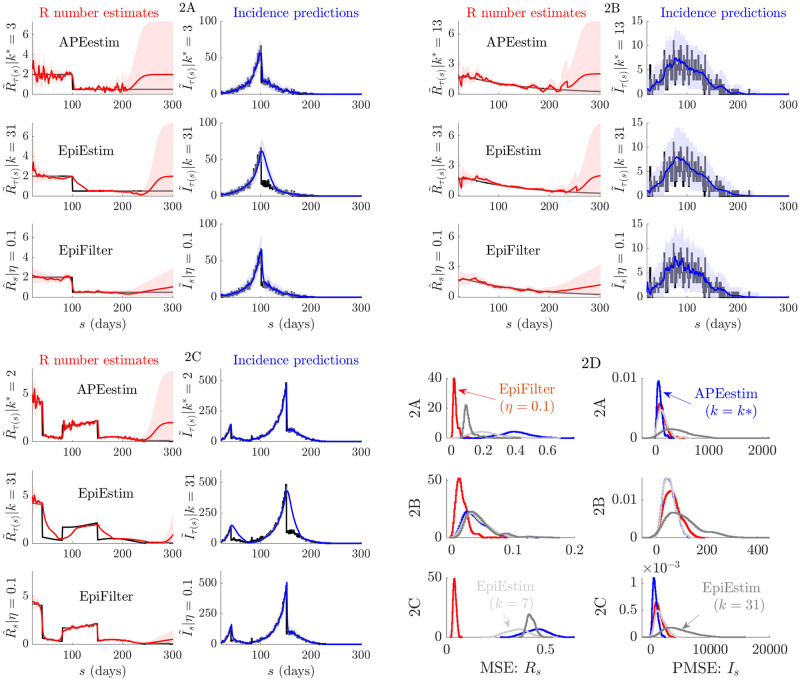
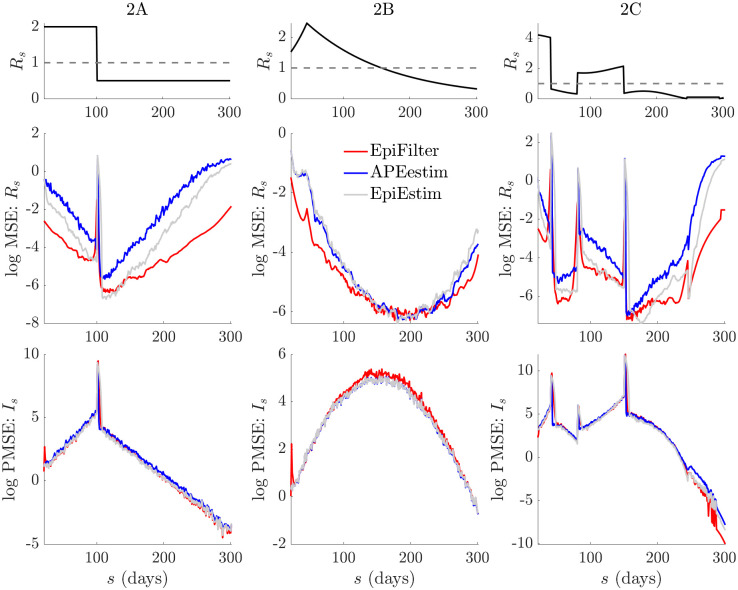
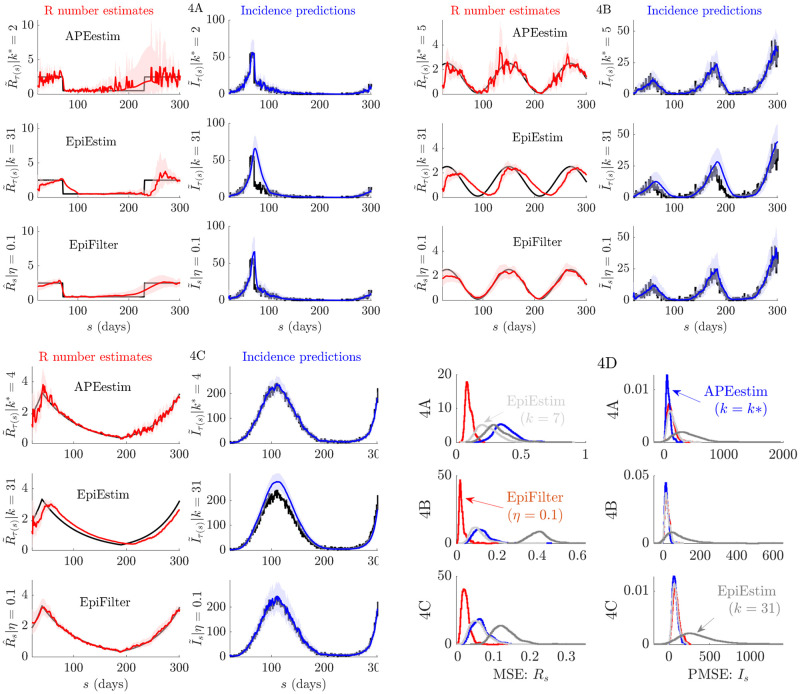
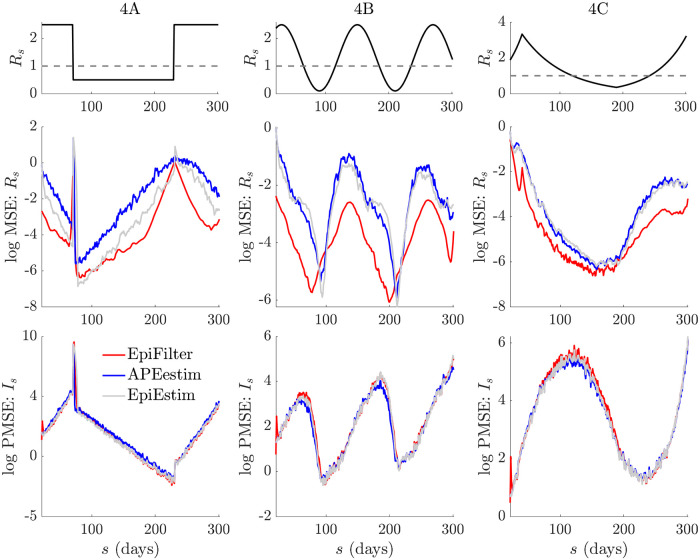
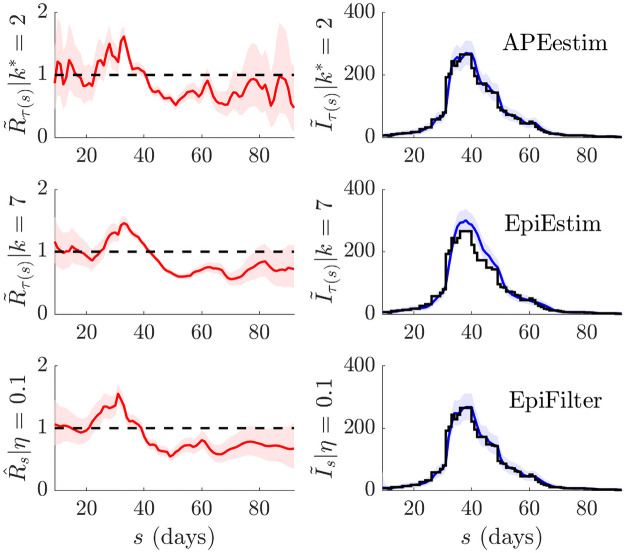
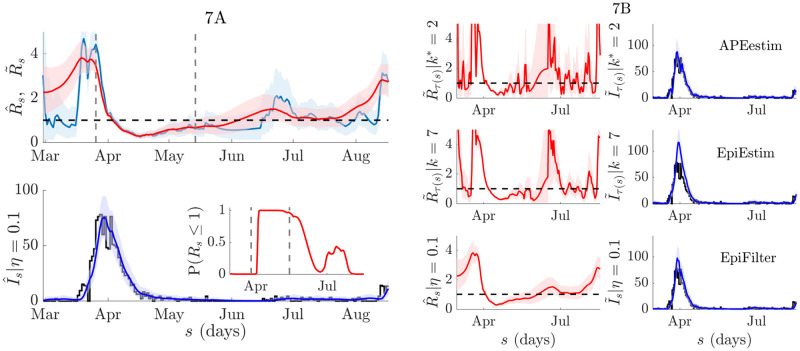
We construct a recursive Bayesian smoother, termed EpiFilter, for estimating the effective reproduction number, R, from the incidence of an infectious disease in real time and retrospectively. Our approach borrows from Kalman filtering theory, is quick and easy to compute, generalisable, deterministic and unlike many current methods, requires no change-point or window size assumptions. We model R as a flexible, hidden Markov state process and exactly solve forward-backward algorithms, to derive R estimates that incorporate all available incidence information. This unifies and extends two popular methods, EpiEstim, which considers past incidence, and the Wallinga-Teunis method, which looks forward in time. We find that this combination of maximising information and minimising assumptions significantly reduces the bias and variance of R estimates. Moreover, these properties make EpiFilter more statistically robust in periods of low incidence, where several existing methods can become destabilised. As a result, EpiFilter offers improved inference of time-varying transmission patterns that are advantageous for assessing the risk of upcoming waves of infection or the influence of interventions, in real time and at various spatial scales.


Conflict of interest statement

The authors have declared that no competing interests exist.

Figures

Fig 1
Fig 1. EpiFilter algorithm and relationship to other methods.
In the left panels we consider three ways of inferring the instantaneous or effective reproduction number at time s, Rs, from the incidence curve, I1t (blue dots). The filtering solution produces the posterior distribution ps from all data prior to time s. EpiEstim approximates this solution by using the subset of data in a window of size k into the past. Reverse-filtering considers the complementary part of the incidence curve, leading to rs, which utilises data beyond s. The WT method, with future window k, approximates this type of solution. Smoothing uses all information from I1t to generate qs, which is precisely computed by EpiFilter. Blue windows show the portions of I1t that inform on Rs for each of ps, rs and qs while red windows highlight the subsets used by EpiEstim and the WT method. Double arrows indicate data used for constructing various posterior distributions, while square arrows pinpoint instances of those distributions at the edges of I1t. In the right panels we summarise the construction of EpiFilter. We outline the main assumptions (the model box) and computations (the algorithm box) necessary for realising EpiFilter, which allow us to obtain the most informative and minimum mean squared error (MSE) smoothing posterior distribution qs. See the main text for the specific equations employed in our implementation [14].
Fig 2
Fig 2. Small or waning epidemics.
We compare reproduction number estimates (R˜τ(s) or R^s) and one-step-ahead incidence predictions (I˜τ(s) or I˜s) from APEestim with optimal window k*, EpiEstim with window k and EpiFilter with state noise η. We simulate 200 epidemics with low daily case numbers or long tails (long sequences of zero cases) using the standard renewal model (Eq (1)) for three scenarios, representative examples of which are given in A-C. The true Rs and Is are in black. All mean estimates or predictions are in red and blue with 95% credible intervals. APEestim and EpiEstim use a Gam(1, 2) prior distribution and EpiFilter a grid with m = 2000, Rmin = 0.01 and Rmax = 10. In D we provide statistics of the MSE of these estimates (relative to Rs) and the PMSE of these predictions (relative to Is) for all 200 runs. We find that EpiFilter is more robust to small incidence (better uncertainty), whereas the other approaches can quickly decay to their prior distribution. It achieves significantly smaller MSE (2–10 fold reductions) and comparable PMSE to APEestim (which is optimised for prediction).
Fig 3
Fig 3. Temporal statistics of small or waning epidemics.
We expand on the results from Fig 2D by decomposing the MSE and one-step-ahead PMSE statistics across the 200 simulated trajectories for every scenario in Fig 2. We do not consider the k = 31 EpiEstim example given its poor performance. We present the k = 7 case, which is the generally recommended EpiEstim setting. We observe that EpiFilter significantly improves on MSE throughout the epidemic trajectory (and not only in periods of low incidence) while maintaining comparable prediction accuracies. Coverage statistics for these scenarios, which are given in Fig C of the S1 Appendix, confirm that EpiFilter also consistently contains the true Rs and Is values within its credible intervals.
Fig 4
Fig 4. Epidemics with multiple waves.
We compare reproduction number estimates (R˜τ(s) or R^s) and one-step-ahead incidence predictions (I˜τ(s) or I˜s) from APEestim with optimal window k*, EpiEstim with window k and EpiFilter with state noise η. We simulate 200 epidemics with multiple waves of infection using the standard renewal model (Eq (1)) for three scenarios, representative examples of which are given in A-C. The true Rs and Is are in black. All mean estimates or predictions are in red and blue with 95% equal tailed credible intervals. APEestim and EpiEstim use a Gam(1, 2) prior distribution and EpiFilter a grid with m = 2000, Rmin = 0.01 and Rmax = 10. In D we provide statistics of the MSE of these estimates (relative to Rs) and the PMSE of these predictions (relative to Is) for all 200 runs. We find EpiFilter is best able to negotiate troughs between epidemic peaks and hence infer resurging infectious dynamics, achieving significantly smaller MSE (2–10 fold reductions) and comparable PMSE to APEestim (which is optimised for prediction).
Fig 5
Fig 5. Temporal statistics of epidemics with multiple waves.
We expand on the results from Fig 4D by decomposing the MSE and one-step-ahead PMSE statistics across the 200 simulated trajectories for every scenario in Fig 4. We do not consider the k = 31 EpiEstim example given its poor performance. We present the k = 7 case, which is the generally recommended EpiEstim setting. We observe that EpiFilter significantly improves on MSE throughout the resurgent epidemic trajectory (whether incidence is small or large) while maintaining comparable prediction accuracies. Coverage statistics for these scenarios, which are given in Fig D of the S1 Appendix, confirm that EpiFilter consistently contains the true Rs and Is values within its credible intervals.
Fig 6
Fig 6. H1N1 influenza transmission in Baltimore (1918).
We compare APEestim (top), EpiEstim with recommended weekly window (middle) (both with Gam(1, 2) prior distribution) and EpiFilter (with m = 2000, η = 0.1, Rmin = 0.01 and Rmax = 10) on the H1N1 influenza dataset from [42]. We use a 5-day moving average filter, as in [42], to ameliorate known sampling biases. Estimates of reproduction numbers, Rs, and corresponding 95% equal tailed credible intervals are in red. One-step-ahead predictions of incidence, Is, (with 95% credible intervals) are in blue with the actual incidence in black. We find that EpiFilter combines the benefits of APEestim and EpiEstim, achieving both good estimates and predictions.
Fig 7
Fig 7. COVID-19 transmission in New Zealand.
We compute smoothed and filtered reproduction number estimates, R^s (red) and R˜s (blue) respectively, from the COVID-19 incidence curve for New Zealand (available at [43]) in the left panels. We use EpiFilter with m = 2000, η = 0.1, Rmin = 0.01 and Rmax = 10 with a uniform prior distribution over the grid R. The top of 7A shows conditional mean estimates and 95% credible intervals for R^s (red) and R˜s (blue). Vertical lines indicate the start and end of lockdown, a major intervention that was employed to halt transmission. The additional ‘future’ information used in smoothing has a notable effect. The bottom of 7A provides smoothed one-step-ahead predictions I^s (blue, with 95% credible intervals) of the actual reported cases Is (black). The inset gives the estimated probability of Rs ≤ 1. We observe a clear trend of subcritical transmission that eventually seeds a second wave by August. In 7B we compare EpiFilter with EpiEstim (using weekly windows) and APEestim (both with Gam(1, 2) priors) with all left subfigures presenting Rs estimates and right ones providing filtered Is predictions. We observe that both APEestim and EpiEstim lead to largely unusable estimates that mask transmission trends, in sharp contrast to EpiFilter.

References

    1. Fraser C. Estimating Individual and Household Reproduction Numbers in an Emerging Epidemic. PLOS One. 2007;8:e758. doi: 10.1371/journal.pone.0000758 - DOI - PMC - PubMed
    1. Wallinga J, Teunis P. Different Epidemic Curves for Severe Acute Respiratory Syndrome Reveal Similar Impacts of Control Measures. Am J Epidemiol. 2004;160(6):509–16. doi: 10.1093/aje/kwh255 - DOI - PMC - PubMed
    1. Nishiura H, Chowell G. The Effective Reproduction Number as a Prelude to Statistical Estimation of Time-Dependent Epidemic Trends. In: Mathematical and statistical estimation approaches in epidemiology. Springer; 2009. p. 103–21.
    1. Anderson R, May R. Infectious diseases of humans: dynamics and control. Oxford University Press; 1991.
    1. Cauchemez S, Boelle P, Thomas G, Valleron A. Estimating in Real Time the Efficacy of Measures to Control Emerging Communicable Diseases. Am J Epidemiol. 2006;164(6):591–7. doi: 10.1093/aje/kwj274 - DOI - PubMed

Publication types

MeSH terms