

Pneumonia detection in chest X-ray images using an ensemble of deep learning models
- PMID: 34492046
- PMCID: PMC8423280
- DOI: 10.1371/journal.pone.0256630
Pneumonia detection in chest X-ray images using an ensemble of deep learning models
Abstract
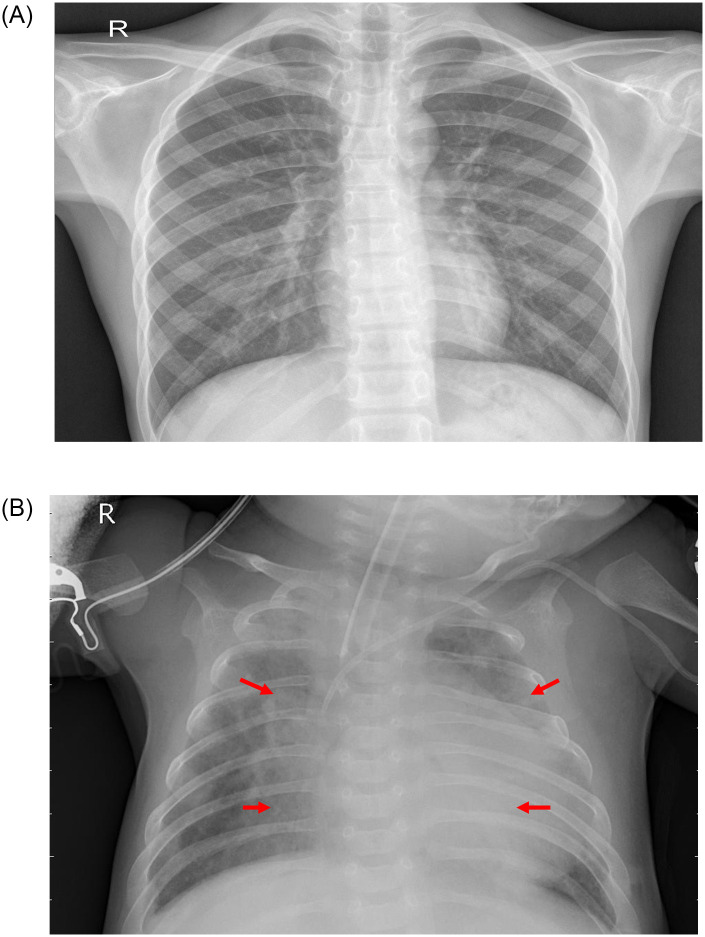
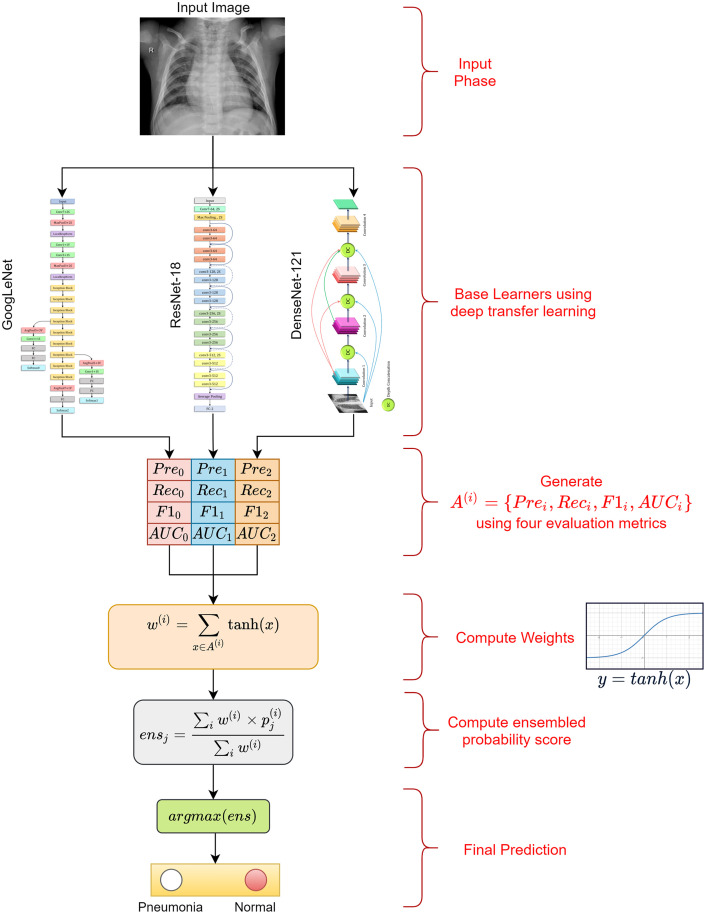
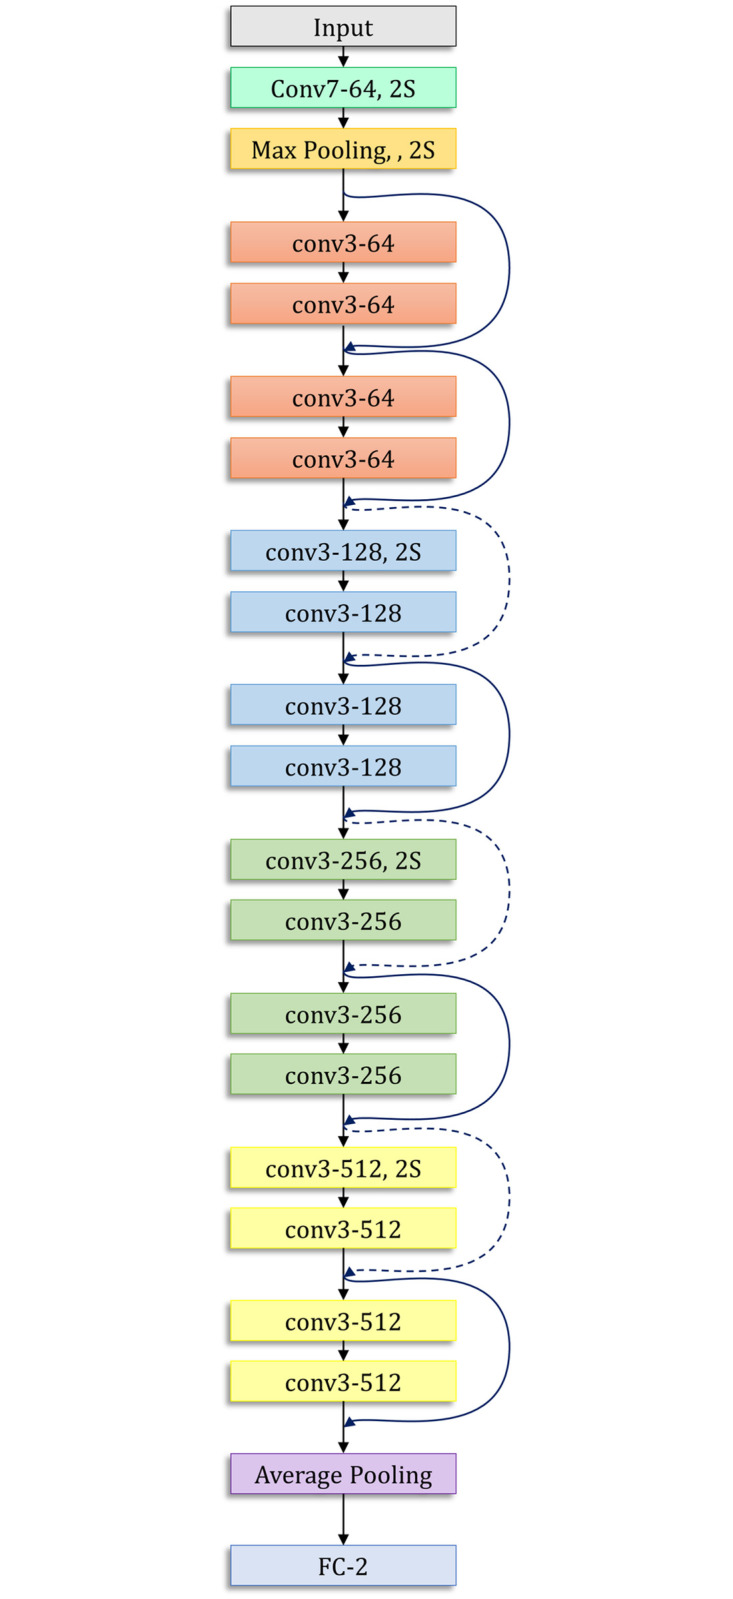
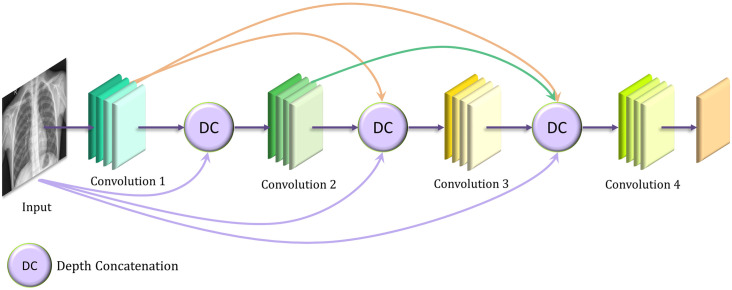
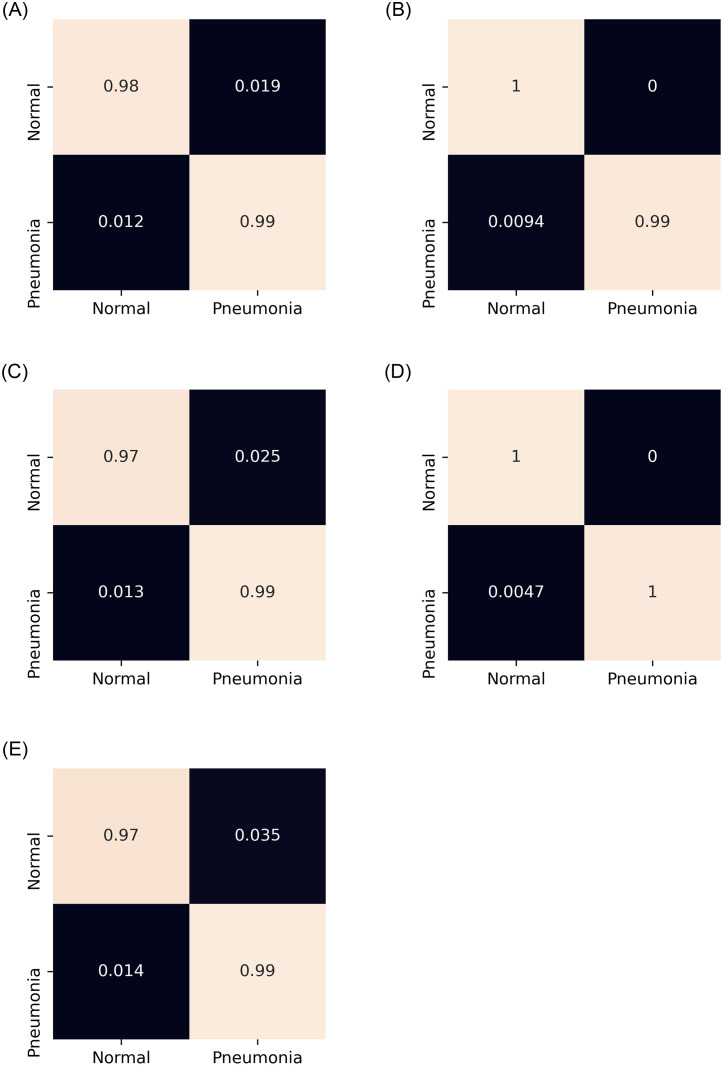
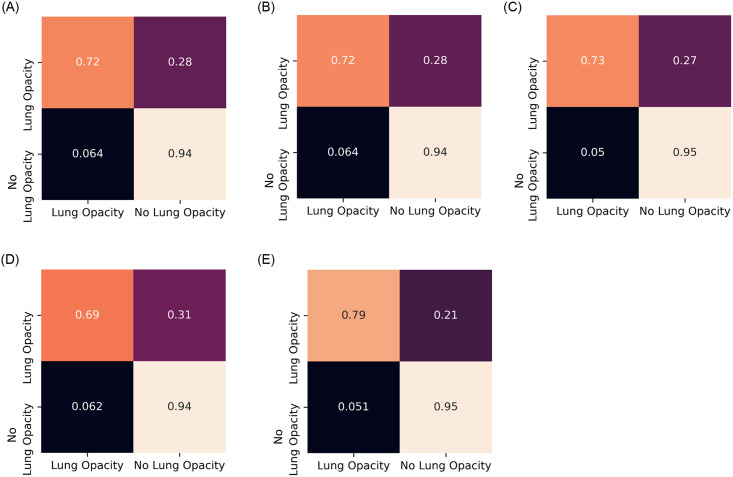
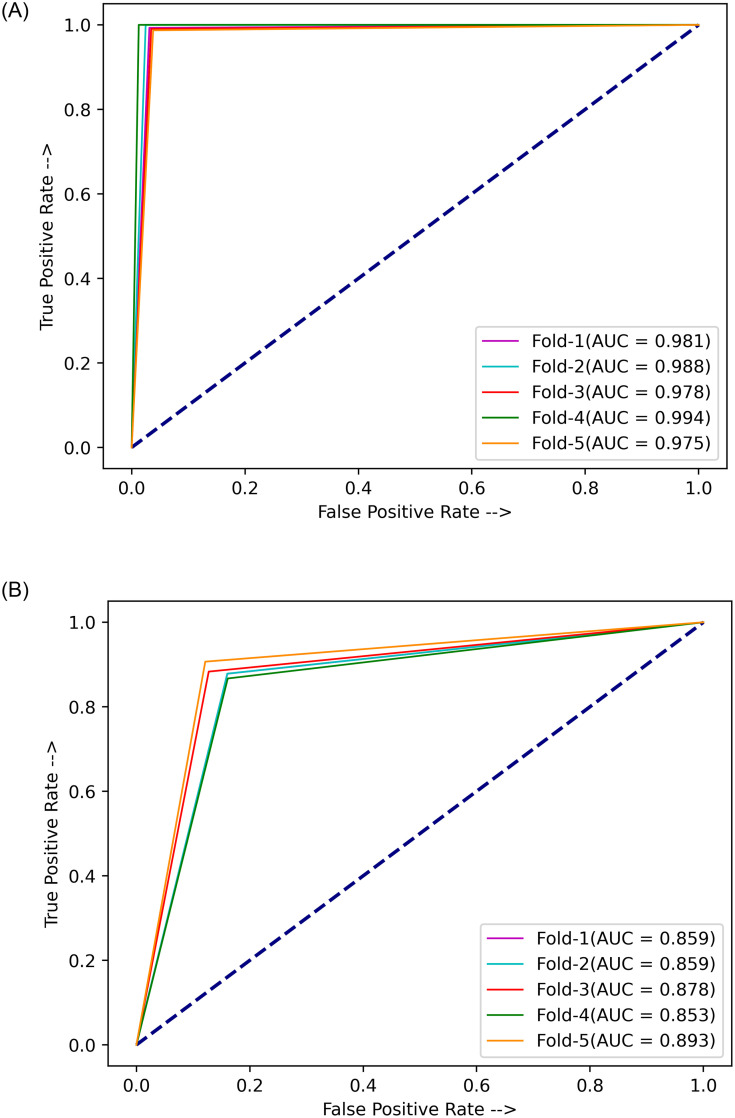
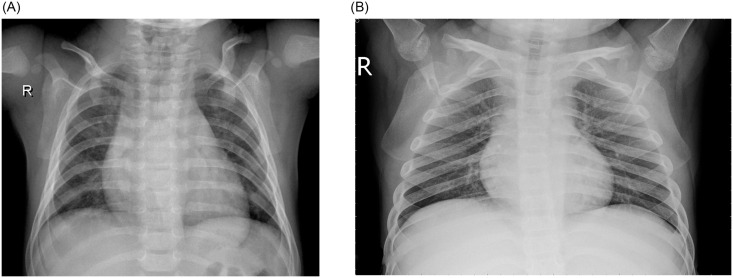
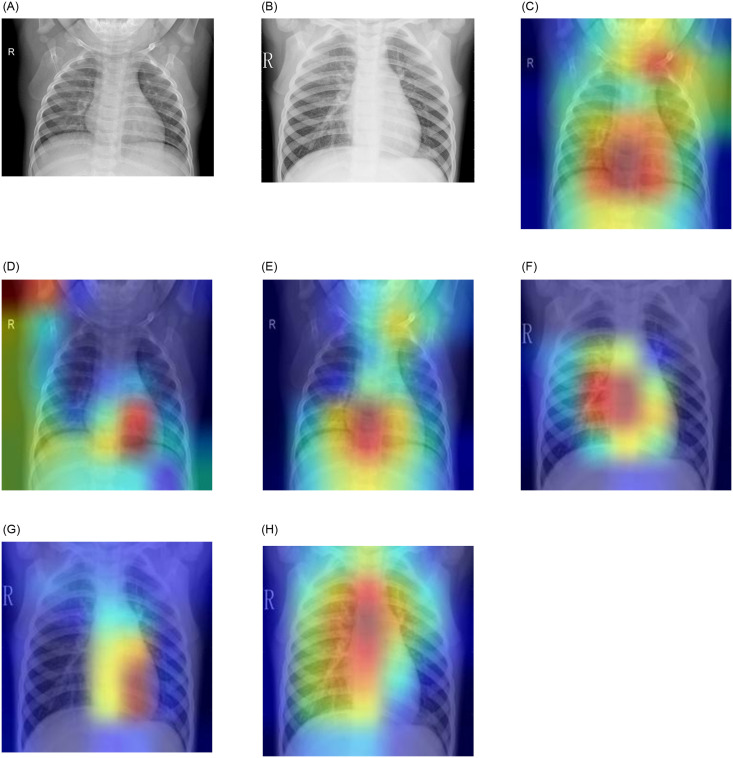
Pneumonia is a respiratory infection caused by bacteria or viruses; it affects many individuals, especially in developing and underdeveloped nations, where high levels of pollution, unhygienic living conditions, and overcrowding are relatively common, together with inadequate medical infrastructure. Pneumonia causes pleural effusion, a condition in which fluids fill the lung, causing respiratory difficulty. Early diagnosis of pneumonia is crucial to ensure curative treatment and increase survival rates. Chest X-ray imaging is the most frequently used method for diagnosing pneumonia. However, the examination of chest X-rays is a challenging task and is prone to subjective variability. In this study, we developed a computer-aided diagnosis system for automatic pneumonia detection using chest X-ray images. We employed deep transfer learning to handle the scarcity of available data and designed an ensemble of three convolutional neural network models: GoogLeNet, ResNet-18, and DenseNet-121. A weighted average ensemble technique was adopted, wherein the weights assigned to the base learners were determined using a novel approach. The scores of four standard evaluation metrics, precision, recall, f1-score, and the area under the curve, are fused to form the weight vector, which in studies in the literature was frequently set experimentally, a method that is prone to error. The proposed approach was evaluated on two publicly available pneumonia X-ray datasets, provided by Kermany et al. and the Radiological Society of North America (RSNA), respectively, using a five-fold cross-validation scheme. The proposed method achieved accuracy rates of 98.81% and 86.85% and sensitivity rates of 98.80% and 87.02% on the Kermany and RSNA datasets, respectively. The results were superior to those of state-of-the-art methods and our method performed better than the widely used ensemble techniques. Statistical analyses on the datasets using McNemar's and ANOVA tests showed the robustness of the approach. The codes for the proposed work are available at https://github.com/Rohit-Kundu/Ensemble-Pneumonia-Detection.
Conflict of interest statement
The authors have declared that no competing interests exist.
Figures
Similar articles
-
A hybrid explainable ensemble transformer encoder for pneumonia identification from chest X-ray images.J Adv Res. 2023 Jun;48:191-211. doi: 10.1016/j.jare.2022.08.021. Epub 2022 Sep 7. J Adv Res. 2023. PMID: 36084812 Free PMC article.
-
FLANNEL (Focal Loss bAsed Neural Network EnsembLe) for COVID-19 detection.J Am Med Inform Assoc. 2021 Mar 1;28(3):444-452. doi: 10.1093/jamia/ocaa280. J Am Med Inform Assoc. 2021. PMID: 33125051 Free PMC article.
-
A Deep Learning Model for Diagnosing COVID-19 and Pneumonia through X-ray.Curr Med Imaging. 2023;19(4):333-346. doi: 10.2174/1573405618666220610093740. Curr Med Imaging. 2023. PMID: 35692156
-
Detection of COVID-19 from CT and Chest X-ray Images Using Deep Learning Models.Ann Biomed Eng. 2022 Jul;50(7):825-835. doi: 10.1007/s10439-022-02958-5. Epub 2022 Apr 12. Ann Biomed Eng. 2022. PMID: 35415768 Free PMC article. Review.
-
Deep learning for report generation on chest X-ray images.Comput Med Imaging Graph. 2024 Jan;111:102320. doi: 10.1016/j.compmedimag.2023.102320. Epub 2023 Dec 14. Comput Med Imaging Graph. 2024. PMID: 38134726 Review.
Cited by
-
Detection of COVID-19 using deep learning on x-ray lung images.PeerJ Comput Sci. 2022 Sep 7;8:e1082. doi: 10.7717/peerj-cs.1082. eCollection 2022. PeerJ Comput Sci. 2022. PMID: 36262134 Free PMC article.
-
In Vivo Prediction of Breast Muscle Weight in Broiler Chickens Using X-ray Images Based on Deep Learning and Machine Learning.Animals (Basel). 2024 Feb 16;14(4):628. doi: 10.3390/ani14040628. Animals (Basel). 2024. PMID: 38396595 Free PMC article.
-
Chest X-Ray Images to Differentiate COVID-19 from Pneumonia with Artificial Intelligence Techniques.Int J Biomed Imaging. 2022 Dec 22;2022:5318447. doi: 10.1155/2022/5318447. eCollection 2022. Int J Biomed Imaging. 2022. PMID: 36588667 Free PMC article.
-
COVID-19 detection from lung CT-Scans using a fuzzy integral-based CNN ensemble.Comput Biol Med. 2021 Nov;138:104895. doi: 10.1016/j.compbiomed.2021.104895. Epub 2021 Oct 1. Comput Biol Med. 2021. PMID: 34649147 Free PMC article.
-
Improving diagnosis accuracy with an intelligent image retrieval system for lung pathologies detection: a features extractor approach.Sci Rep. 2023 Oct 3;13(1):16619. doi: 10.1038/s41598-023-42366-w. Sci Rep. 2023. PMID: 37789095 Free PMC article.
References
-
- WHO Pneumonia. World Health Organization. (2019), https://www.who.int/news-room/fact-sheets/detail/pneumonia
-
- Williams G., Macaskill P., Kerr M., Fitzgerald D., Isaacs D., Codarini M., et al.. Variability and accuracy in interpretation of consolidation on chest radiography for diagnosing pneumonia in children under 5 years of age. Pediatric Pulmonology. 48, 1195–1200 (2013) doi: 10.1002/ppul.22806 - DOI - PubMed
-
- Kermany D., Zhang K. & Goldbaum M. Labeled Optical Coherence Tomography (OCT) and Chest X-Ray Images for Classification. (Mendeley,2018)
Publication types
MeSH terms
LinkOut - more resources
Full Text Sources
Medical
