. 2021 Sep 7;16(9):e0256708.
doi: 10.1371/journal.pone.0256708. eCollection 2021.

Dynamin inhibition causes context-dependent cell death of leukemia and lymphoma cells

Affiliations

Dynamin inhibition causes context-dependent cell death of leukemia and lymphoma cells

Christopher von Beek et al. PLoS One. .

Abstract

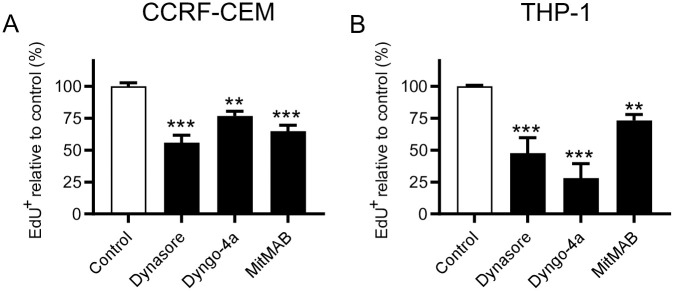
Current chemotherapy for treatment of pediatric acute leukemia, although generally successful, is still a matter of concern due to treatment resistance, relapses and life-long side effects for a subset of patients. Inhibition of dynamin, a GTPase involved in clathrin-mediated endocytosis and regulation of the cell cycle, has been proposed as a potential anti-cancer regimen, but the effects of dynamin inhibition on leukemia cells has not been extensively addressed. Here we adopted single cell and whole-population analysis by flow cytometry and live imaging, to assess the effect of dynamin inhibition (Dynasore, Dyngo-4a, MitMAB) on pediatric acute leukemia cell lines (CCRF-CEM and THP-1), human bone marrow biopsies from patients diagnosed with acute lymphoblastic leukemia (ALL), as well as in a model of lymphoma (EL4)-induced tumor growth in mice. All inhibitors suppressed proliferation and induced pronounced caspase-dependent apoptotic cell death in CCRF-CEM and THP-1 cell lines. However, the inhibitors showed no effect on bone marrow biopsies, and did not prevent EL4-induced tumor formation in mice. We conclude that dynamin inhibition affects highly proliferating human leukemia cells. These findings form a basis for evaluation of the potential, and constraints, of employing dynamin inhibition in treatment strategies against leukemia and other malignancies.


Conflict of interest statement

The authors have declared that no competing interests exist.

Figures

Fig 1
Fig 1. Dynamin inhibitors decrease the viability of acute leukemia cells.
CCRF-CEM (A, D, G;), THP-1 (B, E, H) or human PBMCs (C, F, I) (0.15 x 10⁶ cells/ml) were cultured for the time points indicated with the given concentrations of Dynasore (A-C), Dyngo-4a (D-F) or MitMAB (G-I). Viability was assessed with PrestoBlue and was normalized to untreated control (0 μM) groups. Data are given as mean + SEM pooled from 5–9 biological replicates. Two-way ANOVA was used for statistical testing with Dunnett’s posthoc test in order to compare each treated group with the control at each time point.
Fig 2
Fig 2. Dynamin inhibition leads to apoptosis of leukemia cells.
(A) Gating strategy. (B-G) 0.15 x 10⁶ CCRF-CEM (B, D, F) or THP-1 (C, E, G) cells/ml were cultured for 24 h with the indicated concentrations of Dynasore (B-C), Dyngo-4a (D-E) or MitMAB (F-G), followed by staining with Annexin V and DRAQ7. Percentage of viable (Annexin V-/DRAQ7-), apoptotic (Annexin V+/DRAQ7-) and late apoptotic/necrotic (Annexin V+/DRAQ7+) was determined by flow cytometry. Data are given as mean + SEM, pooled from at least 6 biological replicates. Two-way ANOVA was used for statistical testing with Dunnett’s posthoc test (Sidak for MitMAB experiments due to fewer groups), comparing the treated groups with the controls.
Fig 3
Fig 3. Dynamin inhibition reduces the proliferation of leukemia cells.
0.15 x 10⁶ of CCRF-CEM (A) or THP-1 (B) cells/ml were cultured for 24 h (MitMAB) or 48 h (Dynasore and Dyngo-4a) with 40 μM Dynasore, 10 μM Dyngo-4a, or 2 μM MitMAB (3 μM for CCRF-CEM). EdU was added to a final concentration of 10 μM 2 h prior to flow cytometry analysis. The proportion of proliferating (EdU+) cells was normalized to untreated cells. The raw fraction of proliferating cells in CCRF-CEM was 52.64 ± 6.48% (mean±standard deviation) and 40.56 ± 13.38% for THP-1. Data are given as mean + SEM, pooled from 6 biological replicates. One-way ANOVA was used for statistical testing with Dunnett’s posthoc test.
Fig 4
Fig 4. Inhibition of dynamin leads to caspase-3/7-dependent apoptosis in leukemia cells.
0.15 x 10⁶ of CCRF-CEM (A, C) or THP-1 (B, D) cells/ml were cultured for 24 h with 40 μM Dynasore, 10 μM Dyngo-4a or 3 μM MitMAB in the absence or presence of 20 μM Z-VAD-FMK (pan-caspase inhibitor) as indicated. (A-B) Caspase activity was analyzed by flow cytometry after addition of a caspase-3/7 probe. (C-D) Cell viability was assessed with PrestoBlue; treated groups were normalized to control groups. Data are given as mean + SEM, containing 4 pooled replicates from two independent experiments. Two-way ANOVA was used for statistical testing with Sidak’s posthoc test.
Fig 5
Fig 5. Caspase activation precedes overt cell death in leukemia cells subjected to dynamin inhibition.
0.15 x 10⁶ of CCRF-CEM (A) or THP-1 (B) cells/ml in medium containing 150 nM DRAQ7 and 500 nM caspase-3/7 probe were added to chamber slides, followed by addition of MitMAB (5 μM final concentration) as indicated. Every 10 min, images of every well were taken. The indicated DIC, fluorescence, or merged channels are shown. Scale bars = 100 μm. Representative images of two wells per condition are shown (see also S1–S4 Movies).
Fig 6
Fig 6. Dynamin inhibition affects transferrin uptake but not cell cycle progression in leukemia cells.
(A-B) 0.15 x 10⁶ CCRF-CEM (A) or THP-1 (B) cells/ml were cultured for 18 h with either 40 μM Dynasore, 10 μM Dyngo-4a, 5 μM MitMAB, 10 μM RO-3306, 0.5 μg/ml Taxol, or 2 μg/ml Cytochalasin D as indicated. Cell cycle profiles were analyzed (see experimental procedures for details). Gating for different cell cycle phases: G1 (gap phase 1), S (DNA synthesis phase), G2/M (gap phase 2 or mitosis), as well as polyploid cells are shown in the upper left panel in (A). (C-F) Quantification of the proportion of cells in G2/M phase and polyploid cells as indicated. (G-H) Effect of MitMAB (5 μM) on the uptake of fluorescent transferrin by CCRF-CEM (G) and THP-1 (H) cells. Time point “0” indicates unstained samples. Data are given as mean + SEM, containing 4–6 pooled replicates from 2–3 independent experiments. Two-way ANOVA was used for statistical testing including Dunnett’s posthoc test for (D-F).
Fig 7
Fig 7. Dynamin inhibition does not affect the viability of pediatric leukemia bone marrow cells placed in liquid culture.
(A-C) General gating strategies consisting of removal of duplets and debris (A), removal of outliers in fluorescence channels (B) and differentiation of populations regarding viability (C). (D) 0.5 x 10⁶ bone marrow cells from ALL patients were treated with the indicated concentrations of MitMAB for 8 h or 24 h and stained with Annexin V and SYTOX Green. The data shown represent mean values ±SEM (n = 3, data points indicate individual patients). Two-way ANOVA was used for statistical testing (no significant differences noted).
Fig 8
Fig 8. Dynamin inhibition does not prevent EL4 tumor growth in mice.
(A) 0.15 x 10⁶ EL4 cells were treated with the indicated concentrations of MitMAB for 24 h, followed by cell viability measurement using PrestoBlue (n = 8; data pooled from two independent experiments). Groups were compared to control with one-way ANOVA and Dunnet’s posthoc tests. (B-C) Mice were injected intraperitoneally with 5 (n = 4) or 10 mg/kg/day (n = 4–5) MitMAB in PBS or PBS alone. Weight is shown relative to the treatment start and the dashed line indicates the ethical end point (5% weight loss). In (B), linear regression was used (p = 0.387); in (C) nonlinear fits are shown (two way ANOVA for treatment factor p < 0.0001%). (D-F) Mice were injected subcutaneosly with 5 x 10⁵ EL4 cells. After 3 or 7 days, treatment with MitMAB (10 mg/kg/day) was initiated (weight loss of 10% as ethical endpoint in this experiment). (E) Pooled tumor volume endpoints from two independent experiments. Every point shows the total tumor burden in a mouse (from both flanks). The groups were compared with Welch’s two-tailed t-test, n = 7–9. (F) Survival curves for the two experiments, with MitMAB treatment initiated on either day 3 (left graph), or day 7 (right graph).

Similar articles

Cited by

References

    1. Juliusson G, Hough R. Leukemia. Tumors in Adolescents and Young Adults. 2016;43:87–100. doi: 10.1159/000447076 - DOI - PubMed
    1. Karrman K, Johansson B. Pediatric T-cell acute lymphoblastic leukemia. Genes, Chromosomes and Cancer. 2017;56(2):89–116. doi: 10.1002/gcc.22416 - DOI - PubMed
    1. Starý J, Hrušák O. Recent advances in the management of pediatric acute lymphoblastic leukemia. F1000Res. 2016;5:2635. doi: 10.12688/f1000research.9548.1 - DOI - PMC - PubMed
    1. Taga T, Tomizawa D, Takahashi H, Adachi S. Acute myeloid leukemia in children: Current status and future directions. Pediatrics International. 2016;58(2):71–80. doi: 10.1111/ped.12865 - DOI - PubMed
    1. Rubnitz JE. Current Management of Childhood Acute Myeloid Leukemia. Pediatr Drugs. 2017;19(1):1–10. doi: 10.1007/s40272-016-0200-6 - DOI - PubMed

Publication types

MeSH terms