. 2021 Sep 7;17(9):e1009889.
doi: 10.1371/journal.ppat.1009889. eCollection 2021 Sep.

Hepatitis C virus induces oxidation and degradation of apolipoprotein B to enhance lipid accumulation and promote viral production

Affiliations

Hepatitis C virus induces oxidation and degradation of apolipoprotein B to enhance lipid accumulation and promote viral production

Bei Wang et al. PLoS Pathog. .

Abstract

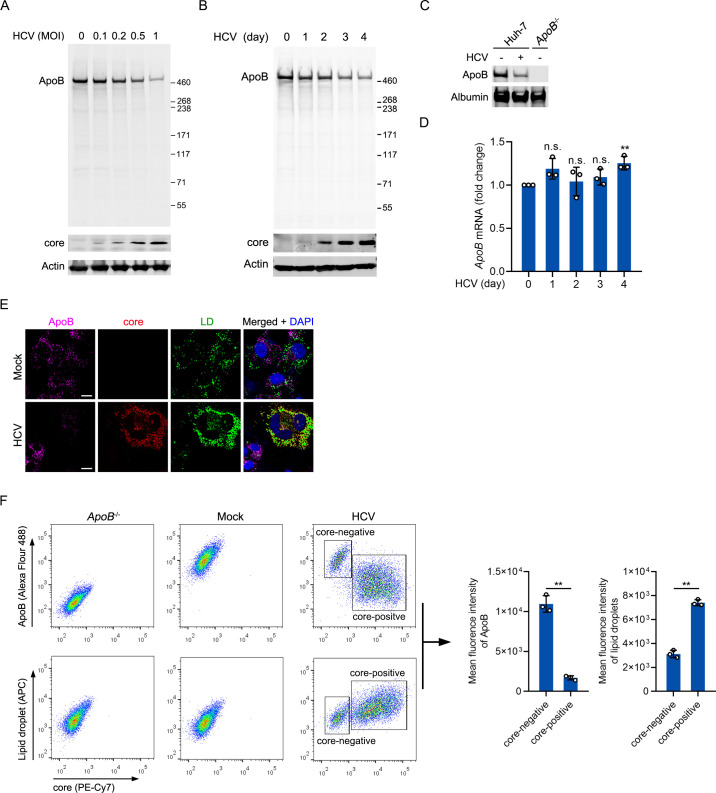
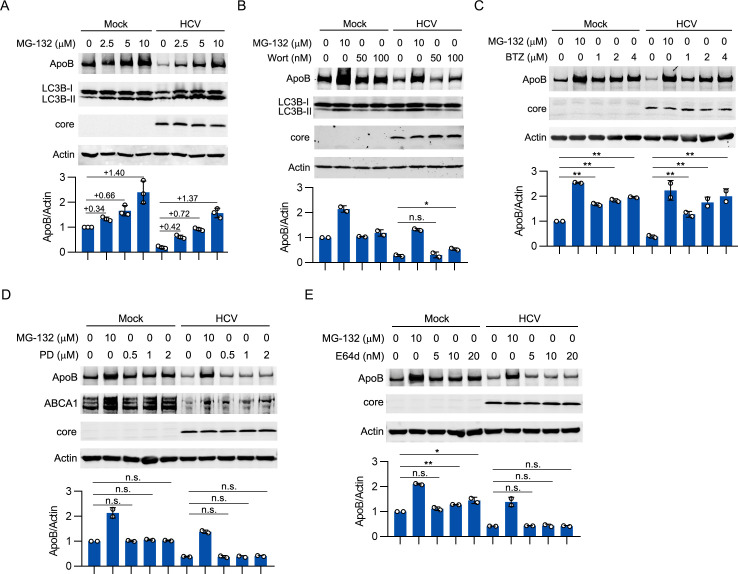
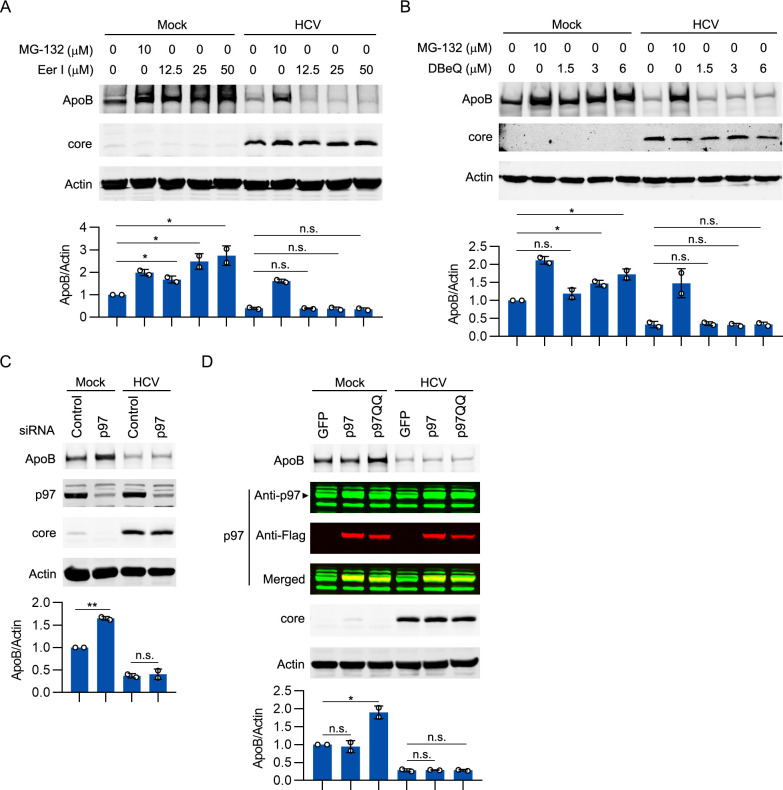
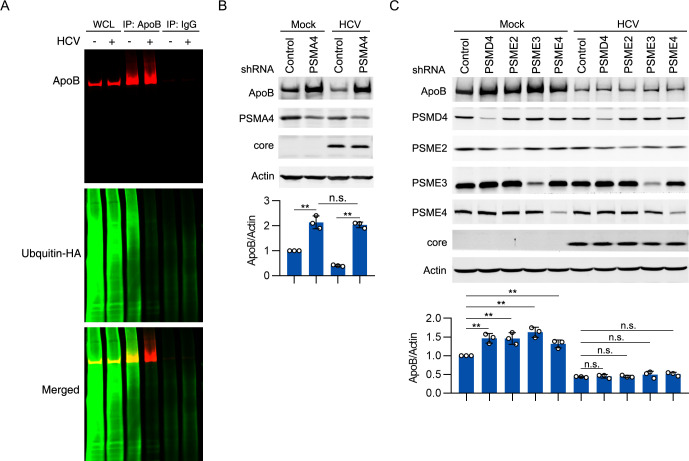
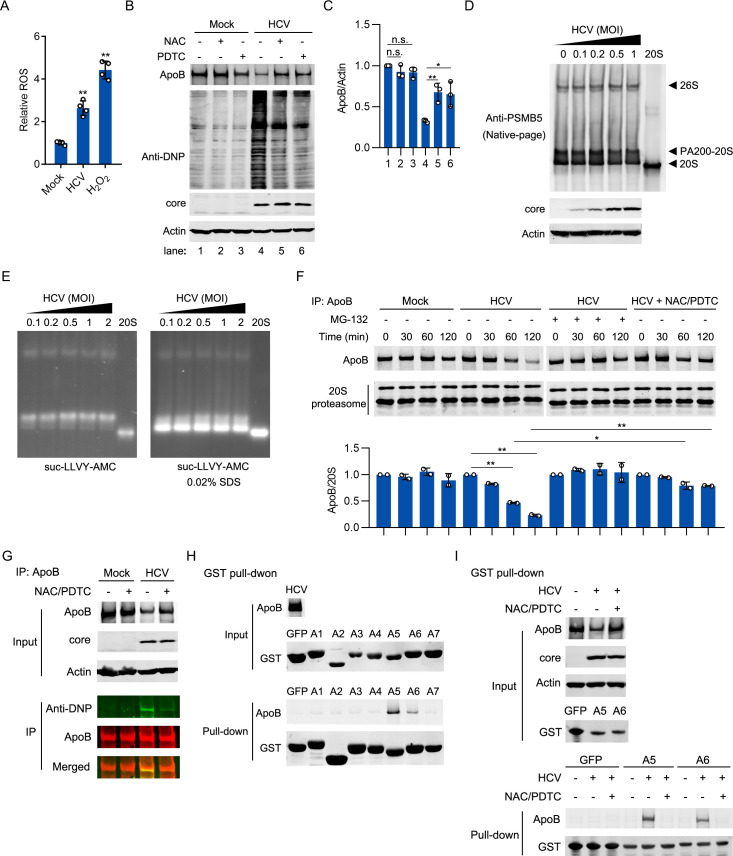
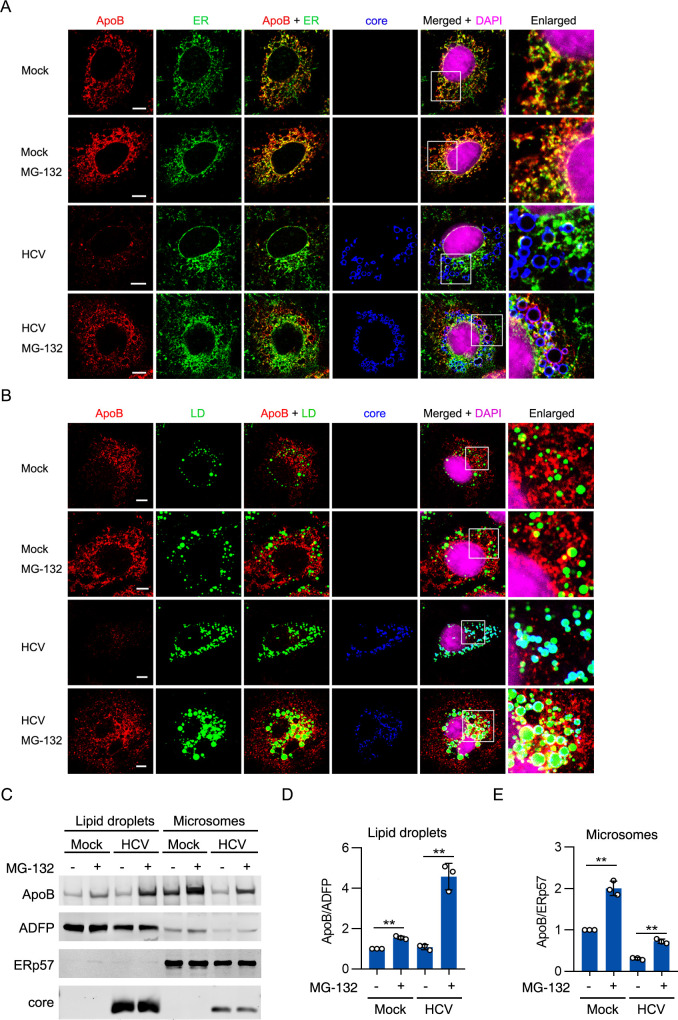
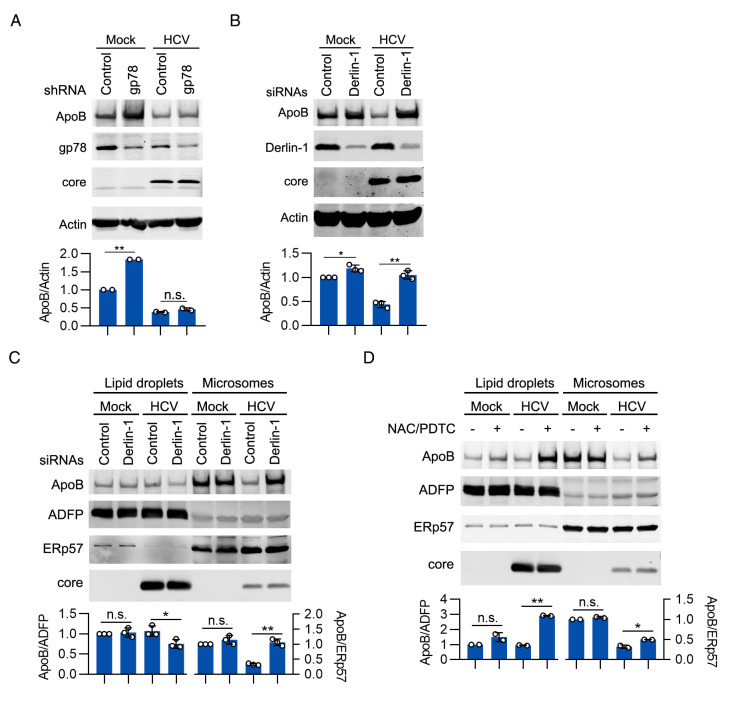
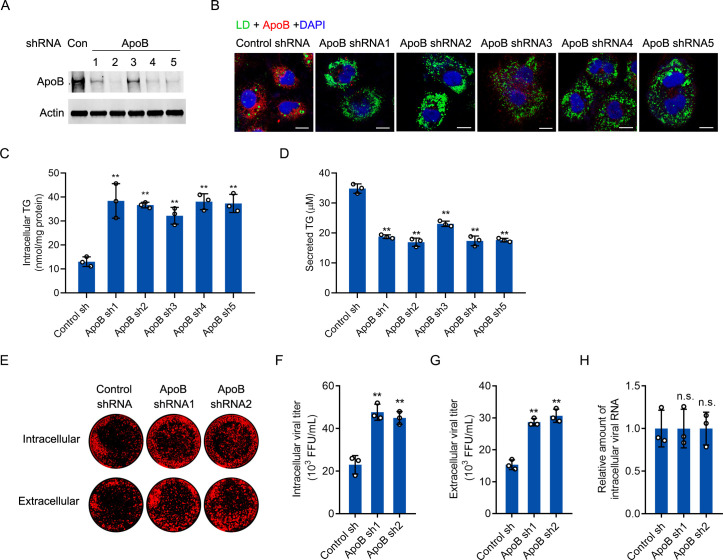
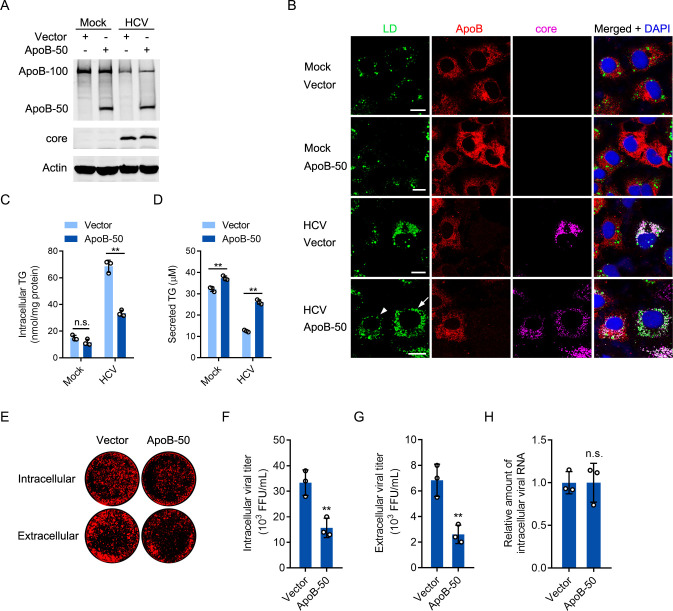
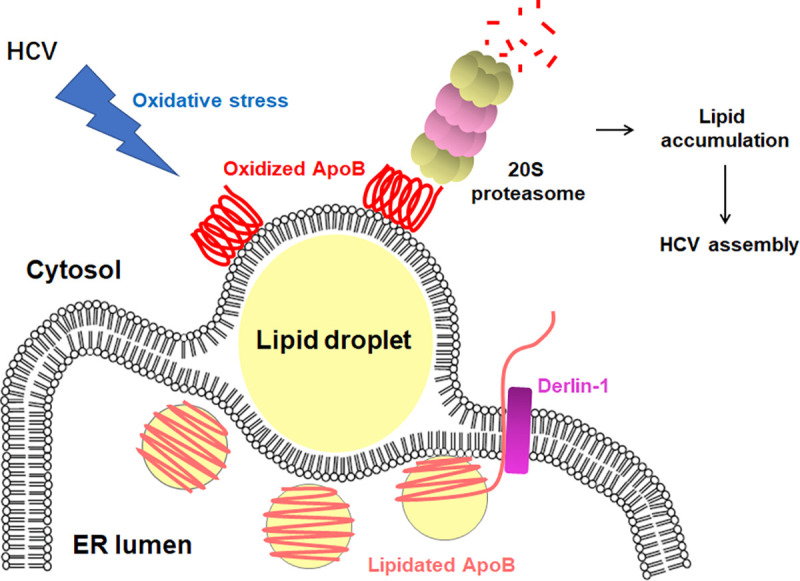
Hepatitis C virus (HCV) infection induces the degradation and decreases the secretion of apolipoprotein B (ApoB). Impaired production and secretion of ApoB-containing lipoprotein is associated with an increase in hepatic steatosis. Therefore, HCV infection-induced degradation of ApoB may contribute to hepatic steatosis and decreased lipoprotein secretion, but the mechanism of HCV infection-induced ApoB degradation has not been completely elucidated. In this study, we found that the ApoB level in HCV-infected cells was regulated by proteasome-associated degradation but not autophagic degradation. ApoB was degraded by the 20S proteasome in a ubiquitin-independent manner. HCV induced the oxidation of ApoB via oxidative stress, and oxidized ApoB was recognized by the PSMA5 and PSMA6 subunits of the 20S proteasome for degradation. Further study showed that ApoB was degraded at endoplasmic reticulum (ER)-associated lipid droplets (LDs) and that the retrotranslocation and degradation of ApoB required Derlin-1 but not gp78 or p97. Moreover, we found that knockdown of ApoB before infection increased the cellular lipid content and enhanced HCV assembly. Overexpression of ApoB-50 inhibited lipid accumulation and repressed viral assembly in HCV-infected cells. Our study reveals a novel mechanism of ApoB degradation and lipid accumulation during HCV infection and might suggest new therapeutic strategies for hepatic steatosis.


Conflict of interest statement

The authors have declared that no competing interests exist.

Figures

Fig 1
Fig 1. The protein level of ApoB was decreased in HCV-infected cells.
(A) Huh-7 cells were infected with HCV at different MOIs. After 96 hours, the protein levels of ApoB and HCV core proteins were analyzed by western blotting. Actin was used as the loading control. (B) Huh-7 cells were infected with HCV (MOI = 1). The protein levels of ApoB and HCV core proteins were analyzed by western blotting at the indicated timepoints after infection. Actin was used as the loading control. (C) The protein level of ApoB in culture supernatants of mock-infected, HCV-infected (MOI = 1) Huh-7 cells or ApoB-/- cells was analyzed by western blotting at 4 days post infection. Albumin was used as the loading control. (D) qPCR analysis of the mRNA level of ApoB in cells in B. The results are presented as fold changes in the mRNA level of ApoB relative to that of GAPDH. (E) Immunostaining was performed with anti-ApoB and anti-core antibodies in mock- or HCV-infected (MOI = 1) Huh-7 cells at 4 days post infection. LDs were stained with BODIPY 493/503. Nuclei were stained with DAPI. Fluorescence signals were visualized by laser confocal microscopy. LD, lipid droplet. (F) Flow cytometric analysis was performed in ApoB-/- cells and mock- or HCV-infected (MOI = 0.5) cells at 4 days post infection. The staining of ApoB, core, and LDs is described in the Methods. The data are shown as the means ± SDs of n = 3 biological repeats. The statistical significance was determined by unpaired two-sided Student’s t-tests. n.s., not significant. ** P < 0.01.
Fig 2
Fig 2. ApoB was degraded by the proteasome in HCV-infected cells.
Huh-7 cells were infected with HCV (MOI = 1) for 4 days followed by treatment with MG-132 (A), wortmannin (B), bortezomib (C), PD151746 (D), or E64d (E) for 12 hours. The levels of the indicated proteins were analyzed by western blotting. Actin was used as the loading control. Wort, wortmannin. BTZ, bortezomib. PD, PD151746. The data are presented as the means ± SDs from densitometry analyses of n = 2 or 3 independent experiments, and representative gels from each specific assay are shown. The statistical significance was determined by unpaired two-sided Student’s t-tests. n.s., not significant. * P < 0.05. ** P < 0.01.
Fig 3
Fig 3. ERAD did not participate in HCV-induced ApoB degradation.
(A, B) Huh-7 cells were infected with HCV (MOI = 1) for 4 days prior to treatment with MG-132, Eer I, or DBeQ for 12 hours. The levels of ApoB, Herp, and core were analyzed by western blotting. Actin was used as the loading control. (C) Huh-7 cells were infected with HCV (MOI = 1) for 48 hours prior to transfection with p97 siRNA for 2 days. The levels of ApoB, p97, and core were analyzed by western blotting. Actin was used as the loading control. (D) Huh-7 cells were infected with HCV (MOI = 1) for 2 days prior to transduction with GFP, a Flag-tagged wild type of p97, or a Flag-tagged dominant-negative p97 mutant (p97QQ) for 2 days. The levels of ApoB, p97, and core were analyzed by western blotting. Actin was used as the loading control. The data are presented the means ± SDs from densitometry analyses of n = 2 independent experiments, and representative gels from each specific assay are shown. The statistical significance was determined by unpaired two-sided Student’s t-tests. n.s., not significant. * P < 0.05. ** P < 0.01.
Fig 4
Fig 4. ApoB was degraded by the proteasome in a ubiquitin-independent manner in Huh-7 cells.
(A) Huh-7 cells were infected with HCV (MOI = 1) for 2 days prior to transduction with HA-tagged ubiquitin (MOI = 1) for 2 days. At 4 days post HCV infection, the cells were treated with 10 μM MG-132 for 12 hours. ApoB was immunoprecipitated under denaturing conditions, and the level of ubiquitin was analyzed by western blotting. WCL, whole-cell lysate. (B) Huh-7 cells were infected with HCV (MOI = 1) for 2 days prior to transduction with PSMA4 shRNA for 2 days. The protein levels of ApoB, PSMA4, and core proteins were analyzed by western blotting. Actin was used as the loading control. (C) Huh-7 cells were infected with HCV (MOI = 1) for 2 days prior to transduction with PSMD4, PSME2, PSME3, or PSME4 shRNA for 2 days. The protein levels of ApoB, PSMD4, PSME2, PSME3, PSME4, and core were analyzed by western blotting. Actin was used as the loading control. The data in B and C are presented as the means ± SDs from densitometry analyses of n = 3 independent experiments, and representative gels from each specific assay are shown. The statistical significance was determined by unpaired two-sided Student’s t-tests. n.s., not significant. ** P < 0.01.
Fig 5
Fig 5. Oxidized ApoB was recognized by the 20S proteasome for degradation.
(A) Huh-7 cells were infected with HCV (MOI = 1) for 4 days or treated with 1 μM H2O2 for 24 hours. Intracellular ROS levels were analyzed using a Fluorometric Intracellular ROS Kit. (B and C) Huh-7 cells were infected with HCV (MOI = 1) for 4 days prior to treatment with 1 mM NAC or 100 μM PDTC for 12 hours. ApoB was immunoprecipitated, and carbonyl groups generated by oxidation were derivatized to DNP and detected by western blotting with an anti-DNP antibody. The protein levels of ApoB and the core were also analyzed. Actin was used as the loading control. (D) Huh-7 cells were infected with HCV at different MOIs. Cell lysates were separated on a native-PAGE gel. Proteasomes were detected by western blotting with an anti-PSMB5 antibody. (E) Huh-7 cells were infected with HCV at different MOIs. Cell lysates were separated on a native-PAGE gel. The proteolytic activities of the 26S proteasome and the 20S proteasome (in the presence of 0.02% SDS) were analyzed with the proteasome substrate suc-LLAV-AMC. The stained gel was analyzed using a UV trans-illuminator at 365 nm wavelength. (F) ApoB was immunoprecipitated from mock-infected, HCV-infected (MOI = 1), and HCV-infected NAC/PDTC-treated cells prior to treatment with MG-132. Immunoprecipitated ApoB was incubated with purified 20S proteasome for the indicated timepoints in vitro. ApoB and the 20S proteasome in the reaction mixtures were analyzed by immunoblotting. (G) ApoB was immunoprecipitated from mock-infected and HCV-infected cells (MOI = 1) at day 4 after infection. Protein oxidation was analyzed as described in Methods. (H) A GST pulldown assay was performed to evaluate the interaction of the 20S proteasome subunit PSMA1-PSMA7 with ApoB from HCV-infected (MOI = 1) and MG-132-treated Huh-7 cells. (I) A GST pulldown assay was performed to evaluate the interaction of the 20S proteasome subunits PSMA5 and PSMA6 with ApoB from mock-infected, HCV-infected (MOI = 1), or HCV-infected Huh-7 cells treated with MG-132. The data in C and F are presented as the means ± SDs from densitometry analyses of n = 2 or 3 independent experiments, and representative gels from each specific assay are shown. The statistical significance was determined by unpaired two-sided Student’s t-tests. n.s., not significant. * P < 0.05. ** P < 0.01.
Fig 6
Fig 6. ApoB was degraded on ER-associated LDs in HCV-infected cells.
(A, B) Huh-7 cells were infected with HCV (MOI = 1) for 4 days followed by treatment with MG-132 for 12 hours. Immunostaining was performed with antibodies against ApoB, core, and calnexin (an ER marker). LDs were stained with BODIPY 493/503. Nuclei were stained with DAPI. Fluorescence signals were visualized by laser confocal microscopy. Scale bars, 5 μM. (C-E) Huh-7 cells were infected with HCV (MOI = 1) for 4 days followed by treatment with MG-132 for 12 hours. The protein level of ApoB was analyzed in LD fractions and microsomal fractions. A LD marker, ADFP, and an ER marker, ERp57, were used as loading controls. The data in D and E are presented as the means ± SDs of densitometry values from n = 3 independent experiments, and representative gels from each specific assay are shown in C. The statistical significance was determined by unpaired two-sided Student’s t-tests. ** P < 0.01.
Fig 7
Fig 7. Derlin-1 but not gp78 participated in ApoB degradation.
(A) Huh-7 cells were infected with HCV (MOI = 1) for 2 days followed by transduction with gp78 shRNA for 2 days. The protein levels of ApoB, gp78, and core were analyzed by western blotting at 4 days after infection. Actin was used as the loading control. (B) Huh-7 cells were infected with HCV (MOI = 1) for 2 days followed by transfection with Derlin-1 siRNAs for 2 days. The protein levels of ApoB, Derlin-1, and core proteins were analyzed by western blotting at 4 days after infection. Actin was used as the loading control. (C) Huh-7 cells were infected with HCV (MOI = 1) for 2 days followed by transfection with Derlin-1 siRNAs for 2 days. The protein level of ApoB was analyzed in LD fractions and microsomal fractions. ADFP and ERp57 were used as loading controls. (D) Huh-7 cells were infected with HCV for 4 days prior to treatment with 1 mM NAC and 100 μM PDTC for 12 hours. The protein level of ApoB was analyzed in LD fractions and microsomal fractions. ADFP and ERp57 were used as loading controls. The data are presented as the means ± SDs from densitometry analyses of n = 2 or 3 independent experiments, and representative gels for each specific assay are shown. The statistical significance was determined by unpaired two-sided Student’s t-tests. n.s., not significant. * P < 0.05. ** P < 0.01.
Fig 8
Fig 8. The knockdown of ApoB increased lipid accumulation and promoted HCV production.
(A) Huh-7 cells were transduced with ApoB shRNAs. The protein level of ApoB was analyzed by western blotting. Actin was used as the loading control. (B) Huh-7 cells were transduced with ApoB shRNA1-shRNA5. Immunostaining was performed with an anti-ApoB antibody. LDs were stained with BODIPY 493/503. Nuclei were stained with DAPI. Fluorescence signals were visualized by laser confocal microscopy. Scale bars, 10 μM. (C and D) The intracellular and secreted TG concentrations in cells in B were analyzed using a TG quantification kit. TG, triglyceride. (E) Huh-7 cells were transduced with ApoB shRNA1 or shRNA2 for 2 days prior to HCV infection (MOI = 1) for 4 days. Cell lysates and culture supernatants were collected to infect Huh-7 cells. In-cell western blot analysis was performed with an anti-core antibody. Cells were further labeled with IRDye 800-conjugated secondary antibodies and scanned with an Odyssey infrared imaging system. (F and G) Viral titration was performed by immunostaining. (H) The intracellular HCV RNA level was analyzed by real-time PCR. GAPDH was used as the internal control. The statistical significance was determined by unpaired two-tailed Student’s t-tests. The data are presented as the means ± SDs of n = 3 biological repeats. n.s., not significant. ** P < 0.01.
Fig 9
Fig 9. Expression of ApoB-50 decreased lipid accumulation and inhibited HCV production.
(A) Huh-7 cells were infected with HCV (MOI = 1) for 2 days prior to transduction with ApoB-50 for 2 days. The protein levels of ApoB and the core were analyzed by western blotting. Actin was used as the loading control. (B) Immunostaining was performed in cells in A with antibodies against ApoB and core. LDs were stained with BODIPY 493/503. Nuclei were stained with DAPI. Fluorescence signals were visualized by laser confocal microscopy. The arrow indicates an HCV-infected cell. The arrowhead indicates an HCV-infected cell transduced with ApoB-50. Scale bars, 10 μM. (C and D) The intracellular and extracellular TG concentrations in cells in A were analyzed using a TG quantification kit. TG, triglyceride. (E-G) Cell lysates and culture supernatants from HCV-infected cells were collected to infect Huh-7 cells. In-cell western blot analysis and viral titration assays were performed. (H) The intracellular HCV RNA level was analyzed by real-time PCR. GAPDH was used as the internal control. The statistical significance was determined by unpaired two-tailed Student’s t-tests. The data are shown as the means ± SDs of n = 3 biological repeats. n.s., not significant. ** P < 0.01.
Fig 10
Fig 10. Schematic representation of ApoB degradation in HCV-infected Huh-7 cells.
ApoB is retrotranslocated from the ER lumen to cytosolic LDs via a process requiring Derlin-1. HCV infection induces oxidative stress and results in ApoB oxidation. Oxidized ApoB is recognized and degraded by the 20S proteasome. The degradation of ApoB impairs lipid secretion and contributes to lipid accumulation, which might lead to enhanced HCV production.

Similar articles

Cited by

References

    1. Pietschmann T, Brown RJP. Hepatitis C Virus. Trends in microbiology. 2019;27(4):379–80. doi: 10.1016/j.tim.2019.01.001 . - DOI - PubMed
    1. Axley P, Ahmed Z, Ravi S, Singal AK. Hepatitis C Virus and Hepatocellular Carcinoma: A Narrative Review. Journal of clinical and translational hepatology. 2018;6(1):79–84. doi: 10.14218/JCTH.2017.00067 ; PubMed Central PMCID: PMC5863002. - DOI - PMC - PubMed
    1. Moradpour D, Penin F. Hepatitis C virus proteins: from structure to function. Current topics in microbiology and immunology. 2013;369:113–42. doi: 10.1007/978-3-642-27340-7_5 . - DOI - PubMed
    1. Sharma G, Raheja H, Das S. Hepatitis C virus: Enslavement of host factors. IUBMB life. 2018;70(1):41–9. doi: 10.1002/iub.1702 . - DOI - PubMed
    1. Bassendine MF, Sheridan DA, Bridge SH, Felmlee DJ, Neely RD. Lipids and HCV. Seminars in immunopathology. 2013;35(1):87–100. doi: 10.1007/s00281-012-0356-2 . - DOI - PubMed

Publication types

Substances