. 2021 Sep 16;184(19):4953-4968.e16.
doi: 10.1016/j.cell.2021.08.016. Epub 2021 Aug 19.

The interferon landscape along the respiratory tract impacts the severity of COVID-19

Affiliations

The interferon landscape along the respiratory tract impacts the severity of COVID-19

Benedetta Sposito et al. Cell. .

Abstract

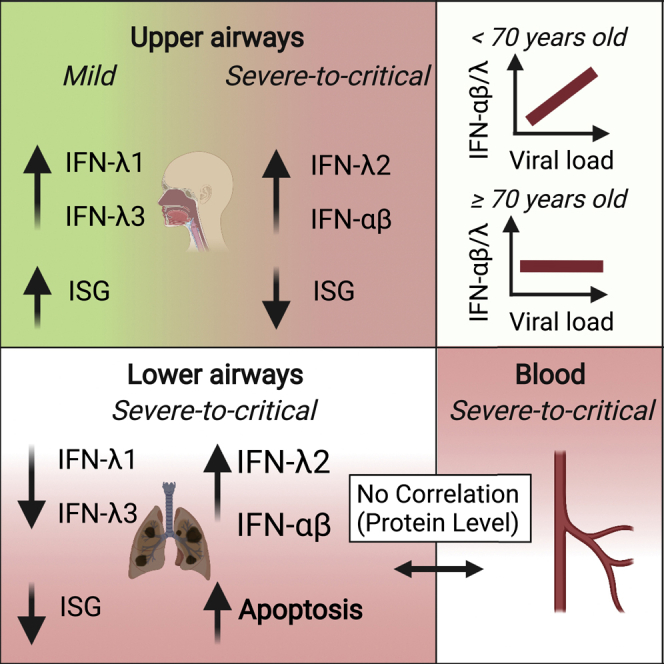
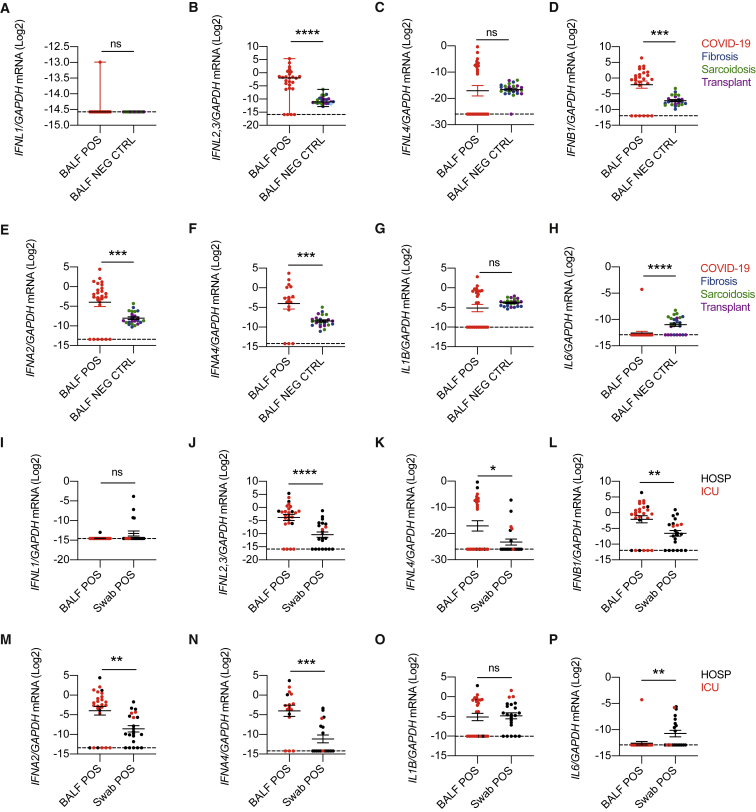
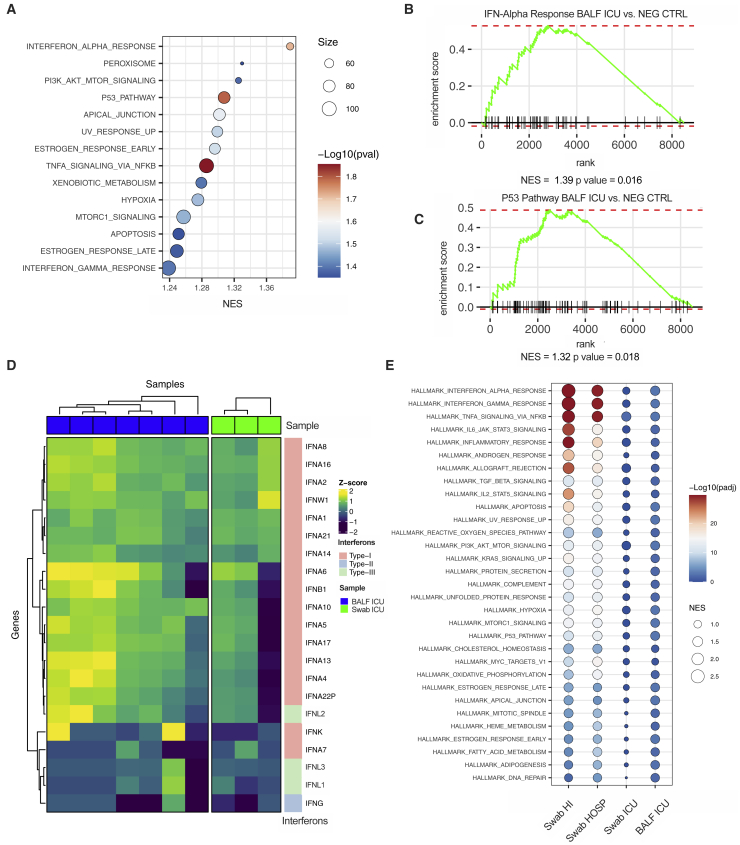
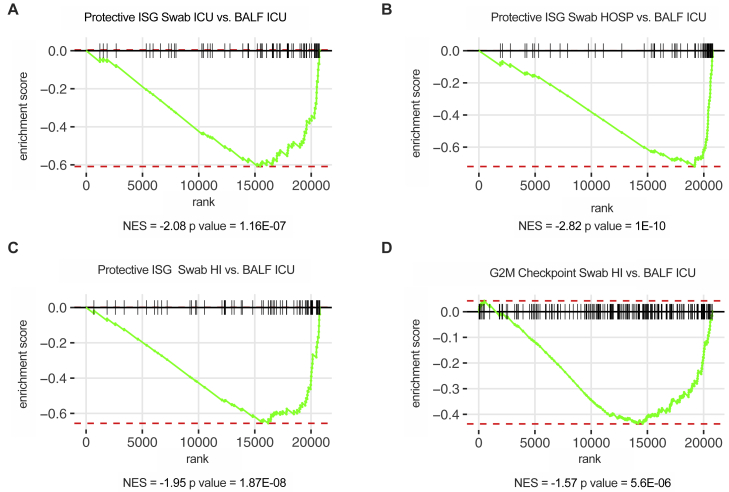
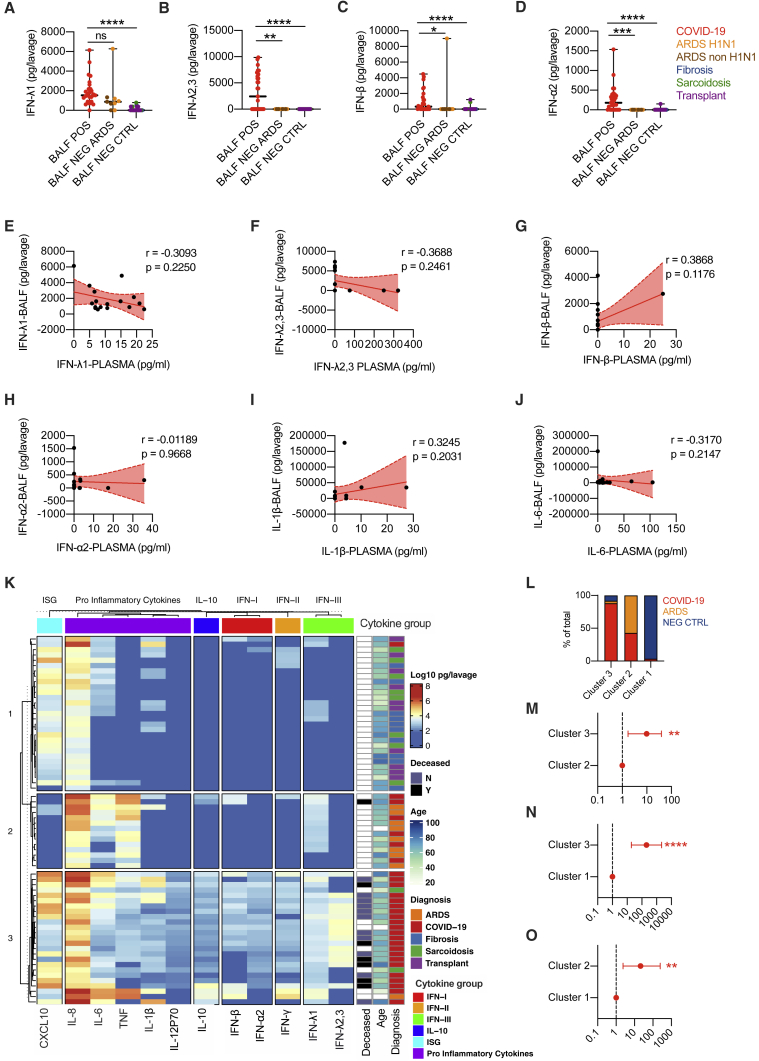
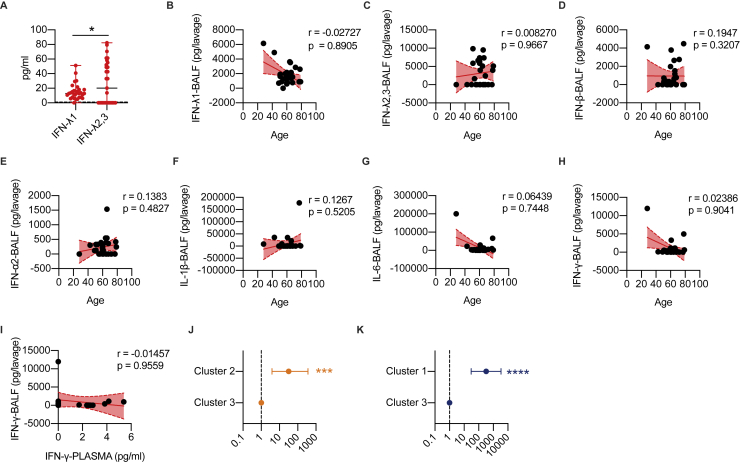
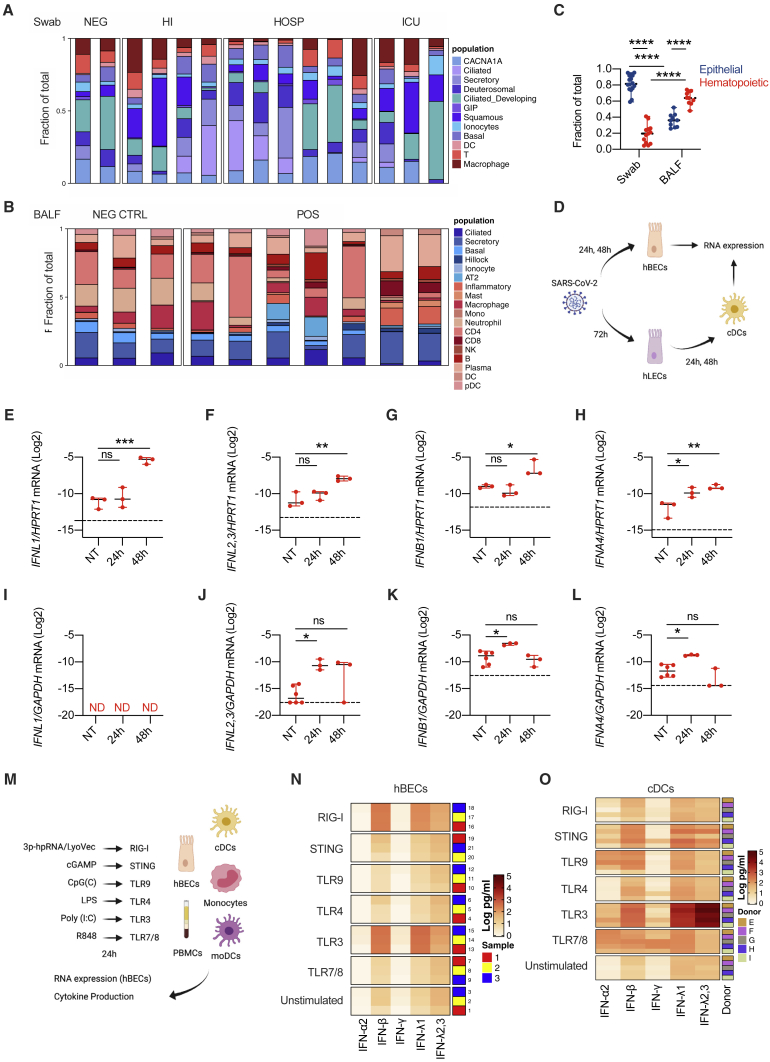
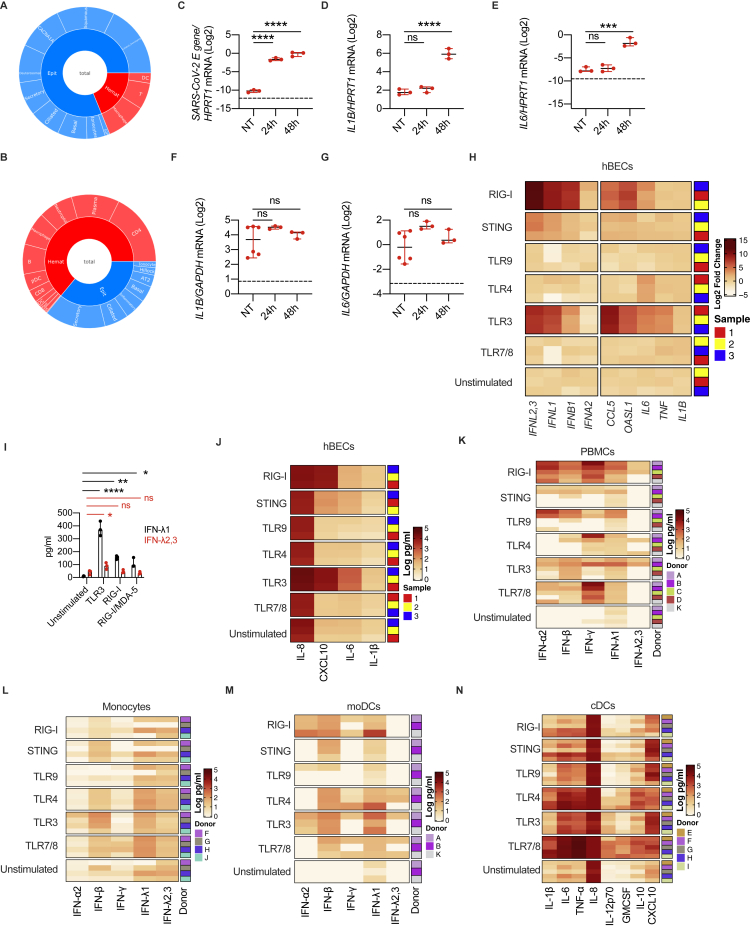
Severe coronavirus disease 2019 (COVID-19) is characterized by overproduction of immune mediators, but the role of interferons (IFNs) of the type I (IFN-I) or type III (IFN-III) families remains debated. We scrutinized the production of IFNs along the respiratory tract of COVID-19 patients and found that high levels of IFN-III, and to a lesser extent IFN-I, characterize the upper airways of patients with high viral burden but reduced disease risk or severity. Production of specific IFN-III, but not IFN-I, members denotes patients with a mild pathology and efficiently drives the transcription of genes that protect against severe acute respiratory syndrome coronavirus 2 (SARS-CoV-2). In contrast, compared to subjects with other infectious or noninfectious lung pathologies, IFNs are overrepresented in the lower airways of patients with severe COVID-19 that exhibit gene pathways associated with increased apoptosis and decreased proliferation. Our data demonstrate a dynamic production of IFNs in SARS-CoV-2-infected patients and show IFNs play opposing roles at distinct anatomical sites.

Keywords: COVID-19; SARS-CoV-2; Type I IFN; Type III IFN; airways; dendritic cell; epithelial cell; interferon; lung; pattern recognition receptor.


Conflict of interest statement

Declaration of interests I.Z. reports compensation for consulting services with Implicit Biosciences.

Figures

None
Graphical abstract
Figure S1
Figure S1
High viral loads drive the efficient production of IFN-III and, to a lesser extent, IFN-I in an age-dependent manner in the upper airways of COVID-19 patients, related to Figure 1 (A-C) Age distribution (A), number (B) and percentage (C) of females and males in cohorts of patients (Swab NEG, Swab POS) analyzed in Figures 1A–1L and Figures S1D–S1O. (A) Each dot represents a patient. Violin plots are depicted. (D, E) IL1B (D), and IL6 (E) mRNA expression was evaluated in nasopharyngeal swabs from SARS-CoV-2-negative (Swab NEG) and -positive (Swab POS) subjects. Each dot represents a patient. Median with range is depicted. Dashed line represents limit of detection. (F-M) Percentage of patients that express (Expressed, black bars) or not (Undetected, red bars) IFNL1 (F), IFNL2,3 (G), IFNL4 (H), IFNB1 (I), IFNA2 (J), IFNA4 (K), IL1B (L), and IL6 (M) in Swab POS and Swab NEG cohorts. (N-O) IL1B (N), and IL6 (O) mRNA expression is plotted against mean viral RNA CT in Swab POS cohorts. Each dot represents a patient. Linear regression lines (continuous line) and 95% confidence interval (dashed line and shaded area) are depicted in red. Spearman correlation coefficients (r) and p value (p) are indicated. (P-W) Percentage of patients that express (Expressed, black bars) or not (Undetected, red bars) IFNL1 (P), IFNL2,3 (Q), IFNL4 (R), IFNB1 (S), IFNA2 (T), IFNA4 (U), IL1B (V), and IL6 (W) in viral load tercile cohorts (“+,” “++,” “+++”). (X, Y) IL1B (X), and IL6 (Y) mRNA expression is plotted against mean viral RNA CT in swabs from SARS-CoV-2 positive patients over 70-year-old (≥70, blue dots and lines) and below 70-year-old (< 70, orange dots and lines). Each dot represents a patient. Linear regression (continuous lines), 95% confidence interval (dashed line and shaded area), Spearman correlation coefficients (r) and p value (p) are indicated in blue and in orange for ≥ 70 and < 70 year-old patients respectively. (Z-AG) Odds ratio of expressing IFNL1 (Z) mRNA in “+++” with respect to “++” SARS-CoV-2 positive swabs and IFNL2,3 (AA), IFNL4 (AB), IFNB1 (AC), IFNA2 (AD), IFNA4 (AE), IL1B (AF), and IL6 (AG) mRNA in “+++” and “++” with respect to “+” SARS-CoV-2 positive swabs in ≥ 70 (blue dots and lines) and < 70 (orange dots and lines) patients. Symbols represent the odds ratio. Error bars represent the 95% confidence interval associated to the odds ratio. NE: not estimable, AB) no patient in group expresses IFNL4, AF) all patients in group express IL1B. (D, E, N, O, X, Y) Expression is plotted as log2 (gene/GAPDH mRNA + 0.5 x gene-specific minimum). Statistics: (A) Unpaired t test: ns, not significant (p > 0.05); p < 0.05, ∗∗p < 0.01, ∗∗∗p < 0.001, and ∗∗∗∗p < 0.0001. (D, E) Mann-Whitney test: ns, not significant (p > 0.05); p < 0.05, ∗∗p < 0.01, ∗∗∗p < 0.001, and ∗∗∗∗p < 0.0001. (F-M and P-W) Fisher’s exact test with Bonferroni correction: ns, not significant (p > 0.05); p < 0.05, ∗∗p < 0.01, ∗∗∗p < 0.001, and ∗∗∗∗p < 0.0001. (Z-AG) Odds ratio: ns, not significant (p > 0.05); #p < 0.05, ##p < 0.01, ###p < 0.001. Interaction analysis: ns, not significant (p > 0.05); p < 0.05, ∗∗p < 0.01, ∗∗∗p < 0.001. See also Tables S1 and S2.
Figure 1
Figure 1
High viral loads drive the efficient production of IFN-III and, to a lesser extent, IFN-I in an age-dependent manner in the upper airways of COVID-19 patients (A–F) IFNL1 (A), IFNL2,3 (B), IFNL4 (C), IFNB1 (D), IFNA2 (E), and IFNA4 (F) mRNA expression was evaluated in nasopharyngeal swabs from SARS-CoV-2-negative (Swab NEG; 28) and positive (Swab POS; 155) subjects. Each dot represents a patient. Median with range is depicted. Dashed line represents limit of detection. (G–L) IFNL1 (G), IFNL2,3 (H), IFNL4 (I), IFNB1 (J), IFNA2 (K), and IFNA4 (L) mRNA expression is plotted against mean viral RNA cycle threshold (CT) in swabs from SARS-CoV-2-positive patients (155). Each dot represents a patient. Linear regression lines (continuous line) and 95% confidence interval (dashed line and shaded area) are depicted in red. Spearman correlation coefficients (r) and p value (p) are indicated. Dashed horizontal black line represents limit of detection. (M–R) IFNL1 (M), IFNL2,3 (N), IFNL4 (O), IFNB1 (P), IFNA2 (Q), and IFNA4 (R) mRNA expression is plotted against mean viral RNA CT in swabs from SARS-CoV-2-positive patients aged ≥70 years (61, blue dots and lines) and <70 years (94, orange dots and lines). Each dot represents a patient. Linear regression (continuous lines) and 95% confidence interval (dashed line and shaded area) are depicted. Spearman correlation coefficients (r) and p value (p) are indicated in blue and orange for patients ≥70 and <70 years, respectively. Dashed horizontal black line represents limit of detection. (A–R) Expression is plotted as log2 (gene/GAPDH mRNA + 0.5 × gene-specific minimum). Statistics by Mann-Whitney test: ns, not significant (p > 0.05); p < 0.05; ∗∗p < 0.01; ∗∗∗p < 0.001; ∗∗∗∗p < 0.0001 (A–F) or test for difference between simple linear regression slopes: ns, not significant (p > 0.05); p < 0.05; ∗∗p < 0.01; ∗∗∗p < 0.001; ∗∗∗∗p < 0.0001 (M–R). See also Figure S1 and Table S1.
Figure 2
Figure 2
Mild COVID-19 is characterized by high levels of IFN-III, but not IFN-I, in response to high viral loads in the upper airways (A–M) Swabs from a cohort of SARS-CoV-2-positive hospitalized patients and ICU inpatients (HOSP, black dots; ICU, red dots; both HOSP and ICU, black lines and analyzed together) and home-isolated patients (HI, green dots and lines) were analyzed. (A–H) IFNL1 (A), IFNL2,3 (B), IFNL4 (C), IFNB1 (D), IFNA2 (E), IFNA4 (F), IL1B (G), and IL6 (H) mRNA expression is plotted against mean viral RNA CT. Each dot represents a patient. Linear regression lines (continuous line) and 95% confidence interval (dashed line and shaded area) are depicted. Spearman correlation coefficients (r) and p value (p) are indicated in black and in green for “HOSP + ICU” and “HI” patients respectively. (I) Mean viral RNA CT values are plotted against days from symptom onset (DFSO). Each dot represents a patient. Lines connect mean values for each range of DFSO. (J) K-means clustering based on the expression of IFNA2, IFNB1 IFNL1, IFNL2,3, and IL1B was used to determine clusters 1–3 (cluster 1, n = 13; cluster 2, n = 12; cluster 3, n = 6). The color indicates the relative gene expression. Viral load tercile, age group, and severity are annotated. Viral load terciles (“+++,” “++,” and “+”) are defined by mean viral RNA CT (<20, >20 and <30, and >30). Age groups are defined as <70 or ≥70 years. (K) IFNL1, IFNL2,3, IFNA2, IFNB1, and IL1B mRNA expression within clusters identified in (J). Each dot represents a patient. Violin plots are depicted. (L) Percentage of patients with the indicated disease severity within clusters identified in (J). (M) Odds ratio of patients in cluster 2 being hospitalized or admitted to the ICU relative to patients in cluster 3 (clusters identified in J). Symbols represent the odds ratio. Error bars represent the 95% confidence interval associated with the odds ratio. (A–H and K) Expression is plotted as log2 (gene/GAPDH mRNA + 0.5 × gene-specific minimum). Statistics by test for difference between simple linear regression slopes: ns, not significant (p > 0.05); p < 0.05; ∗∗p < 0.01; ∗∗∗p < 0.001; ∗∗∗∗p < 0.0001 (A–H); two-way ANOVA: ns, not significant (p > 0.05); p < 0.05; ∗∗p < 0.01; ∗∗∗p < 0.001; ∗∗∗∗p < 0.0001 (I); or chi-square test for odds ratio: ns, not significant (p > 0.05); p < 0.05; ∗∗p < 0.01; ∗∗∗p < 0.001 (L). See also Figure S2 and Table S3.
Figure S2
Figure S2
Mild COVID-19 is characterized by high levels of IFN-III, but not IFN-I, in response to high viral loads in the upper airways, related to Figure 2 (A) Number of samples from each disease severity group (HI = home-isolated, HOSP = hospitalized and ICU = Intensive care unit) within each cluster identified in Figure 2J. (B-C) Odds ratio of patients in Cluster 1 being hospitalized or admitted to the ICU relative to patients in Cluster 3 (B) and Cluster 2 (C) (Clusters identified in Figure 2J). Symbols represent the odds ratio. Error bars represent the 95% confidence interval associated to the odds ratio. (D-E) Percentage (D) and number (E) of samples from each viral load tercile (“+++,” “++,” “+”) within each cluster identified in Figure 2J. Viral load terciles (“+++,” “++,” “+”) are defined by mean viral RNA CT (< 20, > 20 and < 30, > 30). Statistics: (B-C) Chi Square test for odds ratio: ns, not significant (p > 0.05); p < 0.05, ∗∗p < 0.01, ∗∗∗p < 0.001. See also Table S3.
Figure 3
Figure 3
IFN-λ1 and IFN-λ3, but not IFN-λ2 or IFN-I, characterize the upper airways of patients with mild COVID-19 and drive ISGs that protect against SARS-CoV-2 (A–C) Targeted RNA-seq of nasopharyngeal swabs from SARS-CoV-2-negative (NEG; 3) and positive patients with known disease severity: home-isolated patients (HI; 5), hospitalized patients (HOSP; 7), ICU inpatients (ICU; 3). (A) Heatmap depicting expression of IFN-I/IFN-II/IFN-III. The color is proportional to the Z score. (B) Bubble plot visualization of gene set enrichment analysis (GSEA) for pathways enriched in HI, HOSP, and ICU patients. Normalized enrichment score (NES) is depicted. Color coding corresponds to −log10 (p adjusted value [padj]). Pathways with padj < 0.05 in either group are represented. (C) Heatmap depicting expression of ISGs that protect against SARS-CoV-2. The color is proportional to the Z score. (D–G) Human bronchial epithelial cells (hBECs) were treated with human recombinant IFN-λ1, IFN-λ2, or IFN-λ3 at a concentration of 2 ng/mL for 4 or 24 h. RSAD2 (D) IFIT3 (E), LY6E (F), and APOL2 (G) mRNA expression was evaluated. Each dot represents a biological replicate. Median with range is depicted. FC, fold change compared to untreated cells. Statistics by two-way ANOVA: ns, not significant (p > 0.05); p < 0.05; ∗∗p < 0.01; ∗∗∗p < 0.001; ∗∗∗∗p < 0.0001. See also Figure S3 and Table S4.
Figure S3
Figure S3
IFN-λ1 and IFN-λ3, but not IFN-λ2 or IFN-I, characterize the upper airways of patients with mild COVID-19 and drive ISGs that protect against SARS-CoV-2, related to Figure 3 (A-F) Targeted RNA-sequencing of nasopharyngeal swabs from SARS-CoV-2 negative (NEG, 3) and positive patients with known disease severity: home-isolated patients (HI, 5), hospitalized patients (HOSP, 7), ICU inpatients (ICU, 3). (A-B) Gene set enrichment analysis (GSEA) enrichment plot for genes belonging to the interferon alpha response (HALLMARK Pathways) between HOSP and HI (A) and ICU and HI (B) cohorts of patients. (C) Normalized enrichment score (NES) and p value of interferon alpha response geneset (HALLMARK Pathways) in HI, HOSP and ICU patients as compared to NEG. (D-E) GSEA enrichment plot for protective ISG geneset (Curated Geneset derived from Martin-Sancho et al., 2021) between HOSP and HI (D) and ICU and HI (E) cohorts of patients. (F) Normalized enrichment score (NES) of protective ISG geneset in HI, HOSP and ICU patients as compared to NEG. See also Table S4.
Figure S4
Figure S4
Members of the IFN-III and IFN-I families are overrepresented in the lower airways of COVID-19 patients, related to Figure 4 (A-C) Age distribution (A), number (B) and percentage (C) of females and males in cohorts of patients (BALF POS, BALF NEG CTRL and Swab POS) analyzed in Figure 4A-P. (A) Each dot represents a patient. Violin plots are depicted. (D-K) Percentage of patients in BALF from SARS-CoV-2-positive (BALF POS, 26) and -negative (BALF NEG CTRL, 24) that express (Expressed, black bars) or not (Undetected, red bars) IFNL1 (D), IFNL2,3 (E), IFNL4 (F), IFNB1 (G), IFNA2 (H), IFNA4 (I), IL1B (J), and IL6 (K). (L-S) Percentage of patients (BALF POS, 26) and swabs (Swab POS, 21) from SARS-CoV-2-positive subjects that express (Expressed, black bars) or not (Undetected, red bars) IFNL1 (L), IFNL2,3 (M), IFNL4 (N), IFNB1 (O), IFNA2 (P), IFNA4 (Q), IL1B (R), and IL6 (S). Statistics: (D-S) Fisher’s exact test: ns, not significant (p > 0.05); p < 0.05, ∗∗p < 0.01, ∗∗∗p < 0.001, and ∗∗∗∗p < 0.0001. See also Table S5.
Figure 4
Figure 4
Members of the IFN-III and IFN-I families are overrepresented in the lower airways of COVID-19 patients (A–H) IFNL1 (A), IFNL2,3 (B), IFNL4 (C), IFNB1 (D), IFNA2 (E), IFNA4 (F), IL1B (G), and IL6 (H) mRNA expression was evaluated in BALF from SARS-CoV-2-positive (BALF POS; 26, red dot) and negative (BALF NEG CTRL; 24) patients with noninfectious lung involvement such as fibrosis (8, blue dot), sarcoidosis (8, green dot), or lung transplant (8, purple dot). (I–P) IFNL1 (I), IFNL2,3 (J), IFNL4 (K), IFNB1 (L), IFNA2 (M), IFNA4 (N), IL1B (O), and IL6 (P) mRNA expression was evaluated in BALF (BALF POS; 26) and swabs (Swab POS; 21) from SARS-CoV-2-positive subjects who were either hospitalized (HOSP; black dots) or ICU inpatients (ICU; red dots). (A–P) Expression is plotted as log2 (gene/GAPDH mRNA + 0.5 × gene-specific minimum). Each dot represents a patient. Median with range is depicted. Statistics by Mann-Whitney test: ns, not significant (p > 0.05); p < 0.05; ∗∗p < 0.01; ∗∗∗p < 0.001; ∗∗∗∗p < 0.0001. See also Figure S4 and Table S5.
Figure 5
Figure 5
Critical COVID-19 is characterized by the induction of a similar IFN landscape in the upper and lower airways (A–E) Targeted RNA-seq of BALF from SARS-CoV-2-positive patients (BALF ICU; 7), patients with noninfectious lung pathologies (BALF NEG CTRL; 5), and nasopharyngeal swabs from SARS-CoV-2-positive patients who were either ICU inpatients (Swab ICU; 3), hospitalized (Swab HOSP; 7), or HI (Swab HI; 5). The color is proportional to the Z score. (A) Bubble plot visualization of GSEA for pathways enriched in BALF ICU compared to BALF NEG CTRL samples. NES is depicted. Color coding corresponds to −log10(p adjusted value [padj]), and size corresponds to the number of genes detected for each pathway. Pathways with p value (pval)< 0.05 are depicted. (B and C) GSEA enrichment plot for genes belonging to the interferon alpha response (B) and p53 pathway (C) in BALF ICU and BALF NEG CTRL samples. (D) Heatmap depicting expression of IFN-I/IFN-II/IFN-III IFNs in BALF ICU and Swab ICU samples. (E) Dot plot visualization of GSEA for pathways enriched in the lower airways of critical patients (BALF ICU) and the upper airways of patients with different disease severity (Swab HI, Swab HOSP, and Swab ICU). NES is depicted. Color coding corresponds to −log10(padj). Pathways with padj < 0.05 in any of the groups are depicted. See also Figure S5 and Table S6.
Figure S5
Figure S5
Critical COVID-19 is characterized by the induction of a similar IFN landscape in the upper and lower airways, related to Figure 5 (A-C) Targeted RNA-sequencing of BALF from SARS-CoV-2 positive patients (BALF ICU, 7), and from nasopharyngeal swabs from SARS-CoV-2 positive patients that were either ICU inpatients (Swab ICU, 3) hospitalized (Swab HOSP, 7) or home-isolated (Swab HI, 5). (A-C) GSEA enrichment plot for protective ISG genes (curated Geneset derived from Martin-Sancho et al., 2021) between Swab ICU and BALF ICU (A), Swab HOSP and BALF ICU (B), Swab HI and BALF ICU (C). (D) GSEA enrichment plot for genes involved in the G2M checkpoint (HALLMARK Pathways) between Swab HI and BALF ICU. (A-D) NES: Normalized enrichment score. See also Table S6.
Figure 6
Figure 6
A unique protein IFN signature characterizes the lower airways of COVID-19 patients compared to patients with other ARDS or noninfectious lung pathologies (A–D) IFN-λ1 (A), IFN-λ2,3 (B), IFN-β (C), and IFN-α2 (D) protein levels were measured in the BALF of COVID-19 (BALF POS; 29, depicted with red dots), ARDS (BALF NEG ARDS; 5 were diagnosed H1N1 and are depicted with orange dots, and the remaining 4 are depicted with brown dots), non-microbially infected (BALF NEG CTRL; 10 affected by fibrosis are depicted with blue dots, 10 affected by sarcoidosis are depicted with green dots, and 10 transplant patients are depicted with purple dots). Each dot represents a patient. Median with range is depicted. (E–J) IFN-λ1 (E), IFN-λ2,3 (F), IFN-β (G), IFN-α2 (H), IL-1β (I), and IL-6 (J) protein levels in the BALF of COVID-19 patients (17) are plotted against protein levels in the plasma of the same patient. Each dot represents a patient. Linear regression lines (continuous line) and 95% confidence interval (dashed line and shaded area) are depicted in red. Spearman correlation coefficients (r) and p value (p) are indicated. (K) Heatmap comparison of IFN-α2, IFN-β, IFN-γ, IFN-λ1, IFN-λ2,3, IL-10, CXCL-10, IL-1β, IL-6, tumor necrosis factor (TNF), IL-8, and IL12p70 protein levels in the BALF of COVID-19 (29), ARDS (9), transplant (10), fibrosis (10), and sarcoidosis (10) patients. The color is proportional to the log10 transformed value of the amount of cytokine normalized for sample volume (picograms [pg]/lavage) of each cytokine. Rows in each group represent different patients. Unbiased K-means clustering was performed. Diagnosis, mortality, and age are annotated. (L) Percentage of patients with the indicated diagnosis within clusters identified in (K). (M–O) Odds ratio of containing COVID-19 patients in cluster 3 as compared to cluster 2 (M) and cluster 1 (N) and in cluster 2 as compared to cluster 1 (O) (clusters identified in J). Statistics by Kruskal-Wallis test with Dunn’s post hoc test: ns, not significant (p > 0.05); p < 0.05; ∗∗p < 0.01; ∗∗∗p < 0.001; ∗∗∗∗p < 0.0001 (A–D) or chi-square test for odds ratio: ns, not significant (p > 0.05); p < 0.05; ∗∗p < 0.01; ∗∗∗p < 0.001 (L–M). See also Figure S6 and Table S7.
Figure S6
Figure S6
A unique protein IFN signature characterizes the lower airways of COVID-19 patients compared to patients with other ARDS or non-infectious lung pathologies, related to Figure 6 (A) IFN-λ1 and IFN-λ2,3 protein levels were measured in the BALF of COVID-19 patients (29). Each dot represents a patient. Median and range are depicted. Dashed line represents limit of detection. (B-H) IFN-λ1 (B), IFN-λ2,3 (C), IFN-β (D), IFN-α2 (E), IL-1β (F), IL-6 (G) and IFN-γ (H) protein levels in the BALF of COVID-19 patients (29) are plotted over age. (I) IFN-γ protein levels in the BALF of COVID-19 patients (17) are plotted against protein levels in the plasma. (J-K) Odds ratio of containing ARDS patients in Cluster 2 as compared to Cluster 3 (J) and of containing non-microbially infected control patients in Cluster 1 as compared to Cluster 3 (K) (Clusters identified in Figure 6J) (B-I) Each dot represents a patient. Linear regression lines (continuous line) and 95% confidence interval (dashed line and shaded area) are depicted in red. Spearman correlation coefficients (r) and p value (p) are indicated. Statistics: (A) Unpaired t test: ns, not significant (p > 0.05); p < 0.05, ∗∗p < 0.01, ∗∗∗p < 0.001, and ∗∗∗∗p < 0.0001. (J-K) Chi Square test for odds ratio: ns, not significant (p > 0.05); p < 0.05, ∗∗p < 0.01, ∗∗∗p < 0.001. See also Table S7.
Figure 7
Figure 7
Epithelial and immune cells dictate the IFN landscape (A–C) Targeted RNA-seq of nasopharyngeal swabs from SARS-CoV-2-positive patients who were ICU inpatients (Swab ICU; 3), hospitalized (Swab HOSP; 6), or home-isolated (Swab HI; 4); SARS-CoV-2-negative (Swab NEG; 2) patients; and BALF from SARS-CoV-2-positive patients (BALF POS, 7) and patients with noninfectious lung pathologies (BALF NEG CTRL; 3) was performed. Data were deconvoluted based on publicly available single-cell RNA-seq (scRNA-seq) datasets (Ziegler et al., 2021) using CIBERSORTx (Newman et al., 2019) to extrapolate the relative cellular composition of samples. (A and B) Each cell population in swab (A) and BALF (B) samples is depicted as a fraction of total cells. (C) Fraction of epithelial or hematopoietic cells in swab and BALF samples is depicted. Each dot represents a patient. Median with range is depicted. (D) Schematic of experimental setup. hBECs were infected with SARS-CoV-2 for 24 and 48 h. hLECs were infected with SARS-CoV-2 for 72 h. cDCs were treated with supernatants from hLECs, infected or not, for 24 and 48 h. Gene expression was evaluated in hBECs and cDCs (created with BioRender). (E–H) IFNL1 (E), IFNL2,3 (F), IFNB1 (G), and IFNA4 (H) mRNA expression was evaluated in hBECs 24 and 48 h after infection with SARS-CoV-2. Each dot represents a biological replicate. Median with range is depicted. Dashed line represents limit of detection. (I–L) IFNL1 (I), IFNL2,3 (J), IFNB1 (K), and IFNA4 (L) mRNA expression was evaluated in cDCs 24 and 48 h after treatment with supernatants of uninfected or SARS-CoV-2-infected hLECs. Each dot represent a technical replicate. Median with range is depicted. Dashed line represents limit of detection. ND, not detected. (M) Schematic of experimental setup. hBECs, PBMCs, monocytes, cDCs, and moDCs were treated for 24 h with 3p-hpRNA/LyoVec, cGAMP, CpG(C), LPS, poly (I:C), or R848 for stimulation of RIG-I, STING, TLR9, TLR4, TLR3, or TLR7/8, respectively. Cytokine expression was evaluated on RNA extracted from cell lysates, and cytokine production was evaluated in supernatants (created with BioRender). (N–O) Heatmap representation of IFN-α2, IFN-β, IFN-γ, IFN-λ1, and IFN-λ2,3 production by hBECs (N) or cDCs (O) 24 h after treatment. The color is proportional to the log10-transformed concentration (pg/mL) of each cytokine. (N) Rows in each group represent a biological replicate. (O) Rows in each group represent different donors as depicted in the annotation. Expression is plotted as log2 (gene/HPRT1 or GAPDH mRNA + 0.5 × gene-specific minimum) (E–L). Statistics by two-way ANOVA: ns, not significant (p > 0.05); p < 0.05; ∗∗p < 0.01; ∗∗∗p < 0.001; ∗∗∗∗p < 0.0001 (C) or one-way ANOVA with Dunnett’s post hoc test: ns, not significant (p > 0.05); p < 0.05; ∗∗p < 0.01; ∗∗∗p < 0.001; ∗∗∗∗p < 0.0001 (E–L). See also Figure S7 and STAR Methods.
Figure S7
Figure S7
Epithelial and immune cells dictate the IFN landscape, related to Figure 7 (A-B) Sunburst plots representing cell population fractions in Swabs (A) and BALF (B) as identified in Figure 7A, B. (C-E) SARS-CoV-2 E gene (C), IL1B (D), IL6 (E) mRNA expression was evaluated in hBECs 24 and 48 hours after infection with SARS-CoV-2. Each dot represents a biological replicate. Median with range is depicted. Dashed line represents limit of detection. (F-G) IL1B (F), IL6 (G) mRNA expression was evaluated in cDCs 24 and 48 hours after treatment with supernatants of uninfected or SARS-CoV-2-infected hLECs. Each dot represents a biological replicate. Median with range is depicted. Dashed line represents limit of detection. (H-J) hBECs were treated with 3p-hpRNA/LyoVec, cGAMP, CpG(C), LPS, Poly (I:C) and R848 for stimulation of RIG-I, STING, TLR9, TLR4, TLR3 and TLR7/8 respectively. (H) Heatmap representation of IFNL2,3, IFNL1, IFNB1, IFNA2, CCL5, OASL1, IL6, TNF and IL1B mRNA expression 24 hours after treatment. The color is proportional to Log2 (Fold Change) of each gene. Rows in each group represent biological replicates distributed as indicated in the legend. (I) IFN-λ1 and IFN-λ2,3 production by hBECs treated for 24h with PRR ligands. Poly (I:C) (TLR3), 3p-hpRNA/LyoVec (RIG-I) and transfected Poly (I:C) (RIG-I/MDA5) were used. Each dot represents a biological replicate. Median with range is depicted. (J) Heatmap representation of IL-8, CXCL10, IL-6 and IL-1β production 24 hours after stimulation. The color is proportional to the Log10 transformed concentration (pg/ml) of each cytokine. Rows in each group represent a biological replicate. (K-M) Heatmap representation of IFN-α2, IFN-β, IFN-γ, IFN-λ1 and IFN-λ2,3 production by PMBCs (K), Monocytes (L), moDCs (M) 24 hours after treatment. The color is proportional to the Log10 transformed concentration (pg/ml) of each cytokine. (N) Heatmap representation of IL-1β, IL-6, TNF-α, IL-8, IL-12p70, GMCSF, IL-10 and CXCL10 production cDCs 24 hours after treatment. (J-N) The color is proportional to the Log10 transformed concentration (pg/ml) of each cytokine. Rows in each group represent different donors as depicted in the annotation on the right. (C-E, F, G) Expression is plotted as log2 (gene/HPRT1 or GAPDH mRNA + 0.5 x gene-specific minimum). Statistics: (C-E, F,G, I) One-Way ANOVA with Dunnett’s post hoc test: ns, not significant (p > 0.05); p < 0.05, ∗∗p < 0.01, ∗∗∗p < 0.001, and ∗∗∗∗p < 0.0001. See also STAR Methods.

Update of

References

    1. Banerjee A.K., Blanco M.R., Bruce E.A., Honson D.D., Chen L.M., Chow A., Bhat P., Ollikainen N., Quinodoz S.A., Loney C. SARS-CoV-2 Disrupts Splicing, Translation, and Protein Trafficking to Suppress Host Defenses. Cell. 2020;183:1325–1339.e21. - PMC - PubMed
    1. Bastard P., Rosen L.B., Zhang Q., Michailidis E., Hoffmann H.H., Zhang Y., Dorgham K., Philippot Q., Rosain J., Béziat V., HGID Lab. NIAID-USUHS Immune Response to COVID Group. COVID Clinicians. COVID-STORM Clinicians. Imagine COVID Group. French COVID Cohort Study Group. Milieu Intérieur Consortium. CoV-Contact Cohort. Amsterdam UMC Covid-19 Biobank. COVID Human Genetic Effort Autoantibodies against type I IFNs in patients with life-threatening COVID-19. Science. 2020;370:eabd4585. - PMC - PubMed
    1. Bergamaschi L., Mescia F., Turner L., Hanson A.L., Kotagiri P., Dunmore B.J., Ruffieux H., De Sa A., Huhn O., Morgan M.D., Cambridge Institute of Therapeutic Immunology and Infectious Disease-National Institute of Health Research (CITIID-NIHR) COVID BioResource Collaboration Longitudinal analysis reveals that delayed bystander CD8+ T cell activation and early immune pathology distinguish severe COVID-19 from mild disease. Immunity. 2021;54:1257–1275.e8. - PMC - PubMed
    1. Blanco-Melo D., Nilsson-Payant B.E., Liu W.C., Uhl S., Hoagland D., Møller R., Jordan T.X., Oishi K., Panis M., Sachs D. Imbalanced Host Response to SARS-CoV-2 Drives Development of COVID-19. Cell. 2020;181:1036–1045.e9. - PMC - PubMed
    1. Broggi A., Ghosh S., Sposito B., Spreafico R., Balzarini F., Lo Cascio A., Clementi N., De Santis M., Mancini N., Granucci F., Zanoni I. Type III interferons disrupt the lung epithelial barrier upon viral recognition. Science. 2020;369:706–712. - PMC - PubMed

Publication types

MeSH terms