. 2021 Oct:105:136-147.
doi: 10.1016/j.reprotox.2021.09.002. Epub 2021 Sep 4.

Prenatal alcohol exposure disrupts Sonic hedgehog pathway and primary cilia genes in the mouse neural tube

Affiliations

Prenatal alcohol exposure disrupts Sonic hedgehog pathway and primary cilia genes in the mouse neural tube

Karen E Boschen et al. Reprod Toxicol. 2021 Oct.

Abstract

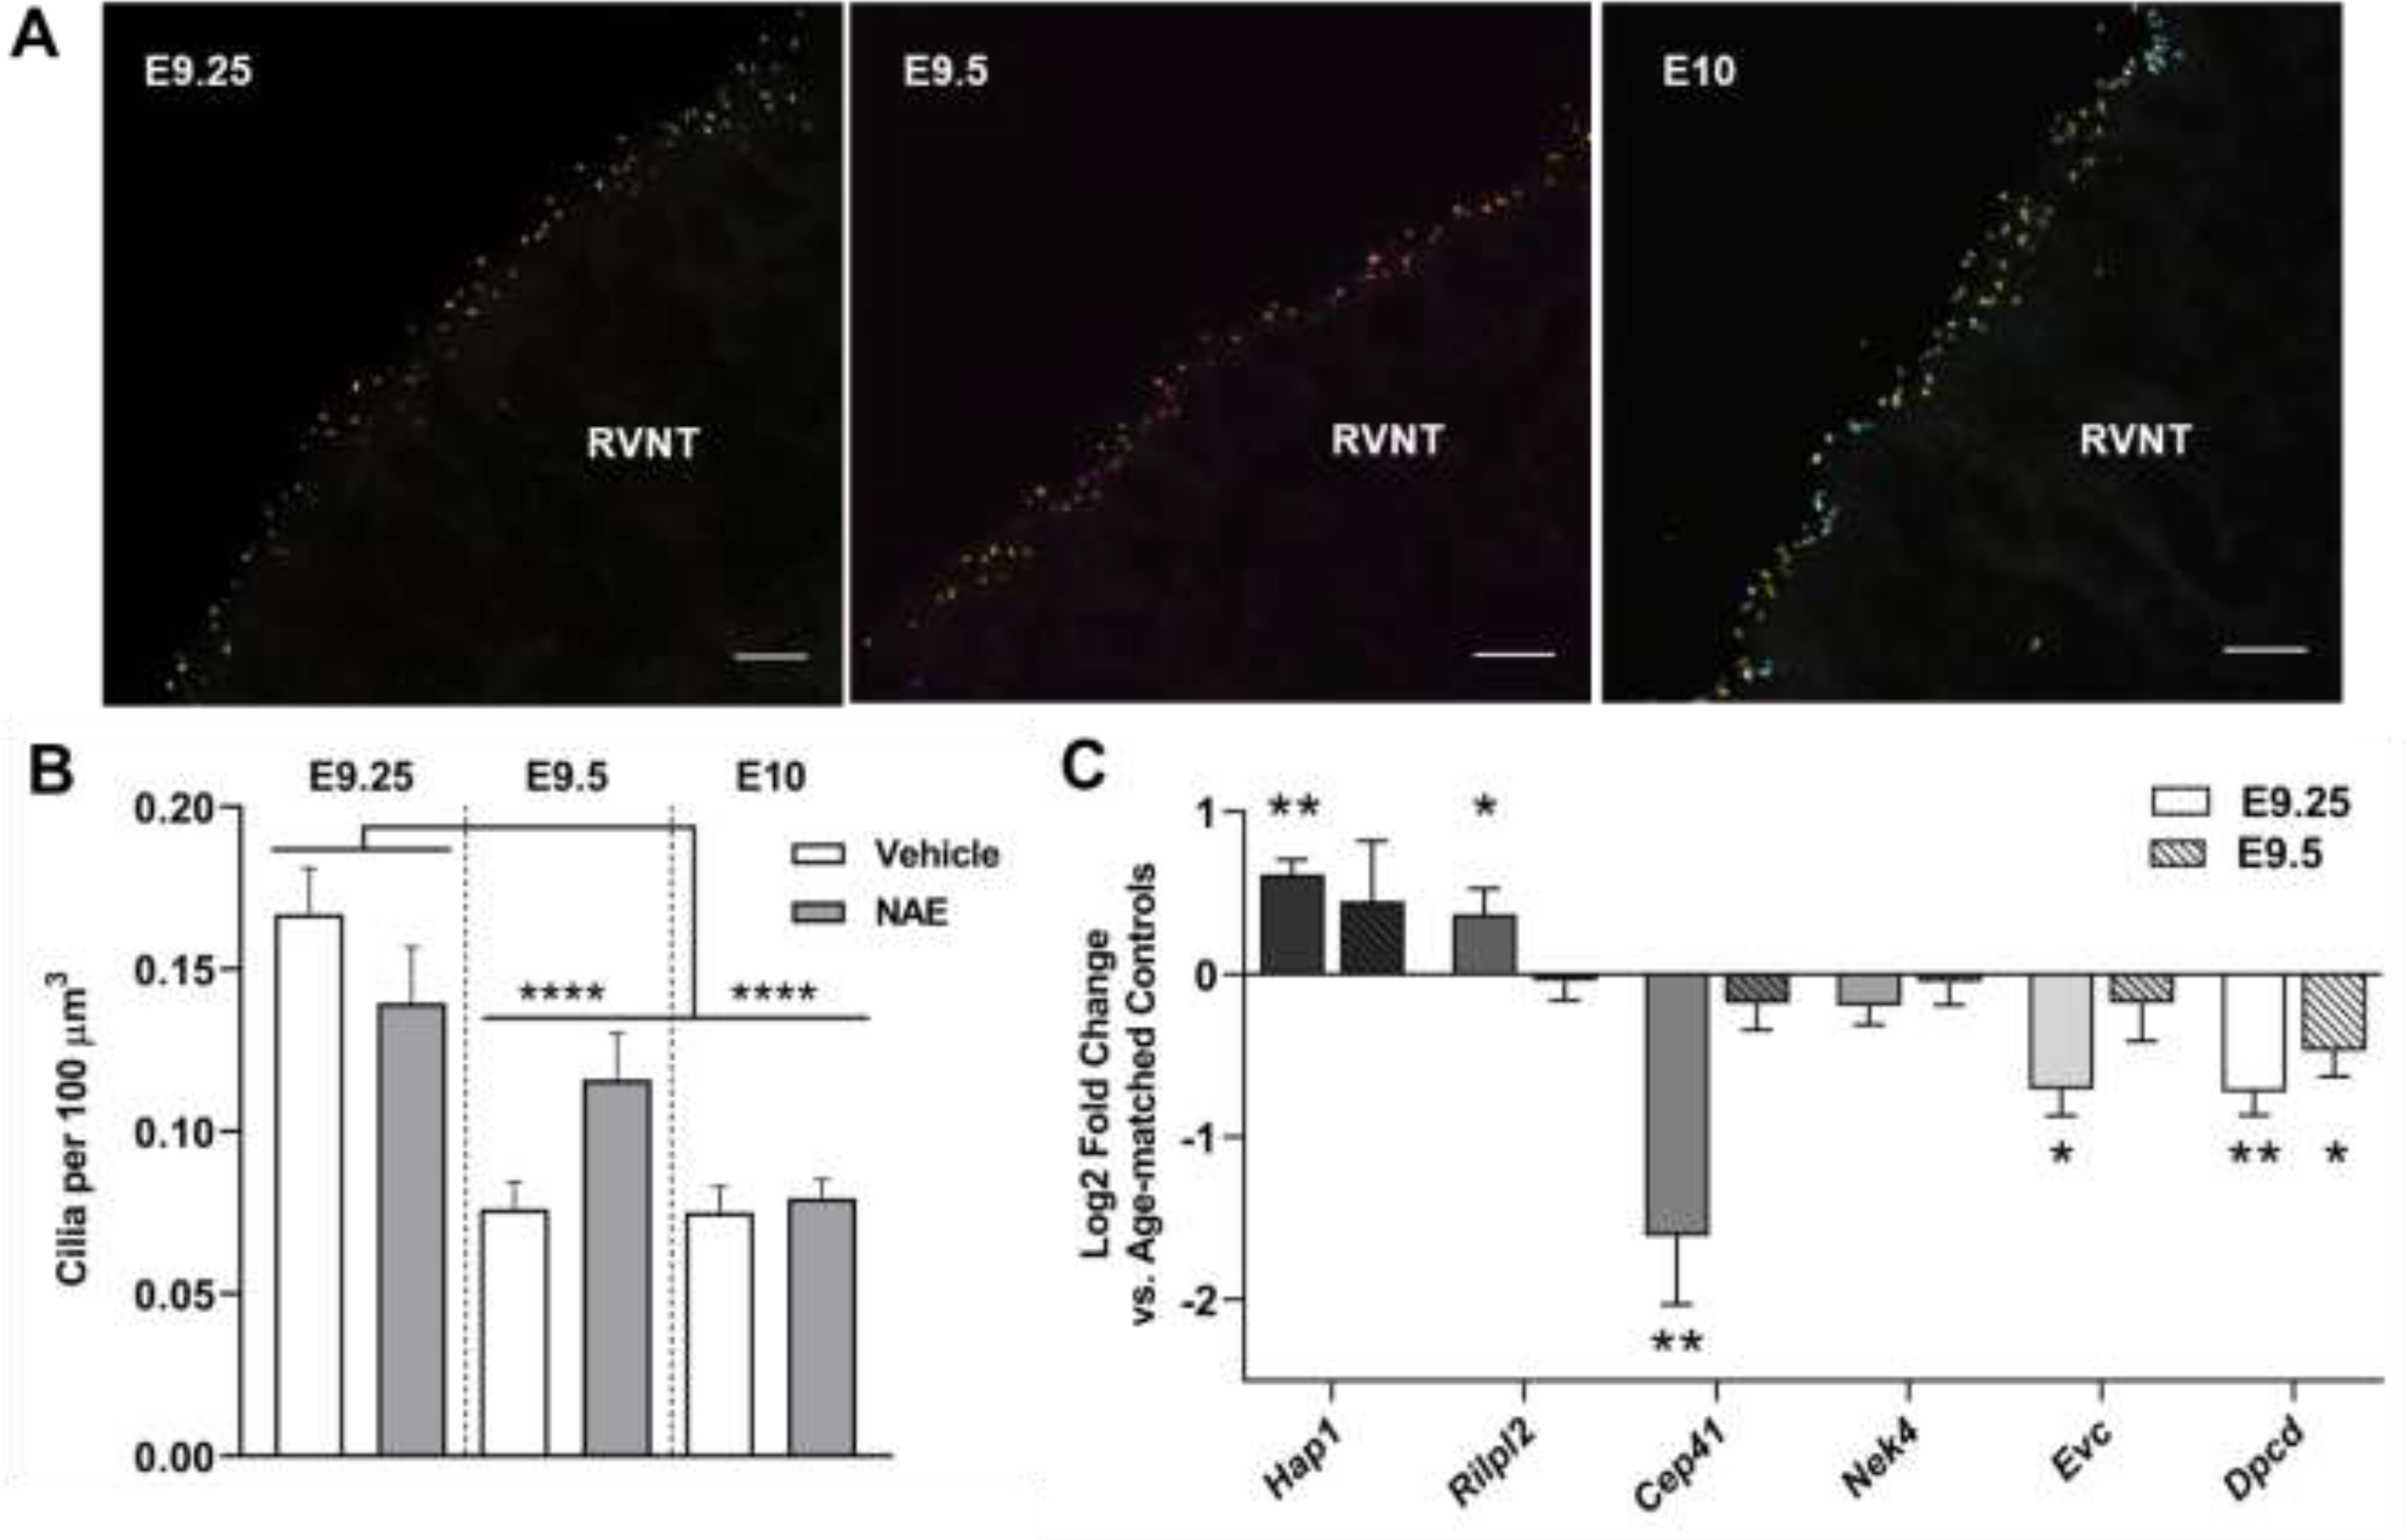
Neurulation-stage alcohol exposure (NAE; embryonic day [E] 8-10) is associated with midline craniofacial and CNS defects that likely arise from disruption of morphogen pathways, such as Sonic hedgehog (Shh). Notably, midline anomalies are also a hallmark of genetic ciliopathies such as Joubert syndrome. We tested whether NAE alters Shh pathway signaling and the number and function of primary cilia, organelles critical for Shh pathway transduction. Female C57BL/6 J mice were administered two doses of alcohol (2.9 g/kg/dose) or vehicle on E9. Embryos were collected 6, 12, or 24 h later, and changes to Shh, cell cycle genes, and primary cilia were measured in the rostroventral neural tube (RVNT). Within the first 24 h post-NAE, reductions in Shh pathway and cell cycle gene expression and the ratio of Gli3 forms in the full-length activator state were observed. RVNT volume and cell layer width were reduced at 12 h. In addition, altered expression of multiple cilia-related genes was observed at 6 h post-NAE. As a further test of cilia gene-ethanol interaction, mice heterozygous for Kif3a exhibited perturbed behavior during adolescence following NAE compared to vehicle-treated mice, and Kif3a heterozygosity exacerbated the hyperactive effects of NAE on exploratory activity. These data demonstrate that NAE downregulates the Shh pathway in a region of the neural tube that gives rise to alcohol-sensitive brain structures and identifies disruption of primary cilia function, or a "transient ciliopathy", as a possible cellular mechanism of prenatal alcohol pathogenesis.

Keywords: Cell cycle; Development; Fetal alcohol spectrum disorders; Kif3a; Neurulation.


Conflict of interest statement

Competing interests

The authors have no conflicts of interest to report.

Figures

Fig 1.
Fig 1.. Neurulation-stage alcohol exposure (NAE) decreases Shh pathway activation in the RVNT.
A) NAE resulted in downregulation of Shh and Gli1 within 24 hr post-exposure (n = 7–10 embryos per group). Shh expression was significantly reduced 6 and 12 hr after NAE. Expression of Gli2 did not differ. Brackets indicate a significant main effect of prenatal treatment. Gene expression data are the log2 fold change compared to somite-matched embryos from the vehicle group (expressed as 0 on the graph) ± SEM. B) The relative percentage of Gli3Rep to Gli3FL was significantly higher in NAE embryos (n = 7 litters) compared to the vehicle group (n = 6 litters) 12 hr after exposure. Data are expressed as the average Gli3FL or Gli3Rep band density expressed as a percentage of total Gli3. Below are representative bands of Gli3FL (190 kDa) and GliRep (83 kDa). Full blot and loading control GAPDH (37 kDa) can be seen in S1 Fig. * = p < 0.05, ** = p < 0.01.
Fig 2.
Fig 2.. NAE decreases expression of Shh-mediated cell proliferation genes in the RVNT and reduces RVNT volume.
A) NAE reduced expression of key Shh-mediated genes important for cell proliferation processes (n = 6–10 embryos per group) within 24 hr post-exposure. Brackets indicate main effects of prenatal treatment (Table 1). Gene expression data are the log2 fold change compared to the vehicle group (expressed as 0 on the graph) ± SEM. B) RVNT volume is significantly reduced in NAE embryos (filled bars, n = 7) compared to vehicle-treated embryos (open bars, n= 9) 12 hr after exposure, but did not differ at the other two time points. E10 RVNTs were also significantly larger than both E9.25 and E9.5. C) Cell layer width did not differ based on prenatal treatment but did increase over time, with E10 embryos exhibiting wider RVNT cell layers compared to both E9.25 and E9.5 embryos. D) Representative images of the RVNT of E9.5 vehicle-treated vs. NAE embryos taken with a 10x lens. Scale bar = 100 μm. * = p < 0.05, ** = p < 0.01, *** = p < 0.001, **** = p < 0.0001, all values expressed as mean + SEM.
Fig 3.
Fig 3.. NAE alters expression of cilia-related genes in the RVNT but does not alter cilia density.
A) Primary cilia in the RVNT were labeled with an anti-Arl13b antibody and stacks were compressed to visualize cilia throughout the depth of the tissue in a single image. Cilia in the images are pseudo-colored, scale bar = 10 μm. B) Cilia density did not differ at any of the time points, but did decrease across time points, as E9.5 and E10 had lower cilia density compared to E9.25 (n = 6–9). ** = p < 0.01, **** = p < 0.0001, all values are expressed as mean + SEM. All gene expression data are the log2 fold change compared to the vehicle group (expressed as 0 on the graph) ± SEM. C) NAE resulted in significant changes to expression levels of genes related to ciliogenesis and post-transcriptional modifications to ciliary tubulin, as well as genes implicated in genetic ciliopathies 6 hr after exposure. At 12 hr post-exposure, all genes had returned to baseline expression levels except for Dpcd, which remained significantly downregulated. E10 expression was not evaluated based on the return to baseline observed for almost all genes at E9.5. Encoded proteins associated with these genes can be found in Table 2. For E9.25, n = 5–8/group; E9.5: n = 10–12/group. * = p < 0.05, ** = p < 0.01. Data are expressed as log2 fold change compared to the vehicle group (expressed as 0 on the graph) ± SEM.
Fig 4.
Fig 4.. Partial loss of cilia motor transport gene Kif3a phenocopies and potentiates the effect of NAE on behavioral performance in adolescent male mice.
A) Vehicle-treated Kif3a+/− and NAE WT mice made more arm entries on the EPM than did vehicle-treated WT mice. B) Vehicle-treated and NAE Kif3a+/− mice spent a greater percentage of time on the open arms vs. vehicle-treated WT mice. C) Percent of entries into the open arms was not significantly affected by genotype or treatment. D-F) Significant (p < 0.05) post hoc’s are shown as letters on each graph. a: vs. vehicle-treated WT, b: vs. vehicle-treated Kif3a+/−, c: vs. NAE WT. D) NAE Kif3a+/− mice were more active than vehicle-treated WT mice during all time bins and were more active than NAE WT mice during the 2nd and 4th bins and more active than vehicle-treated Kif3a+/− mice during the final bin. Bracket = genotype x treatment interaction. NAE Kif3a+/− mice had more total beam breaks compared to the NAE WT and vehicle Kif3a+/− mice. E) NAE mice traveled further in the center of the open field compared to vehicle-treated mice. In addition, NAE Kif3a+/− mice traveled further than NAE WT or vehicle Kif3a+/− groups. Bracket = main effect of treatment. F) NAE animals spent more time in the center of the chamber compared to vehicle-treated mice across time, and NAE Kif3a+/− mice spending more time in the center compared to both NAE WT and vehicle Kif3a+/− mice. Bracket = main effect of treatment. For all groups, n’s = 11–15 litters, with same genotype littermates averaged into a single datum for each litter. For all graphs, * = p < 0.05, ** = p < 0.01, *** = p < 0.001. All data are shown as group means + SEM.
Fig 5.
Fig 5.. Schematic of a primary cilium.
This representation of the primary cilium includes the axoneme, basal body, and centriole and displays differentially expressed genes related to cilia structure/ciliogenesis/protein trafficking 6 hr post-exposure and the Shh pathway and cilia function 6–24 hr post-exposure. Orange outlines indicate upregulated genes whereas blue outlines denote genes that were downregulated by NAE.

Similar articles

Cited by

References

    1. May PA, Chambers CD, Kalberg WO, Zellner J, Feldman H, Buckley D, Kopald D, Hasken JM, Xu R, Honerkamp-Smith G, Prevalence of fetal alcohol spectrum disorders in 4 US communities, JAMA 319(5) (2018) 474–482. - PMC - PubMed
    1. Cook CS, Nowotny AZ, Sulik KK, Fetal alcohol syndrome: eye malformations in a mouse model, Archives of Ophthalmology 105(11) (1987) 1576–1581. - PubMed
    1. Godin EA, O’Leary Moore SK, Khan AA, Parnell SE, Ament JJ, Dehart DB, Johnson BW, Allan Johnson G, Styner MA, Sulik KK, Magnetic Resonance Microscopy Defines Ethanol Induced Brain Abnormalities in Prenatal Mice: Effects of Acute Insult on Gestational Day 7, Alcoholism: Clinical and Experimental Research 34(1) (2010) 98–111. - PMC - PubMed
    1. Suttie M, Wetherill L, Jacobson SW, Jacobson JL, Hoyme HE, Sowell ER, Coles C, Wozniak JR, Riley EP, Jones KL, Facial curvature detects and explicates ethnic differences in effects of prenatal alcohol exposure, Alcoholism: Clinical and Experimental Research (2017). - PMC - PubMed
    1. Dunty WC, Chen S.y., Zucker RM, Dehart DB, Sulik KK, Selective Vulnerability of Embryonic Cell Populations to Ethanol Induced Apoptosis: Implications for Alcohol Related Birth Defects and Neurodevelopmental Disorder, Alcoholism: Clinical and Experimental Research 25(10) (2001) 1523–1535. - PubMed

Publication types