. 2021 Sep 8;21(1):925.
doi: 10.1186/s12879-021-06589-4.

From first to second wave: follow-up of the prospective COVID-19 cohort (KoCo19) in Munich (Germany)

Collaborators, Affiliations

From first to second wave: follow-up of the prospective COVID-19 cohort (KoCo19) in Munich (Germany)

Katja Radon et al. BMC Infect Dis. .

Abstract

Background: In the 2nd year of the COVID-19 pandemic, knowledge about the dynamics of the infection in the general population is still limited. Such information is essential for health planners, as many of those infected show no or only mild symptoms and thus, escape the surveillance system. We therefore aimed to describe the course of the pandemic in the Munich general population living in private households from April 2020 to January 2021.

Methods: The KoCo19 baseline study took place from April to June 2020 including 5313 participants (age 14 years and above). From November 2020 to January 2021, we could again measure SARS-CoV-2 antibody status in 4433 of the baseline participants (response 83%). Participants were offered a self-sampling kit to take a capillary blood sample (dry blood spot; DBS). Blood was analysed using the Elecsys® Anti-SARS-CoV-2 assay (Roche). Questionnaire information on socio-demographics and potential risk factors assessed at baseline was available for all participants. In addition, follow-up information on health-risk taking behaviour and number of personal contacts outside the household (N = 2768) as well as leisure time activities (N = 1263) were collected in summer 2020.

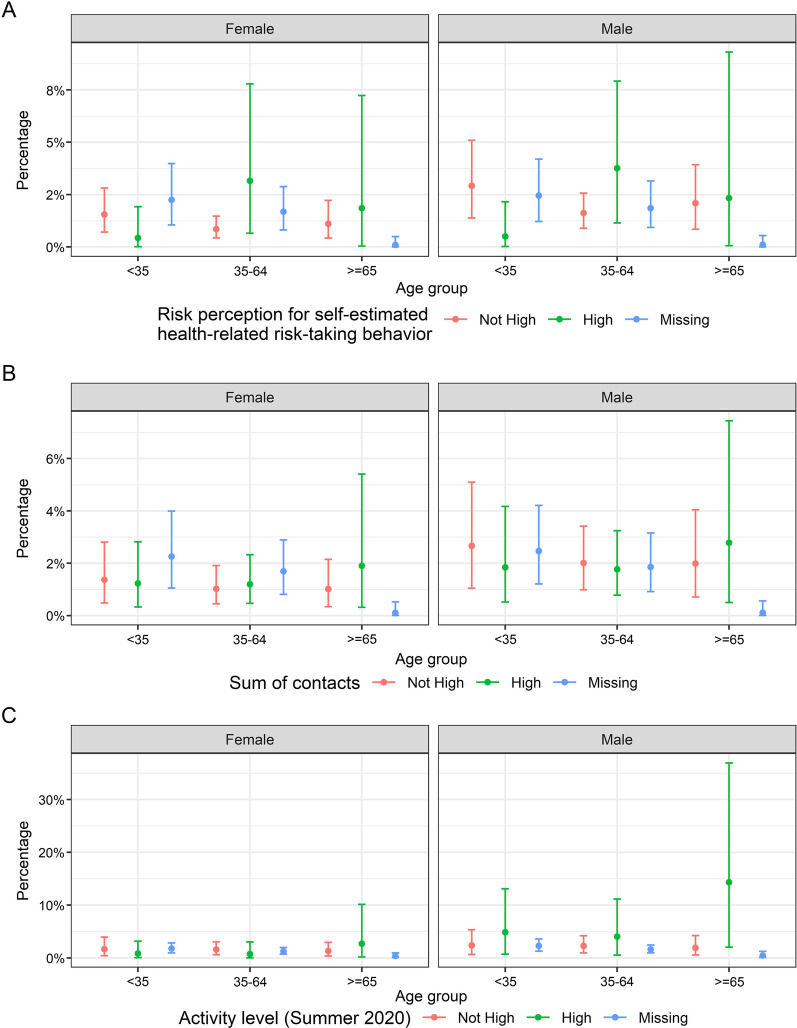
Results: Weighted and adjusted (for specificity and sensitivity) SARS-CoV-2 sero-prevalence at follow-up was 3.6% (95% CI 2.9-4.3%) as compared to 1.8% (95% CI 1.3-3.4%) at baseline. 91% of those tested positive at baseline were also antibody-positive at follow-up. While sero-prevalence increased from early November 2020 to January 2021, no indication of geospatial clustering across the city of Munich was found, although cases clustered within households. Taking baseline result and time to follow-up into account, men and participants in the age group 20-34 years were at the highest risk of sero-positivity. In the sensitivity analyses, differences in health-risk taking behaviour, number of personal contacts and leisure time activities partly explained these differences.

Conclusion: The number of citizens in Munich with SARS-CoV-2 antibodies was still below 5% during the 2nd wave of the pandemic. Antibodies remained present in the majority of SARS-CoV-2 sero-positive baseline participants. Besides age and sex, potentially confounded by differences in behaviour, no major risk factors could be identified. Non-pharmaceutical public health measures are thus still important.

Keywords: COVID-19; ORCHESTRA; Population-based cohort study; SARS-CoV-2; Sero-incidence; Sero-prevalence.


Conflict of interest statement

In addition to the funding disclosed in the funding section, DM and VT are sub-investigators vaccines trials sponsored by Curevac AG. LO received non-financial support from Dr. Box Betrobox and grants from the Bavarian State Ministry of Science and the Arts during the conduct of the study. CR received royalities from Elsevier LTD for the textbook “Clinical Cases in Tropical Medicine”. She also received honoraria for lectures done at non-private academic institutions. CR is also chair of the “Travel medicine” board of the of the German Society for the Tropical Medicine, Travel Medicine and global health (unpaid) and member of the permanent committee on vaccinations at the Robert-Koch-Institute work group on travel vaccinations (unpaid). AW is on Roche Diagnostics and Roche Pharma Advisory Boards related SARS-CoV-2. The Bundeswehr Institute of Microbiology (RW) received research funding from the Medical Biodefence program of the Bundeswehr. The funders had no role in study design, data collection, data analyses, data interpretation, writing, or submission of this manuscript.

Figures

Fig. 1
Fig. 1
Flow chart of obtaining the study population. Light blue boxes indicate the total number of participants and households in the baseline study, the light green box refers to subjects included in the sero-prevalence analyses of the data, dark green boxes indicate analyses restricted to sero-incidence data for subjects with complete leisure time information (left) and risk behaviour data (right)
Fig. 2
Fig. 2
Weighted sero-prevalence and sero-incidence in % at follow-up adjusted (orange) and unadjusted (blue) for test specificity and sensitivity. The unadjusted weighted sero-prevalence was 3.4%, the relative number of new cases between baseline and follow-up 1.7%. Adjustment only slightly changed the unadjusted results
Fig. 3
Fig. 3
For sensitivity and specificity adjusted (left) and unadjusted (right) SARS-CoV-2 sero-prevalence over the follow-up period. The 95% confidence intervals for the weekly sero-prevalence were based on the 2.5 and 97.5 percentiles from 5000 repetitions of a cluster bootstrap that accounts for within household clustering. The estimates do not account for sample weights. The estimation without accounting for within-household clustering but considering sample weights produced similar trends (Additional file 1: Figure S1). A slight increase of sero-prevalence is indicated from the first to the fourth week of follow-up. The huge increase from week 4 to weeks 5–11 has to be taken with caution, as during these weeks, participants with intermediate results in the DBS (of whom 50% turned out to be positive in plasma sampling) were be retested by plasma-sampling during this time interval. The upward trend without these participants is shown in Additional file 1: Figures S1 and S2
Fig. 4
Fig. 4
Geospatial distribution of the crude SARS-CoV-2 sero-positivity across boroughs in Munich. A Population density (taken from https://simple.wikipedia.org/wiki/Boroughs_of_Munich) and number of participants in each city borough; B Weighted sample based SARS-CoV-2 sero-prevalence; C Lower 95% confidence bounds of the weighted SARS-CoV-2 sero-prevalence; D Upper 95% confidence bounds of the weighted SARS-CoV-2 sero-prevalence. The sero-positivity varied slightly across the boroughs (as indicated by different colours), however, differences did not reach statistical significance
Fig. 5
Fig. 5
Association between potential risk factors and SARS-CoV-2 sero-positivity taking into account time between 1st and 2nd sampling, baseline result, age and sex. Age and sex was also adjusted for time between 1st and 2nd sampling, baseline result and each other (sex for age and age for sex). Unimputed (blue) and imputed (orange) GLM Models (Bayesian analysis). Main individual level risk factors were time and sex. Odds decreased by age and was lower for participants living in buildings with 3–4 apartments. Changes in the estimates by imputation were small
Fig. 6
Fig. 6
Proximity clustering of test outcomes at 2nd sampling. The grey points and curves show the distribution of mean within-cluster variances for 10,000 random permutations of cluster assignments, the horizontal lines show the observed values. Cluster variables are households, buildings, and geospatial clusters of different sizes. Household membership was left invariant when considering buildings and geospatial clusters. P-values indicate the one-sided probability of observing smaller than observed values under random cluster assignments. Results indicate within household clustering but are not suggestive for neighbourhood transmission
Fig. 7
Fig. 7
Sero-incidence of SARS-CoV-2 between baseline and follow-up by A self-estimated health-related risk-taking behaviour, B sum of contacts and C leisure time activities in summer 2020 stratified for sex and age group. Results suggest some role of behavioural factors in the risk of SARS-CoV-2 sero-positivity but differences are not statistically significant

References

    1. Rostami A, Sepidarkish M, Leeflang MMG, Riahi SM, Nourollahpour Shiadeh M, Esfandyari S, et al. SARS-CoV-2 seroprevalence worldwide: a systematic review and meta-analysis. Clin Microbiol Infect. 2021;27(3):331–340. doi: 10.1016/j.cmi.2020.10.020. - DOI - PMC - PubMed
    1. Lai CC, Wang JH, Hsueh PR. Population-based seroprevalence surveys of anti-SARS-CoV-2 antibody: an up-to-date review. Int J Infect Dis. 2020;101:314–322. doi: 10.1016/j.ijid.2020.10.011. - DOI - PMC - PubMed
    1. Pritsch M, Radon K, Bakuli A, Le Gleut R, Olbrich L, Guggenbuhl Noller JM, et al. Prevalence and risk factors of infection in the representative COVID-19 cohort Munich. Int J Environ Res Public Health. 2021 doi: 10.3390/ijerph18073572. - DOI - PMC - PubMed
    1. Radon K, Saathoff E, Pritsch M, Guggenbuhl Noller JM, Kroidl I, Olbrich L, et al. Protocol of a population-based prospective COVID-19 cohort study Munich, Germany (KoCo19) BMC Public Health. 2020;20(1):1036. doi: 10.1186/s12889-020-09164-9. - DOI - PMC - PubMed
    1. Olbrich L, Castelletti N, Schälte Y, Garí M, Pütz P, Bakuli A, et al. A serology strategy for epidemiological studies based on the comparison of the performance of seven different test systems—the representative COVID-19 cohort Munich. medRxiv. 2021;26:1033.