. 2021 Sep 7;13(1):146.
doi: 10.1186/s13073-021-00963-2.

The genomic architecture of EBV and infected gastric tissue from precursor lesions to carcinoma

Affiliations

The genomic architecture of EBV and infected gastric tissue from precursor lesions to carcinoma

Zhang-Hua Chen et al. Genome Med. .

Abstract

Background: Epstein-Barr virus (EBV)-associated gastric carcinomas (EBVaGCs) present unique molecular signatures, but the tumorigenesis of EBVaGCs and the role EBV plays during this process remain poorly understood.

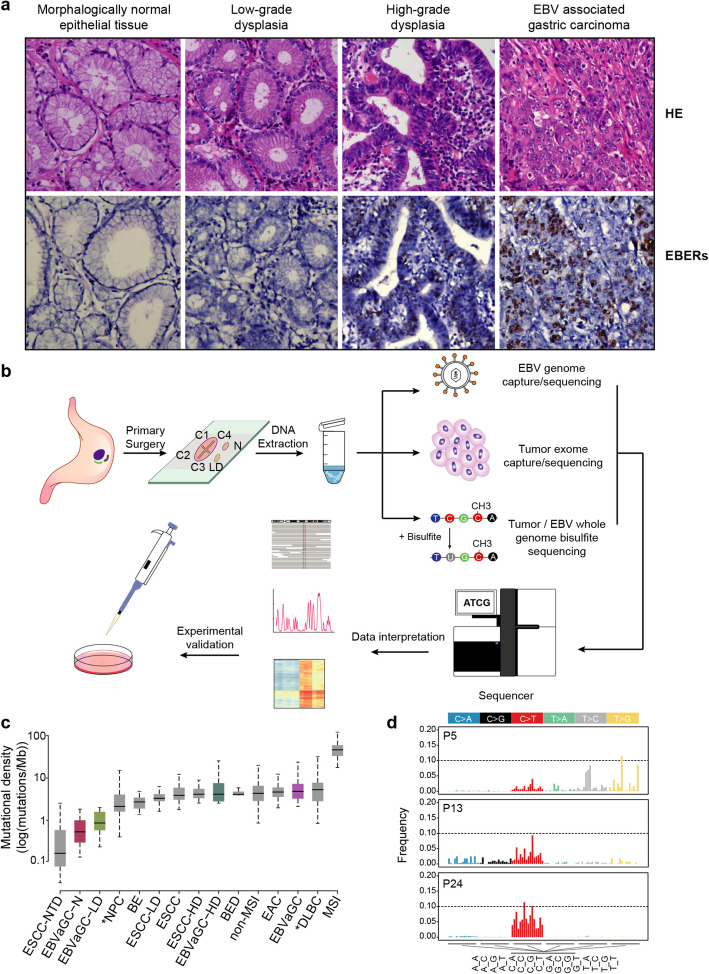
Methods: We applied whole-exome sequencing, EBV genome sequencing, and whole-genome bisulfite sequencing to multiple samples (n = 123) derived from the same patients (n = 25), which covered saliva samples and different histological stages from morphologically normal epithelial tissues to dysplasia and EBVaGCs. We compared the genomic landscape between EBVaGCs and their precursor lesions and traced the clonal evolution for each patient. We also analyzed genome sequences of EBV from samples of different histological types. Finally, the key molecular events promoting the tumor evolution were demonstrated by MTT, IC50, and colony formation assay in vitro experiments and in vivo xenograft experiments.

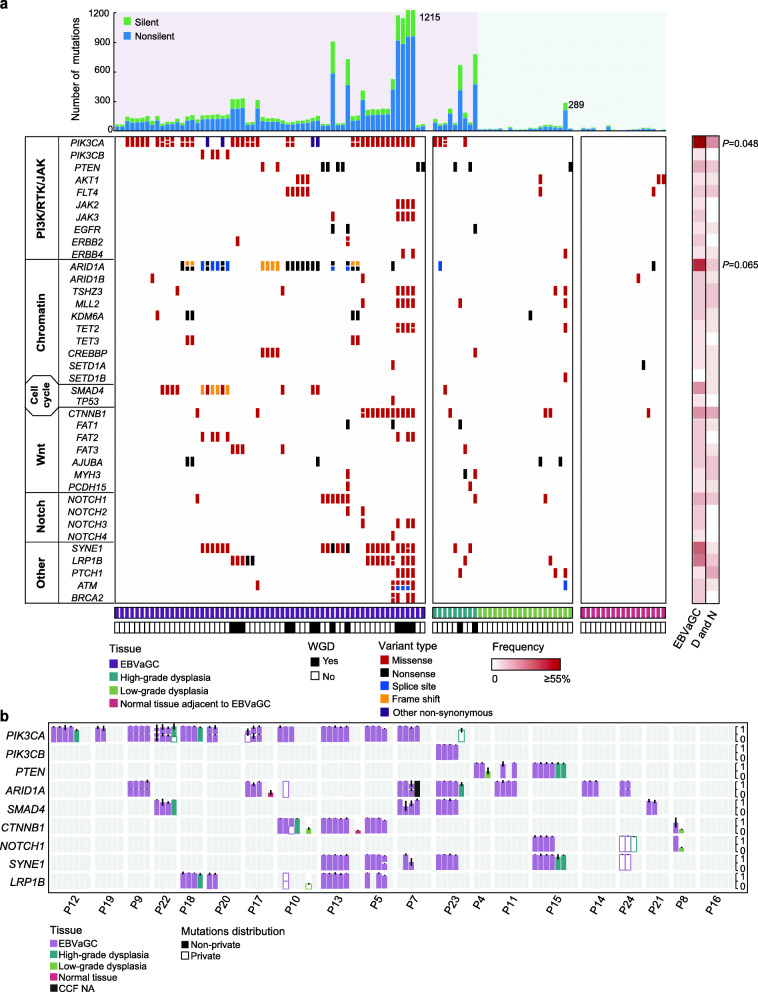
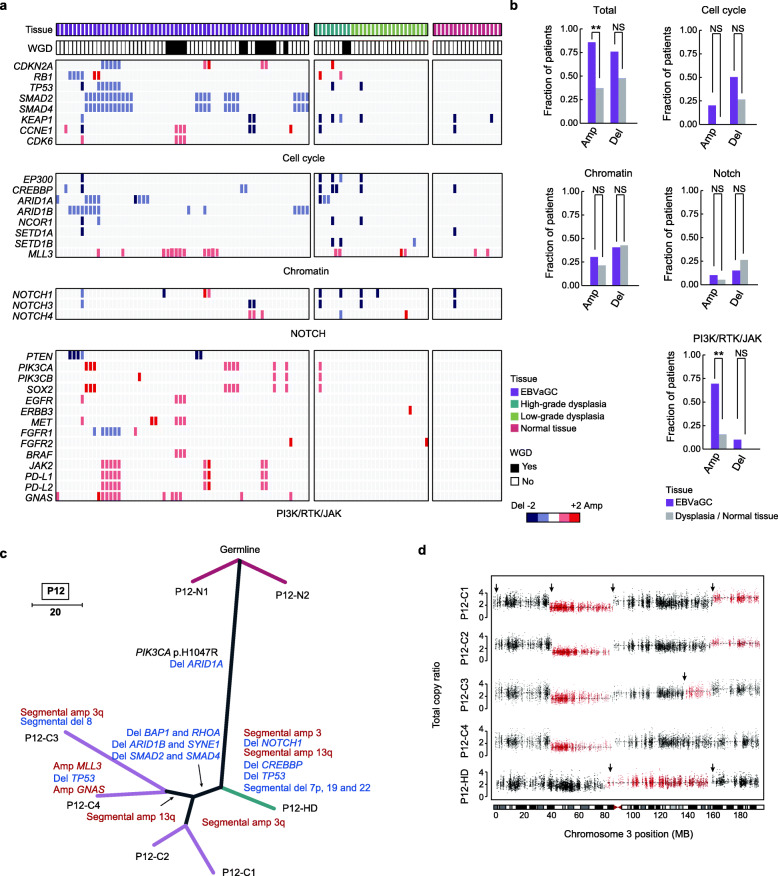
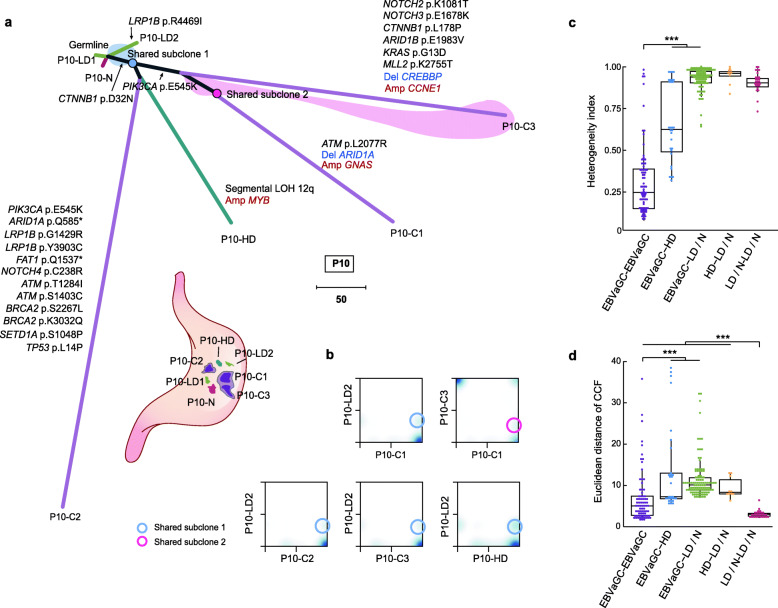
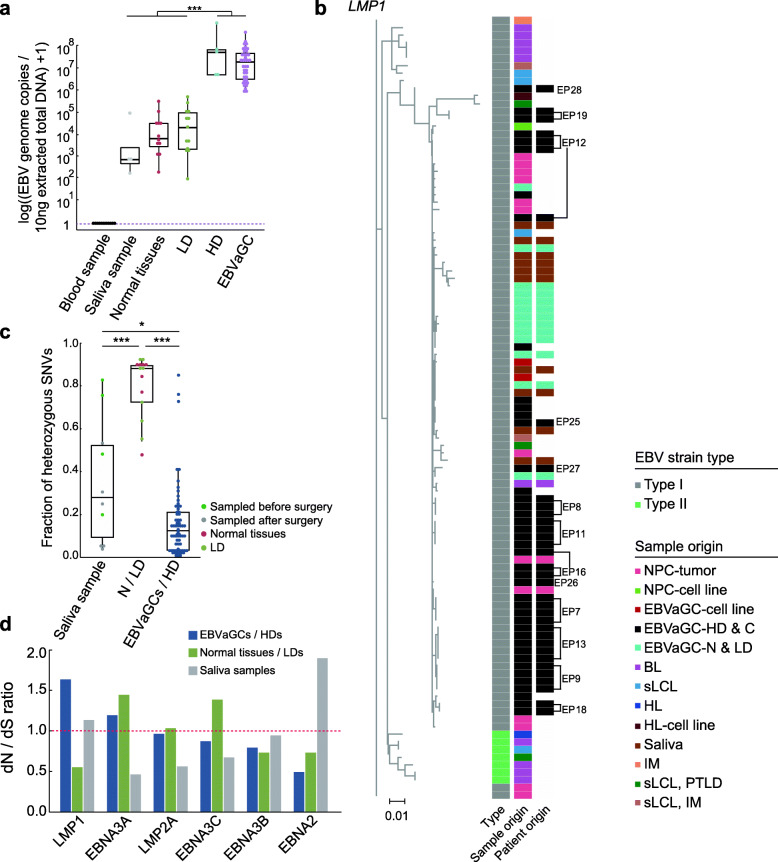
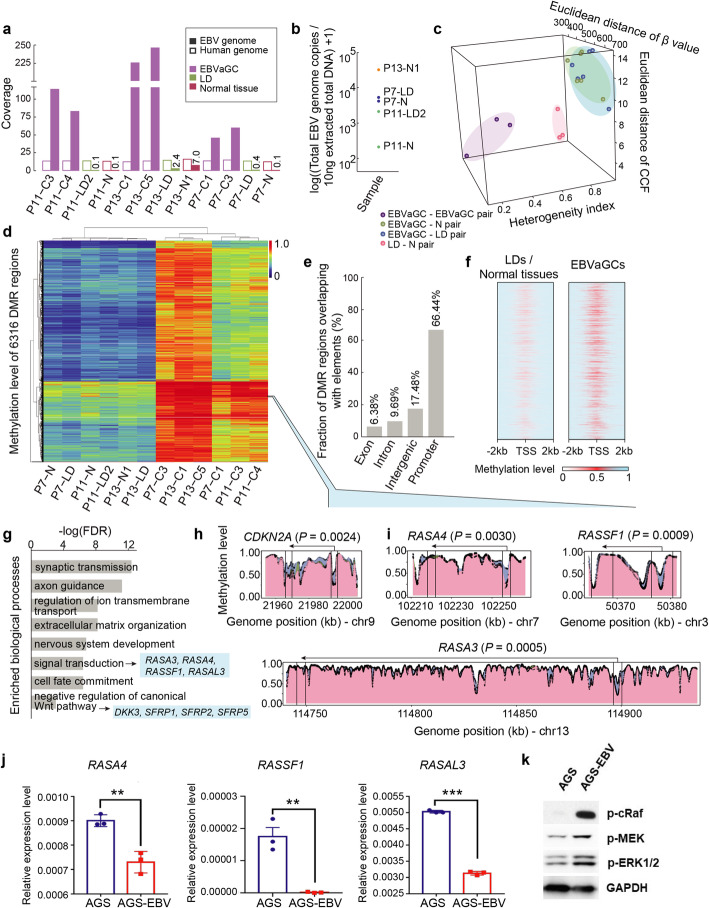
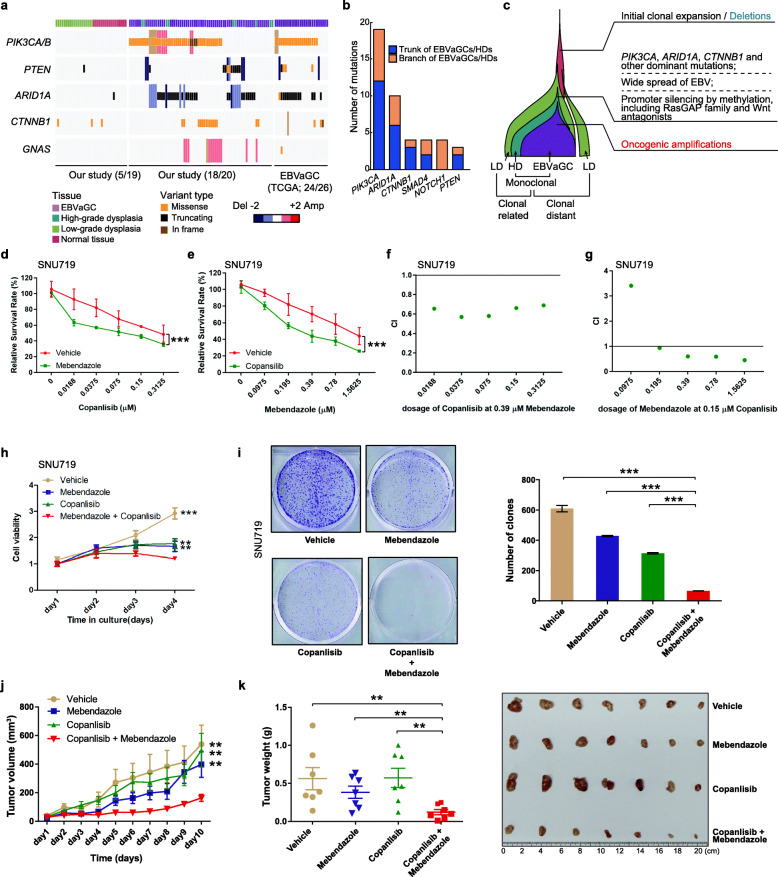
Results: Our analysis revealed increasing mutational burden and EBV load from normal tissues and low-grade dysplasia (LD) to high-grade dysplasia (HD) and EBVaGCs, and oncogenic amplifications occurred late in EBVaGCs. Interestingly, within each patient, EBVaGCs and HDs were monoclonal and harbored single-strain-originated EBV, but saliva or normal tissues/LDs had different EBV strains from that in EBVaGCs. Compared with precursor lesions, tumor cells showed incremental methylation in promotor regions, whereas EBV presented consistent hypermethylation. Dominant alterations targeting the PI3K-Akt and Wnt pathways were found in EBV-infected cells. The combinational inhibition of these two pathways in EBV-positive tumor cells confirmed their synergistic function.

Conclusions: We portrayed the (epi) genomic evolution process of EBVaGCs, revealed the extensive genomic diversity of EBV between tumors and normal tissue sites, and demonstrated the synergistic activation of the PI3K and Wnt pathways in EBVaGCs, offering a new potential treatment strategy for this disease.


Conflict of interest statement

The authors declare that they have no competing interests.

Figures

Fig. 1
Fig. 1
Mutational density and context of EBVaGCs and their precursor lesions. a Diagram showing the hematoxylin and eosin (HE)-stained (top) and in situ hybridization of Epstein-Barr-encoded RNA (bottom) sections of morphologically normal epithelial tissue (N), low-grade dysplasia (LD), high-grade dysplasia (HD), and EBV-associated gastric carcinoma (EBVaGC) from a representative patient P10. The magnification is 20-fold. b Schematic overview of the study design. Multiple regions covering different histological stages derived from the same patient were acquired. DNA was extracted and subjected to parallel genomic and epigenomic analyses for both host cells and EBV. c Comparison of the mutational density of normal tissues (n = 17), LDs (n = 19), HDs (n = 9), and EBVaGCs (n = 62) with other types of cancer. ESCC-NTD, esophageal squamous dysplasia from cancer-free patients (non-tumorous dysplasia, n = 13); NPC, nasopharyngeal carcinoma (n = 71); BE, non-dysplastic Barrett’s esophagus (n = 14); ESCC-LD, esophageal squamous low-grade dysplasia (n = 44); ESCC, esophageal squamous carcinoma (n = 62); ESCC-HD, esophageal squamous high-grade dysplasia (n = 31); BED, dysplastic Barrett’s esophagus (n = 11); non-MSI, non-microsatellite instable gastric carcinoma (n = 231); EAC, esophageal adenocarcinoma (n = 183); DLBC, diffuse large B cell lymphoma (n = 48); MSI, microsatellite instable gastric carcinoma (n = 64). Asterisk denotes other two EBV-positive cancer types. Box and whiskers denote the median, IQR, and 1.5 × IQR. The y-axis is shown on a log10-transformed scale. d Bar plots showing the mutational spectrum of three representative patients. Different colors denote the mutational direction, and the 3-bp mutational context are labeled below the x-axis
Fig. 2
Fig. 2
Mutational landscape of EBVaGCs, dysplasia samples, and normal tissues. a Top: the number of silent and non-silent mutations of each sample. Middle: somatic mutations (SNVs and INDELs) of EBVaGC-associated genes in different pathways. Genes are ranked by their mutated frequencies. Bottom: histological types and whole-genome doubling (WGD) status of each sample are indicated in different colors. Right: heatmap comparing mutated frequencies of each gene (row) in EBVaGCs and their precursor lesions over patients. The statistical significance is shown (Fisher’s exact test). b Bar plots showing the cancer cell fraction (CCF) of each mutation in recurrently mutated genes. Solid bars denote the mutations that are shared by multiple samples from the same patient. Hollow bars denote the mutations that are private in single samples. It should be noted that there existed multiple mutations in a specific gene within one sample, and these mutations are vertically stacked with an adjusted scale of CCF values. Different colors indicate different histological types. The standard deviation is indicated
Fig. 3
Fig. 3
Copy number alterations of driver genes. a Diagram exhibiting the deletions (blue) and amplifications (red) of putative driver genes in EBVaGCs, dysplasia samples, and normal tissues. The histological types and whole-genome doubling (WGD) status of each sample are indicated on the top. b Bar plots comparing the frequencies of amplifications and deletions of different pathways in EBVaGCs and their precursor lesions over patients. Fisher’s exact test, **P < 0.01; NS, not significant. c Phylogenetic tree for patient P12. The length of each line is proportional to the number of mutations and copy number alterations (CNAs). Gray lines represent the clonal mutations shared by multiple samples. d Dot plots displaying the total copy ratio of segments in the HD sample (P12-HD) and 4 EBVaGCs from P12. Different segments are marked by red and black in turn, and breakpoints between two segments are indicated. The chromosome ideograms are shown on the bottom
Fig. 4
Fig. 4
Phylogenetic relationships of multiples samples of representative patients. a Top: phylogenetic tree for patient P10. The length of each line is proportional to the number of mutations and copy number alterations (CNAs). Gray lines represent the clonal mutations shared by multiple samples. A subclone in one LD sample of P10 (P10-LD2) presenting as the common ancestor of all other histological advanced samples of P10, and another subclone shared by two EBVaGCs (P10-C1 and P10-C3) are indicated. The shaded area contains mutations present in the shared subclone on the corresponding branches. Bottom: geographical locations of all samples in patient P10. Histological types of all samples are indicated in different colors. b Two-dimensional density plots showing the CCF distribution of pairwise samples in P10. c Box plots depicting the heterogeneity index (HI) of pairwise samples in each patient. All pairwise samples are divided into 5 groups. Wilcoxon rank sum test, ***P < 0.001. d Box plots depicting the Euclidean distance of CCF of pairwise samples in each patient. Wilcoxon rank sum test, ***P < 0.001
Fig. 5
Fig. 5
Analysis of EBV genomes in the saliva, normal tissues/LDs, and EBVaGCs/HDs. a Box plots comparing the EBV genome copies in peripheral blood samples (n = 13), saliva samples (n = 4), normal tissues (n = 12), LDs (n = 13), HDs (n = 5), and EBVaGCs (39). The y-axis is shown on a log10-transformed scale. Wilcoxon rank sum test, ***P < 0.001. b Left: phylogenetic tree of LMP1 nucleotide sequence from EBV genomes. Right: heatmaps displaying the EBV strain type, sample origin, and patient origin. For HD and EBVaGC samples from the same patients, patient IDs were denoted beside the heatmap. The scale bar of the phylogenetic tree represents 0.01 nucleotide substitution per site. IM, infectious mononucleosis; sLCL, spontaneous lymphoblastoid cell line; EBVaGC, EBV-associated gastric carcinoma; NPC, nasopharyngeal carcinoma; BL, Burkitt’s lymphoma; HL, Hodgkin’s lymphoma; PTLD, post-transplant lymphoproliferative disease. c Box plots comparing the fractions of heterozygous single nucleotide variations (SNVs) on EBV genomes from the saliva samples (n = 10), normal tissue/LDs (n = 14), and EBVaGCs/HDs (n = 70). Wilcoxon rank sum test, *P < 0.05, ***P < 0.001. d Bar plots displaying the dN/dS ratios of the selected genes of EBV genomes in the saliva samples, normal tissue/LDs, and EBVaGCs/HDs. The dashed line indicates a dN/dS value of 1
Fig. 6
Fig. 6
Epigenomic profiling of EBV and host cells in EBVaGCs and their precursor lesions. a Bar plots showing the mean coverage of human (hollow bar) and EBV genomes (solid bar) in each sample. Histological types of samples are shown in different colors. b Dot plots of EBV genome copies in 5 normal tissues and LDs used for whole-genome bisulfite sequencing (WGBS). The LD sample in patient P13 (P13-LD) is not shown due to the lack of DNA for measurement of EBV genome copies by qPCR (see the “Methods” section). c Three-dimensional diagram showing the heterogeneity index, Euclidean distance of CCF, and Euclidean distance of methylation level (β value) between pairwise samples in each patient. All pairwise samples are divided into 4 groups. d Heatmap of 6316 differentially methylated regions (DMRs) between EBVaGCs and precursor lesions. e Bar plots of the fractions of DMRs overlapping with different genomic elements. f Diagram exhibiting the methylation level of DMRs encompassed by the region of transcript start site (TSS) ± 2000 bp in LDs and normal tissues (left) and EBVaGCs (right). g Enrichment of biological processes (Gene Ontology) for genes with hypermethylated promoters. Genes of interests were selected and indicated. h The promoter region of CDKN2A showing hypermethylation in EBVaGCs in comparison with that in normal tissues and LDs. Black dots represent each CpG site. Different colors of the areas indicate the histological types of samples (pink, normal tissues; green, LDs; blue, EBVaGCs). The transcription strand is indicated by the arrow orientation (left, reverse strand; right, forward strand). The statistical significance is shown (Student’s t test). i Genes encoding Ras GTPase-activating proteins (RasGAP) showing hypermethylated promotors in EBVaGCs in comparison with that in normal tissues and LDs. j Bar plots comparing the mRNA expression levels of RASA4, RASSF1A, and RASAL3 in AGS cell line with or without EBV infection. Student’s t test, **P < 0.01, ***P < 0.001. Data are shown as mean ± SD. k Western blotting of p-cRaf, p-MEK, and p-ERK1/2 in AGS cell line with or without EBV infection
Fig. 7
Fig. 7
Synergistic function of the PI3K-Akt and Wnt pathways in EBVaGCs. a Heatmap of the recurrently mutated genes in the PI3K and Wnt pathways in precursor lesions (left) and EBVaGCs (middle, our study; right, TCGA data). The histological types of each sample are indicated on the top. b Bar plots displaying the number of “trunk” (gray) or “branch” (green) mutations in the indicated driver genes. c Schematics summarizing the evolutionary process of EBVaGC. Key events promoting the developmental process are denoted. d The growth curve of SNU719 cells treated with the indicated doses of PI3K inhibitor (copanlisib) at the presence of Wnt pathway inhibitor (0.39 μM mebendazole) or vehicle (n = 3). e The growth curve of SNU719 cells treated with the indicated doses of Wnt pathway inhibitor (mebendazole) at the presence of PI3K inhibitor (0.15 μM copanlisib) or vehicle (n = 3). f The CI of SNU719 cells treated with the indicated doses of copanlisib at the presence of 0.39 μM mebendazole. g The CI of SNU719 cells treated with the indicated doses of mebendazole at the presence of 0.15 μM copanlisib. h The growth curve of SNU719 cells treated with either 0.5 μM copanlisib or 0.3 μM mebendazole, or the combination (n = 3). i Comparison of colony formation of SNU719 cells with different treatments or vehicle (n = 3). j Tumor growth curve of SNU719 xenografts with different treatments (copanlisib 6 mg/kg, mebendazole 20 mg/kg) or vehicle (7 mice per group). k Tumor weight of SNU719 xenografts with different treatments or vehicle (7 mice per group). All statistics were conducted using Student’s t test, *P < 0.05, **P < 0.01, ***P < 0.001. Data are shown as mean ± SD

References

    1. Torre LA, Bray F, Siegel RL, Ferlay J, Lortet-Tieulent J, Jemal A. Global cancer statistics, 2012. CA Cancer J Clin. 2015;65(2):87–108. doi: 10.3322/caac.21262. - DOI - PubMed
    1. Tsao SW, Tsang CM, To KF. Lo KW. The role of Epstein-Barr virus in epithelial malignancies. J Pathol. 2015;235(2):323–333. doi: 10.1002/path.4448. - DOI - PMC - PubMed
    1. Takada K. Epstein-Barr virus and gastric carcinoma. Mol Pathol. 2000;53(5):255–261. doi: 10.1136/mp.53.5.255. - DOI - PMC - PubMed
    1. Liu Y, Sethi NS, Hinoue T, Schneider BG, Cherniack AD, Sanchez-Vega F, Seoane JA, Farshidfar F, Bowlby R, Islam M, Kim J, Chatila W, Akbani R, Kanchi RS, Rabkin CS, Willis JE, Wang KK, McCall SJ, Mishra L, Ojesina AI, Bullman S, Pedamallu CS, Lazar AJ, Sakai R, Thorsson V, Bass AJ, Laird PW, Caesar-Johnson SJ, Demchok JA, Felau I, Kasapi M, Ferguson ML, Hutter CM, Sofia HJ, Tarnuzzer R, Wang Z, Yang L, Zenklusen JC, Zhang J(J), Chudamani S, Liu J, Lolla L, Naresh R, Pihl T, Sun Q, Wan Y, Wu Y, Cho J, DeFreitas T, Frazer S, Gehlenborg N, Getz G, Heiman DI, Kim J, Lawrence MS, Lin P, Meier S, Noble MS, Saksena G, Voet D, Zhang H, Bernard B, Chambwe N, Dhankani V, Knijnenburg T, Kramer R, Leinonen K, Liu Y, Miller M, Reynolds S, Shmulevich I, Thorsson V, Zhang W, Akbani R, Broom BM, Hegde AM, Ju Z, Kanchi RS, Korkut A, Li J, Liang H, Ling S, Liu W, Lu Y, Mills GB, Ng KS, Rao A, Ryan M, Wang J, Weinstein JN, Zhang J, Abeshouse A, Armenia J, Chakravarty D, Chatila WK, Bruijn I, Gao J, Gross BE, Heins ZJ, Kundra R, la K, Ladanyi M, Luna A, Nissan MG, Ochoa A, Phillips SM, Reznik E, Sanchez-Vega F, Sander C, Schultz N, Sheridan R, Sumer SO, Sun Y, Taylor BS, Wang J, Zhang H, Anur P, Peto M, Spellman P, Benz C, Stuart JM, Wong CK, Yau C, Hayes DN, Parker JS, Wilkerson MD, Ally A, Balasundaram M, Bowlby R, Brooks D, Carlsen R, Chuah E, Dhalla N, Holt R, Jones SJM, Kasaian K, Lee D, Ma Y, Marra MA, Mayo M, Moore RA, Mungall AJ, Mungall K, Robertson AG, Sadeghi S, Schein JE, Sipahimalani P, Tam A, Thiessen N, Tse K, Wong T, Berger AC, Beroukhim R, Cherniack AD, Cibulskis C, Gabriel SB, Gao GF, Ha G, Meyerson M, Schumacher SE, Shih J, Kucherlapati MH, Kucherlapati RS, Baylin S, Cope L, Danilova L, Bootwalla MS, Lai PH, Maglinte DT, van den Berg DJ, Weisenberger DJ, Auman JT, Balu S, Bodenheimer T, Fan C, Hoadley KA, Hoyle AP, Jefferys SR, Jones CD, Meng S, Mieczkowski PA, Mose LE, Perou AH, Perou CM, Roach J, Shi Y, Simons JV, Skelly T, Soloway MG, Tan D, Veluvolu U, Fan H, Hinoue T, Laird PW, Shen H, Zhou W, Bellair M, Chang K, Covington K, Creighton CJ, Dinh H, Doddapaneni HV, Donehower LA, Drummond J, Gibbs RA, Glenn R, Hale W, Han Y, Hu J, Korchina V, Lee S, Lewis L, Li W, Liu X, Morgan M, Morton D, Muzny D, Santibanez J, Sheth M, Shinbrot E, Wang L, Wang M, Wheeler DA, Xi L, Zhao F, Hess J, Appelbaum EL, Bailey M, Cordes MG, Ding L, Fronick CC, Fulton LA, Fulton RS, Kandoth C, Mardis ER, McLellan MD, Miller CA, Schmidt HK, Wilson RK, Crain D, Curley E, Gardner J, Lau K, Mallery D, Morris S, Paulauskis J, Penny R, Shelton C, Shelton T, Sherman M, Thompson E, Yena P, Bowen J, Gastier-Foster JM, Gerken M, Leraas KM, Lichtenberg TM, Ramirez NC, Wise L, Zmuda E, Corcoran N, Costello T, Hovens C, Carvalho AL, de Carvalho AC, Fregnani JH, Longatto-Filho A, Reis RM, Scapulatempo-Neto C, Silveira HCS, Vidal DO, Burnette A, Eschbacher J, Hermes B, Noss A, Singh R, Anderson ML, Castro PD, Ittmann M, Huntsman D, Kohl B, le X, Thorp R, Andry C, Duffy ER, Lyadov V, Paklina O, Setdikova G, Shabunin A, Tavobilov M, McPherson C, Warnick R, Berkowitz R, Cramer D, Feltmate C, Horowitz N, Kibel A, Muto M, Raut CP, Malykh A, Barnholtz-Sloan JS, Barrett W, Devine K, Fulop J, Ostrom QT, Shimmel K, Wolinsky Y, Sloan AE, de Rose A, Giuliante F, Goodman M, Karlan BY, Hagedorn CH, Eckman J, Harr J, Myers J, Tucker K, Zach LA, Deyarmin B, Hu H, Kvecher L, Larson C, Mural RJ, Somiari S, Vicha A, Zelinka T, Bennett J, Iacocca M, Rabeno B, Swanson P, Latour M, Lacombe L, Têtu B, Bergeron A, McGraw M, Staugaitis SM, Chabot J, Hibshoosh H, Sepulveda A, Su T, Wang T, Potapova O, Voronina O, Desjardins L, Mariani O, Roman-Roman S, Sastre X, Stern MH, Cheng F, Signoretti S, Berchuck A, Bigner D, Lipp E, Marks J, McCall S, McLendon R, Secord A, Sharp A, Behera M, Brat DJ, Chen A, Delman K, Force S, Khuri F, Magliocca K, Maithel S, Olson JJ, Owonikoko T, Pickens A, Ramalingam S, Shin DM, Sica G, van Meir EG, Zhang H, Eijckenboom W, Gillis A, Korpershoek E, Looijenga L, Oosterhuis W, Stoop H, van Kessel KE, Zwarthoff EC, Calatozzolo C, Cuppini L, Cuzzubbo S, DiMeco F, Finocchiaro G, Mattei L, Perin A, Pollo B, Chen C, Houck J, Lohavanichbutr P, Hartmann A, Stoehr C, Stoehr R, Taubert H, Wach S, Wullich B, Kycler W, Murawa D, Wiznerowicz M, Chung K, Edenfield WJ, Martin J, Baudin E, Bubley G, Bueno R, de Rienzo A, Richards WG, Kalkanis S, Mikkelsen T, Noushmehr H, Scarpace L, Girard N, Aymerich M, Campo E, Giné E, Guillermo AL, van Bang N, Hanh PT, Phu BD, Tang Y, Colman H, Evason K, Dottino PR, Martignetti JA, Gabra H, Juhl H, Akeredolu T, Stepa S, Hoon D, Ahn K, Kang KJ, Beuschlein F, Breggia A, Birrer M, Bell D, Borad M, Bryce AH, Castle E, Chandan V, Cheville J, Copland JA, Farnell M, Flotte T, Giama N, Ho T, Kendrick M, Kocher JP, Kopp K, Moser C, Nagorney D, O’Brien D, O’Neill BP, Patel T, Petersen G, Que F, Rivera M, Roberts L, Smallridge R, Smyrk T, Stanton M, Thompson RH, Torbenson M, Yang JD, Zhang L, Brimo F, Ajani JA, Gonzalez AMA, Behrens C, Bondaruk J, Broaddus R, Czerniak B, Esmaeli B, Fujimoto J, Gershenwald J, Guo C, Lazar AJ, Logothetis C, Meric-Bernstam F, Moran C, Ramondetta L, Rice D, Sood A, Tamboli P, Thompson T, Troncoso P, Tsao A, Wistuba I, Carter C, Haydu L, Hersey P, Jakrot V, Kakavand H, Kefford R, Lee K, Long G, Mann G, Quinn M, Saw R, Scolyer R, Shannon K, Spillane A, Stretch J, Synott M, Thompson J, Wilmott J, al-Ahmadie H, Chan TA, Ghossein R, Gopalan A, Levine DA, Reuter V, Singer S, Singh B, Tien NV, Broudy T, Mirsaidi C, Nair P, Drwiega P, Miller J, Smith J, Zaren H, Park JW, Hung NP, Kebebew E, Linehan WM, Metwalli AR, Pacak K, Pinto PA, Schiffman M, Schmidt LS, Vocke CD, Wentzensen N, Worrell R, Yang H, Moncrieff M, Goparaju C, Melamed J, Pass H, Botnariuc N, Caraman I, Cernat M, Chemencedji I, Clipca A, Doruc S, Gorincioi G, Mura S, Pirtac M, Stancul I, Tcaciuc D, Albert M, Alexopoulou I, Arnaout A, Bartlett J, Engel J, Gilbert S, Parfitt J, Sekhon H, Thomas G, Rassl DM, Rintoul RC, Bifulco C, Tamakawa R, Urba W, Hayward N, Timmers H, Antenucci A, Facciolo F, Grazi G, Marino M, Merola R, de Krijger R, Gimenez-Roqueplo AP, Piché A, Chevalier S, McKercher G, Birsoy K, Barnett G, Brewer C, Farver C, Naska T, Pennell NA, Raymond D, Schilero C, Smolenski K, Williams F, Morrison C, Borgia JA, Liptay MJ, Pool M, Seder CW, Junker K, Omberg L, Dinkin M, Manikhas G, Alvaro D, Bragazzi MC, Cardinale V, Carpino G, Gaudio E, Chesla D, Cottingham S, Dubina M, Moiseenko F, Dhanasekaran R, Becker KF, Janssen KP, Slotta-Huspenina J, Abdel-Rahman MH, Aziz D, Bell S, Cebulla CM, Davis A, Duell R, Elder JB, Hilty J, Kumar B, Lang J, Lehman NL, Mandt R, Nguyen P, Pilarski R, Rai K, Schoenfield L, Senecal K, Wakely P, Hansen P, Lechan R, Powers J, Tischler A, Grizzle WE, Sexton KC, Kastl A, Henderson J, Porten S, Waldmann J, Fassnacht M, Asa SL, Schadendorf D, Couce M, Graefen M, Huland H, Sauter G, Schlomm T, Simon R, Tennstedt P, Olabode O, Nelson M, Bathe O, Carroll PR, Chan JM, Disaia P, Glenn P, Kelley RK, Landen CN, Phillips J, Prados M, Simko J, Smith-McCune K, VandenBerg S, Roggin K, Fehrenbach A, Kendler A, Sifri S, Steele R, Jimeno A, Carey F, Forgie I, Mannelli M, Carney M, Hernandez B, Campos B, Herold-Mende C, Jungk C, Unterberg A, von Deimling A, Bossler A, Galbraith J, Jacobus L, Knudson M, Knutson T, Ma D, Milhem M, Sigmund R, Godwin AK, Madan R, Rosenthal HG, Adebamowo C, Adebamowo SN, Boussioutas A, Beer D, Giordano T, Mes-Masson AM, Saad F, Bocklage T, Landrum L, Mannel R, Moore K, Moxley K, Postier R, Walker J, Zuna R, Feldman M, Valdivieso F, Dhir R, Luketich J, Pinero EMM, Quintero-Aguilo M, Carlotti CG, Jr, Dos Santos JS, Kemp R, Sankarankuty A, Tirapelli D, Catto J, Agnew K, Swisher E, Creaney J, Robinson B, Shelley CS, Godwin EM, Kendall S, Shipman C, Bradford C, Carey T, Haddad A, Moyer J, Peterson L, Prince M, Rozek L, Wolf G, Bowman R, Fong KM, Yang I, Korst R, Rathmell WK, Fantacone-Campbell JL, Hooke JA, Kovatich AJ, Shriver CD, DiPersio J, Drake B, Govindan R, Heath S, Ley T, van Tine B, Westervelt P, Rubin MA, Lee JI, Aredes ND, Mariamidze A. Comparative molecular analysis of gastrointestinal adenocarcinomas. Cancer Cell. 2018;33(4):721–735. doi: 10.1016/j.ccell.2018.03.010. - DOI - PMC - PubMed
    1. Cancer Genome Atlas Research N Comprehensive molecular characterization of gastric adenocarcinoma. Nature. 2014;513(7517):202–209. doi: 10.1038/nature13480. - DOI - PMC - PubMed

Publication types

MeSH terms