. 2021 Sep 7;9(1):183.
doi: 10.1186/s40168-021-01137-3.

Gut microbiota regulation of P-glycoprotein in the intestinal epithelium in maintenance of homeostasis

Affiliations

Gut microbiota regulation of P-glycoprotein in the intestinal epithelium in maintenance of homeostasis

Sage E Foley et al. Microbiome. .

Abstract

Background: P-glycoprotein (P-gp) plays a critical role in protection of the intestinal epithelia by mediating efflux of drugs/xenobiotics from the intestinal mucosa into the gut lumen. Recent studies bring to light that P-gp also confers a critical link in communication between intestinal mucosal barrier function and the innate immune system. Yet, despite knowledge for over 10 years that P-gp plays a central role in gastrointestinal homeostasis, the precise molecular mechanism that controls its functional expression and regulation remains unclear. Here, we assessed how the intestinal microbiome drives P-gp expression and function.

Results: We have identified a "functional core" microbiome of the intestinal gut community, specifically genera within the Clostridia and Bacilli classes, that is necessary and sufficient for P-gp induction in the intestinal epithelium in mouse models. Metagenomic analysis of this core microbial community revealed that short-chain fatty acid and secondary bile acid production positively associate with P-gp expression. We have further shown these two classes of microbiota-derived metabolites synergistically upregulate P-gp expression and function in vitro and in vivo. Moreover, in patients suffering from ulcerative colitis (UC), we find diminished P-gp expression coupled to the reduction of epithelial-derived anti-inflammatory endocannabinoids and luminal content (e.g., microbes or their metabolites) with a reduced capability to induce P-gp expression.

Conclusion: Overall, by means of both in vitro and in vivo studies as well as human subject sample analysis, we identify a mechanistic link between cooperative functional outputs of the complex microbial community and modulation of P-gp, an epithelial component, that functions to suppress overactive inflammation to maintain intestinal homeostasis. Hence, our data support a new cross-talk paradigm in microbiome regulation of mucosal inflammation. Video abstract.

Keywords: Endocannabinoid; Inflammation; Inflammatory bowel diseases; Intestinal epithelium; Microbiome; Multi-drug resistance transporter; P-glycoprotein; Secondary bile acids; Short-chain fatty acids; Ulcerative colitis.


Conflict of interest statement

B.A.M. and R.J.M. are coinventors on a patent application (PGT/US 18/42116) emanating, in part, from the findings described herein. They, along with their respective academic institutions, stand to gain financially through potential commercialization outcomes resulting from activities associated with the licensing of that intellectual property.

Figures
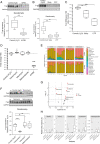
Fig. 1
Fig. 1
Vancomycin-sensitive gut microbiota is required for colonic P-gp expression. A, D WT SPF mice were treated with AVNM for 10 days. Representative western blot of P-gp protein expression in colonic tissue is shown, each lane representing a replicate mouse within each group. N = 10 mice per group; ****p < 0.0001, unpaired t test. B, C WT SPF mice were treated with streptomycin (Strep) or cefoperazone (CFP) for 7 days. B P-gp protein expression was measured as in A. Representative western blot is shown, each lane representing a replicate mouse within each group. N = 6 mice per group; ***p = 0.0003, ****p < 0.0001, one-way ANOVA with Dunnett’s multiple comparisons test. C Fold difference changes in relative amount of 16S DNA in feces collected from mice on the last day of antibiotic treatment are shown. Data are pooled from two independent experiments, N = 6 per group ****p < 0.0001, **p = 0.0028 one-way ANOVA with Dunnett’s multiple comparisons test, statistical test for both based on ΔΔCt values. D Fold difference in relative amount of 16S DNA in feces collected from mice on day 10 of antibiotic delivery (A, E–H), relative to control. Data are pooled from two independent experiments, N = 10 mice per group. *p = 0.0178, ****p < 0.0001, one-way ANOVA with Dunnett’s multiple comparisons test, based on ΔΔ Ct values. D–H WT SPF mice were treated with vancomycin, neomycin, metronidazole, or AVNM for 10 days. E Relative abundance of bacterial genera in mouse fecal microbiota. Representative plot from each of two independent experiments is shown. N = 5 per group, per experiment. F P-gp protein expression was measured as in (A, B). An internal control (“IC”) lysate was included across multiple blots for normalization. Representative western blot is shown, each lane representing a replicate mouse within each group. N = 10 mice per group; ****p < 0.0001, ns p > 0.05, one-way ANOVA with Dunnett’s multiple comparisons test. A, B, F Densitometry data describe samples pooled from two independent experiments. G Bacterial genera positively or negatively correlated with colonic P-gp expression by Spearman correlation test of sequencing data from experiments performed in Fig. 1, significance indicated by p < 0.05. H Relative abundance of bacterial genera positively correlated with colonic P-gp expression shown in G
Fig. 2
Fig. 2
Colonization of mice with gram-positive microbiota is sufficient to induce P-gp expression. A WT germ-free mice were colonized with cecal contents from a WT donor mouse. After 14 days, P-gp protein expression was measured in colonic tissue by western blot. N = 7–10 mice per group; ***p = 0.0005, unpaired t test. B Schematic of reconstitution by coprophagy for experiments shown in C, D. WT “donor” mice were treated with antibiotic for 7 days. AVNM-treated WT “recipient” mice were then cohoused with “donor” mice from each of the other groups for 7 days. C P-gp protein expression was measured as in A. Representative western blot is shown, each lane representing a replicate mouse within each group. An internal control (“IC”) lysate was included across multiple blots for normalization. N = 6–8 mice per group; ****p < 0.0001 by one-way ANOVA with Tukey’s multiple comparisons test. A, C Densitometry data describe samples pooled from two independent experiments. D Bray-Curtis based nonmetric multidimensional scaling (NMDS) ordination of fecal microbiota from mice in B, C. Each dot represents an individual mouse from one representative experiment, with treatment groups denoted by color: Un_R untreated recipient, Un_D untreated donor, V_R vancomycin recipient, V_D vancomycin donor, N_R neomycin recipient, N_D neomycin donor, and AVNM
Fig. 3
Fig. 3
Short-chain fatty acid- and secondary bile acid-producing bacteria positively correlate with colonic P-gp expression. A Volcano plot showing the rho coefficient and corresponding p value of Spearman’s correlation test of relative abundance of microbial genes from whole genome sequencing data (regrouped to KO groups) relative to expression of P-gp by western blot densitometry in each mouse. Significance set at p < 0.05. KOs involved in butyrate and secondary bile acid metabolism pathways are labeled. B Positively correlated KOs identified in A with corresponding enzyme commission (EC) numbers, definition, and involved pathways being indicated
Fig. 4
Fig. 4
Butyrate and secondary bile acids induce P-gp to limit neutrophil transmigration across the epithelium. A–C T84 cells incubated with 5 mM butyrate, 50 μM LCA, 50 μM DCA, and/or 50 μM UDCA for 24 h. A Representative western blot showing P-gp expression in lysates. B Densitometry data describe samples pooled from at least two independent experiments; *p = 0.0199, ***p = 0.0002, ****p < 0.0001, one-way ANOVA with Tukey’s multiple comparisons test. C T84 cells were treated as in A, B, prior to measurement of Rho123 retention. Data reflect inverse of geometric mean of Rho123 fluorescence intensity. Data describe samples pooled from at least two independent experiments; *p < 0.05, ****p < 0.0001, one-way ANOVA with Dunnett’s multiple comparisons test of each sample compared to DMSO control. D WT germ-free mice were delivered butyrate orally for 14 days. P-gp protein expression was measured in colonic tissue by western blot. Representative western blot is shown, each lane representing a replicate mouse within each group. Densitometry data describe samples pooled from two independent experiments; N = 6–7 mice per group; ***p = 0.0004, unpaired t test. E, F WT SPF mice were delivered cholestyramine (CME) in mouse chow for 14 days. P-gp protein expression was measured by western blot in colon tissue (E) or cecum tissue (F). E, F Representative western blot is shown, each lane representing a replicate mouse within each group. Densitometry shown relative to control group without cholestyramine. Data describe samples pooled from two independent experiments. N = 8 mice per group. E *p = 0.0237, unpaired t test. F ***p = 0.0009, unpaired t test. G Schematic of neutrophil migration experiment (BioRender). T84 cells seeded on the bottom-facing surface of Transwell® plates were preincubated with metabolites for 24 h. Primary neutrophils were added to the top (basolateral) compartment, purified HXA3 was added to the bottom (apical) compartment, and the number of primary neutrophils that migrated across the T84 cell monolayer were quantitated. H T84 cells seeded as in G were incubated with butyrate, LCA, DCA, and/or UDCA as in A–C. Migration of primary neutrophils across this cell monolayer to HXA3 in the apical compartment was quantified. Data shown indicate individual replicate wells and are representative of at least three independent experiments; ****p < 0.0001, ns p > 0.05, one-way ANOVA with Tukey’s multiple comparisons test
Fig. 5
Fig. 5
Human UC intestinal contents are unable to maintain P-gp expression. A Diagram of human sample collection (BioRender). B Representative western blot of P-gp expression in human patient colon biopsies, showing healthy control versus UC patient, and uninvolved versus involved tissue, with samples from same UC patients indicated with brackets. C Densitometry data of B, N = 7–9 patients per group, red squares indicate 3 pan-colitis patients; **p = 0.0012, one-way ANOVA with Tukey’s multiple comparisons test. D Palmitoyl ethanolamide (PEA), oleoyl ethanolamide (OEA), and anandamide (AEA) 20:2 measured in mucosal brushings of human patients. N = 4 healthy controls, N = 7–8 UC patients. **p = 0.0013, one-way ANOVA with Tukey’s multiple comparisons test. E Functional P-gp expression induced by human patient fecal samples in T84 cells in vitro. Data are normalized to representative vehicle control bowel prep solution; N = 5–11 patients per group; *p < 0.05, one-way ANOVA with Tukey’s multiple comparisons
Fig. 6
Fig. 6
A working model of microbiome-driven P-gp expression. We have identified a bacterial population containing Bacilli and Clostridia classes that is sufficient to induce P-gp expression in the colon. Butyrate and secondary bile acids produced by these bacteria from dietary substrates together potentiate the induction of functional P-gp expression on the epithelium which is capable of blocking neutrophil migration through efflux of its endogenous substrates, endocannabinoids [2]. Our observations suggest converging intracellular pathways to amplify P-gp expression; we propose these pathways include one or more of the following: GPCR activation, HDAC inhibition, NRF2 activation, PXR activation. Schematic made with BioRender

Similar articles

Cited by

References

    1. Pazos M, Siccardi D, Mumy KL, Bien JD, Louie S, Shi HN, Gronert K, Mrsny RJ, McCormick BA. Multidrug resistance-associated transporter 2 regulates mucosal inflammation by facilitating the synthesis of hepoxilin A3. J Immunol. 2008;181(11):8044–8052. doi: 10.4049/jimmunol.181.11.8044. - DOI - PMC - PubMed
    1. Szabady RL, Louissaint C, Lubben A, Xie B, Reeksting S, Tuohy C, Demma Z, Foley SE, Faherty CS, Llanos-Chea A, Olive AJ, Mrsny RJ, McCormick BA. Intestinal P-glycoprotein exports endocannabinoids to prevent inflammation and maintain homeostasis. J Clin Invest. 2018;128(9):4044–4056. doi: 10.1172/JCI96817. - DOI - PMC - PubMed
    1. Gottesman MM, Pastan I, Ambudkar SV. P-glycoprotein and multidrug resistance. Curr Opin Genet Devel. 1996;6(5):610–617. doi: 10.1016/S0959-437X(96)80091-8. - DOI - PubMed
    1. Brinar M, Cukovic-Cavka S, Bozina N, Ravic KG, Markos P, Ladic A, et al. MDR1 polymorphisms are associated with inflammatory bowel disease in a cohort of Croatian IBD patients. BMC Gastroenterol. 2013;13(1). 10.1186/1471-230X-13-57. - PMC - PubMed
    1. Brant SR, Panhuysen CI, Nicolae D, Reddy DM, Bonen DK, Karaliukas R, Zhang L, Swanson E, Datta LW, Moran T, et al. MDR1 Ala893 polymorphism is associated with inflammatory bowel disease. Am J Hum Genet. 2003;73(6):1282–1292. doi: 10.1086/379927. - DOI - PMC - PubMed

Publication types

Substances

LinkOut - more resources