

Variation in serum urate levels in the absence of gout and urate lowering therapy
- PMID: 34493347
- PMCID: PMC8425059
- DOI: 10.1186/s41927-021-00202-6
Variation in serum urate levels in the absence of gout and urate lowering therapy
Abstract
Background: Previous studies have noted significant variation in serum urate (sUA) levels, and it is unknown how this influences the accuracy of hyperuricemia classification based on single data points. Despite this known variability, hyperuricemic patients are often used as a control group in gout studies. Our objective was to determine the accuracy of hyperuricemia classifications based on single data points versus multiple data points given the degree of variability observed with serial measurements of sUA.
Methods: Data was analyzed from a cross-over clinical trial of urate-lowering therapy in young adults without a gout diagnosis. In the control phase, sUA levels used for this analysis were collected at 2-4 week intervals. Mean coefficient of variation for sUA was determined, as were rates of conversion between normouricemia (sUA ≤6.8 mg/dL) and hyperuricemia (sUA > 6.8 mg/dL).
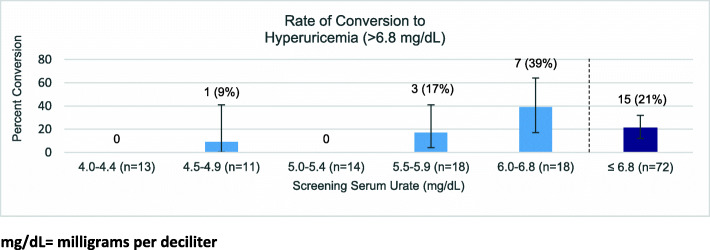
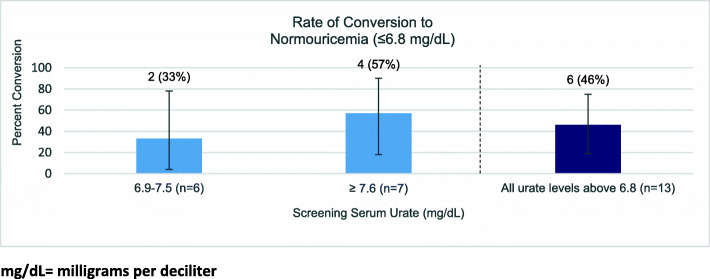
Results: Mean study participant (n = 85) age was 27.8 ± 7.0 years, with 39% female participants and 41% African-American participants. Mean sUA coefficient of variation was 8.5% ± 4.9% (1 to 23%). There was no significant difference in variation between men and women, or between participants initially normouricemic and those who were initially hyperuricemic. Among those initially normouricemic (n = 72), 21% converted to hyperuricemia during at least one subsequent measurement. The subgroup with initial sUA < 6.0 (n = 54) was much less likely to have future values in the range of hyperuricemia compared to the group with screening sUA values between 6.0-6.8 (n = 18) (7% vs 39%, p = 0.0037). Of the participants initially hyperuricemic (n = 13), 46% were later normouricemic during at least one measurement.
Conclusion: Single sUA measurements were unreliable in hyperuricemia classification due to spontaneous variation. Knowing this, if a single measurement must be used in classification, it is worth noting that those with an sUA of < 6.0 mg/dL were less likely to demonstrate future hyperuricemic measurements and this could be considered a safer threshold to rule out intermittent hyperuricemia based on a single measurement point.
Trial registration: Data from parent study ClinicalTrials.gov Identifier: NCT02038179 .
© 2021. The Author(s).
Conflict of interest statement
Kenneth G Saag reports the following: Consultant for Arthrosi, Atom Bioscience, Horizon, Inflazome, LG Pharma, Mallinkrodt, SOBI, Takeda; research grants from Horizon, SOBI, and Shanton. No other authors report conflicts of interests.
Figures
References
Associated data
LinkOut - more resources
Full Text Sources
Medical
